
Abstract
Background:
In observational studies, higher uric acid levels are associated with metabolic syndrome, diabetes, and kidney disease.
Objective:
The objective of this study is to examine whether reduction of plasma uric acid with febuxostat, a xanthine oxido reductase inhibitor, impacts adipose tissue oxidative stress, adipokines, and markers of systemic inflammation or kidney fibrosis.
Design:
This was a double-blinded randomized controlled trial.
Setting:
Academic university setting was used.
Patients:
Overweight or obese adults with hyperuricemia and type 2 diabetic nephropathy were included.
Measurements:
Adipose tissue thiobarbituric acid reducing substances (TBARS) and adiponectin concentrations and urinary transforming growth factor–β (TGF-β) were primary endpoints. Plasma C-reactive protein, high molecular weight–adiponectin, interleukin–6, tumor necrosis factor–α, and TBARS and albuminuria were among predefined secondary endpoints.
Methods:
Participants were randomly assigned to febuxostat (n = 40) or matching placebo (n = 40) and followed for 24 weeks.
Results:
Baseline plasma uric acid levels were 426 ± 83 µmol/L; 95% completed the study. Estimated glomerular filtration rate (eGFR) declined from 54 ± 17 mL/min/1.73 m2 at baseline to 51 ± 17 mL/min/1.73 m2 at 24 weeks (P = .05). In separate mixed-effects models, compared with placebo, febuxostat reduced uric acid by 50% (P < .001) but had no significant effects on subcutaneous adipose tissue TBARS (−7.4%, 95% confidence interval [CI], 57.4%-101.4%) or adiponectin (6.7%, 95% CI, 26.0%-53.8%) levels or urinary TGF-β/creatinine ratio (18.0%, 95% CI, 10.0%-54.8%) or secondary endpoints.
Limitations:
Relatively modest sample size and short duration of follow-up.
Conclusions:
In this population with progressive diabetic nephropathy, febuxostat effectively reduced plasma uric acid. However, no detectable effects were observed for the prespecified primary or secondary endpoints.
Trial Registration:
The study was registered in clinicaltrials.gov (NCT01350388).
What Was Known Before
Observational data suggest that high uric acid level might be a risk factor for metabolic syndrome, diabetes, and kidney disease.
What This Adds
Lowering uric acid with febuxostat for 24 weeks did not affect adipokines or markers of adipose tissue oxidative stress, systemic inflammation, or kidney fibrosis.
Background
Uric acid is considered an independent risk factor for cardiovascular disease,1-4 kidney disease,5-9 diabetes, 10 hypertension, 11 and metabolic syndrome 12 ; however, it remains controversial whether uric acid is playing a pathogenic role or is just an epiphenomenon associated with those metabolic abnormalities. The notion that uric acid might play a causative role in the metabolic effects of obesity such as diabetes is supported by experimental data.13-16 Adipokines, the protein hormones produced by the adipocytes, include tumor necrosis factor–α (TNF-α), interleukin–6 (IL-6), plasminogen activator inhibitor (PAI-1), leptin, angiotensinogen, and adiponectin. In obesity, the production of TNF-α, IL-6, PAI-1, leptin, and angiotensinogen increases, whereas the production of adiponectin decreases. Increased expression of pro-inflammatory TNF-α and IL-6 and decreased expression of anti-inflammatory adiponectin by adipocytes result in insulin resistance and inflammation.
Oxidative stress in adipose tissue is considered to play a critical role in dysregulation of adipokines production in obesity,17,18 and high uric acid levels induce oxidative stress in adipocytes. 13 Furthermore, experimental data suggest that intervention with uric acid lowering therapy might ameliorate adipose tissue oxidative stress and adipokine dysregulation in obesity.13-16
In contrast to allopurinol, febuxostat provides more selective and potent inhibition of xanthine oxidase and greater hypouricemic activity.19-21 In addition, febuxostat is excreted primarily through the liver, whereas allopurinol is renally excreted. Hence, febuxostat is well suited as a hypouricemic agent in chronic kidney disease (CKD).
Therefore, we hypothesized that febuxostat therapy will decrease hyperuricemia and thereby have beneficial effects on adipokine production in adipose tissue, decrease plasma levels of markers of inflammation and oxidative stress, and, as a result of the above, urinary markers of kidney fibrosis and albuminuria will improve. We examined in a placebo-controlled, double-blinded study in diabetic patients with CKD and hyperuricemia the effects of febuxostat therapy on the primary endpoints of adipose tissue thiobarbituric acid reducing substances (TBARS) and adiponectin concentrations and urinary transforming growth factor–β (TGF-β).
Methods
Study Design
This was a double-blinded randomized controlled trial (RCT) approved by the University of Utah Institutional Review Board. All participants gave written informed consent. The study was monitored by a 3-member Data Safety Monitoring Board. The study was registered in clinicaltrials.gov (NCT01350388). The study was investigator-initiated and funded by a grant from Takeda Pharmaceuticals USA, Inc. The sponsor had no role in the design and conduct of the study or analysis and interpretation of results or preparation of the manuscript.
Inclusion criteria
Serum uric acid levels ≥327 µmol/L in men and ≥274 µmol/L in women were associated with increased risk of incident metabolic syndrome in a large epidemiological study. 12 Hence, we adopted these levels for inclusion criteria in the current study. The other inclusion criteria were adults with diagnosis of type 2 diabetes and kidney disease defined as estimated glomerular filtration rate (eGFR) 30 to <60 mL/min/1.73 m2 by 4-variable Modification of Diet in Renal Disease (MDRD) or eGFR ≥60 mL/min/1.73 m2 with urine dipstick ≥1+ protienuria or urine albumin/creatinine ≥3.4mg/mmol.
Exclusion criteria
Absolute exclusion criteria included age less than 18 years; history of gout; concurrent use of azathioprine, mercaptopurine, theophylline, allopurinol, or warfarin; current antibiotic therapy; pregnant women and prisoners; known noncompliance; current active malignancy (excluding squamous and basal cell skin cancers); active AIDS; chronic lung disease requiring supplemental oxygen therapy; and patients enrolled in interventional trials using drugs or devices. In addition, to minimize the risks of febuxostat, patients with active liver disease transaminases (>2.5 times the upper limit of normal at baseline) were excluded.
Recruitment and Screening
Potential participants were recruited from December 19, 2011, until May 9, 2013, at the University of Utah Health Sciences Clinics and the affiliated Department of Veterans Affairs Medical Center. All potential participants underwent a screening visit conducted by trained study coordinators using standardized questionnaires to assess above inclusion and exclusion criteria. Proteinuria, serum creatinine, uric acid, and liver function tests were measured as screening tests.
Baseline study visit and data collection
Trained study coordinators obtained demographic and comorbidity information using standardized questionnaires. Anthropometric measurements and vitals were obtained following standardized protocols. Thirty milliliter of blood was drawn in serum separator and lithium-heparin tubes. The blood samples were centrifuged within 15 minutes and then divided into multiple aliquots of 1 mL each and frozen immediately with dry ice and transferred to a −80°C freezer. Ten milliliter samples of urine were collected, centrifuged, divided into multiple 1 mL aliquots and frozen immediately using dry ice, and then transferred to a −80°C freezer. Under sterile aseptic precautions, using local anesthesia, percutaneous fat biopsies were collected from the lateral abdomen wall using 5-mm diameter side-cutting needle at baseline and 24 weeks. Biopsy samples were flash frozen immediately after collection and transferred to a −80°C freezer.
Intervention
Participants were randomly allocated to oral febuxostat 80 mg/d or matching placebo for 24 weeks by blocks of 4 using a random number generator and monitored for adverse events. Study stopping points included elevated liver enzymes (twice the upper limit of normal) or eGFR decline (below 20 mL/min/1.73 m2 or 50% decline below baseline).
The investigators, study staff, and participants were blinded to the treatment assignment. The University of Utah Hospital Investigational Drug Service Pharmacy procured febuxostat and matching placebo from the sponsor, randomized the patients, and maintained the double-blind.
Follow-up visits occurred at weeks 2, 4, 12, and 24. During these visits, standardized clinical assessment was performed for the assessment of side effects. Data on adherence were obtained with pill count. Hospitalizations and emergency room (ER) visits were ascertained. Blood and urine samples were collected, processed, and stored as above. Renal and liver function tests were measured at each visit for safety assessment. Percutaneous fat biopsies were performed at 24 weeks.
Assays
Plasma uric acid, high-sensitivity C-reactive protein (CRP), high molecular weight (HMW) adiponectin, IL-6, TNF-α, leptin and malondialdehyde (MDA) also known as thiobarbituric acid-reactive substances (TBARS), urine TGFβ1, adipose tissue adiponectin, and leptin and TBARS concentrations were measured following standardized protocols. The details of the assays are provided in the supplement.
Statistical Methods
Descriptive statistics for continuous variables were presented by mean ± standard deviation or medians and 25th and 75th percentiles as appropriate. Categorical variables were presented by frequencies and proportions. Baseline characteristics were compared between the febuxostat and placebo groups by 2-sample t tests for continuous variables and by chi-square or Fisher’s exact tests for categorical variables. Skewed variables were log-transformed prior to statistical analyses.
The predefined primary endpoints were adipose tissue TBARS and adiponectin concentrations and urinary excretion of TGF-β. Plasma HMW adiponectin, leptin, CRP, TBARS, TNF-α and IL-6, eGFR, and urine albumin/creatinine ratio (ACR) were the secondary endpoints.
Treatment effects on the primary and secondary outcomes at weeks 12 and 24 were estimated using mixed-effects models with fixed effects for treatment, visit and the treatment by visit interaction, and an unstructured covariance matrix to account for serial correlation in the outcome over time. 22 The levels of the outcome were assumed to be equal between the treatment and placebo groups at baseline, so that treatment effects were effectively estimated with adjustment for the baseline levels of the outcome. Results of log-transformed outcomes were exponentiated, so that estimates of treatment effects were expressed as percent differences in geometric means. The primary analyses evaluated the average of the comparisons between the treatment and placebo groups across the 12-week and 24-week visits. Under the mixed modeling approach, outcome measurements obtained prior to the time a patient was lost to follow-up were retained in the analysis, and the reported results can be assumed to be approximately unbiased if missing data are missing at random.
In additional sensitivity analyses, factors that were imbalanced between the febuxostat and placebo groups at an alpha of .2 level were adjusted for in the above models. These variables were cancer, body mass index (BMI), diastolic blood pressure (BP), use of angiotensinogen converting enzyme inhibitor (ACE-I)/angiotensin receptor blocker (ARB), and other antihypertensives and statins.
Power calculations for the 3 co-primary endpoints are described in the supplemental materials. We performed analyses using Stata 12 and SAS version.
Results
Of the 152 individuals who completed the screening visit, 70 individuals were excluded for the following reasons: refused to participate (n = 7), serum uric acid below the target range (n = 17), eGFR < 30 mL/min/1.73 m2 (n = 5), eGFR > 60 mL/min/1.73 m2 without documented albuminuria (n =23), or met an absolute exclusion criteria (n = 18). Two participants who were randomized erroneously were dropped. Excluding these two participants, the randomization goal of 40 participants in each group was met (Figure 1).

Flowchart of study participants.
Baseline characteristics of the study population are summarized in Table 1. The study population was older (68 ± 10 years), predominantly Caucasian (87.5%) and male (65.0%) with high prevalence of comorbid conditions such as coronary artery disease (18.8%). As expected, the mean baseline BMI (34.6 ± 6.8 kg/m2) was high. Mean eGFR was 53.5 ± 17.2 mL/min/1.73 m2, and 35.4% had albuminuria (urine ACR > 3.4 mg/mmol). The intervention and placebo groups were generally well matched in their baseline clinical characteristics (Table 1). However, compared with the placebo group, the intervention group also had higher BMI (P = .04) and lower use of antihypertensive medications (P = .04) and ACE-I/ARB (P = .04).
Baseline Characteristics in the Study Population.

Note. Mean ± SD or median (25th-75th percentiles) are presented for continuous variables, N and percentage for categorical variables. BP = blood pressure; ACE-I = angiotensinogen converting enzyme inhibitor; ARB = angiotensin receptor blocker; eGFR = estimated glomerular filtration rate; ACR = albumin/creatinine ratio.
P values for comparisons of the listed baseline characteristics between treatment groups were greater than .05 with the exception of BMI (P = .04), antihypertensive medications (P = .04), and ACE-I/ARB (P = .04).
Adipose tissue, plasma, and urine markers of the study population are summarized in Table 2. Compared with historic healthy controls from previous publications,23-32 the study population was characterized by increased adipose tissue and plasma markers of oxidative stress, lower plasma levels of anti-inflammatory adiponectin, higher plasma levels of markers of inflammation, and urinary markers of fibrosis (Table 2).
Distribution of Adipose Tissue, Plasma, and Urine Markers at Baseline in the Study Population and Historic Controls.

Note. ESRD=; End stage renal disease; IQR = interquartile range; TBARS = thiobarbituric acid reducing substances; HMW-A = high molecular weight–adiponectin; CRP = C-reactive protein; TNF-α = tumor necrosis factor–α; IL-6 = interleukin–6; TGF-β = transforming growth factor–β.
As summarized in Figure 1, 76 (95%) participants completed the study. One participant in the placebo group and 3 participants in the febuxostat group were nonadherent and withdrew from the study. All of these participants withdrew from the study within the first 12 weeks. Plasma and urine samples at week 4 visit were available in 3 (1 in placebo and 2 in febuxostat group) of these patients, and these were included in the week 12 analyses. In addition, 1 participant in the placebo group (at week 4, for headaches) and 1 participant in the febuxostat group (at week 12, for elevated liver function tests) were withdrawn from the intervention but completed the study off the intervention. Data of these participants were included in the analyses with the intent-to-treat principle.
Plasma uric acid levels were high and not different between the febuxostat and placebo groups at baseline (Figure 2). Compared with placebo, febuxostat therapy reduced plasma uric acid levels by 49.9% ± 2.9% at week 12, and this was maintained at week 24 (Figure 2). Overall, febuxostat was well tolerated. There was 1 episode of elevated liver enzymes in the febuxostat group at week 12 which warranted cessation of the intervention. However, liver function tests returned to normal after cessation of therapy. There were no differences in the adverse events between the 2 groups which are summarized in Supplement Tables 1 and 2.
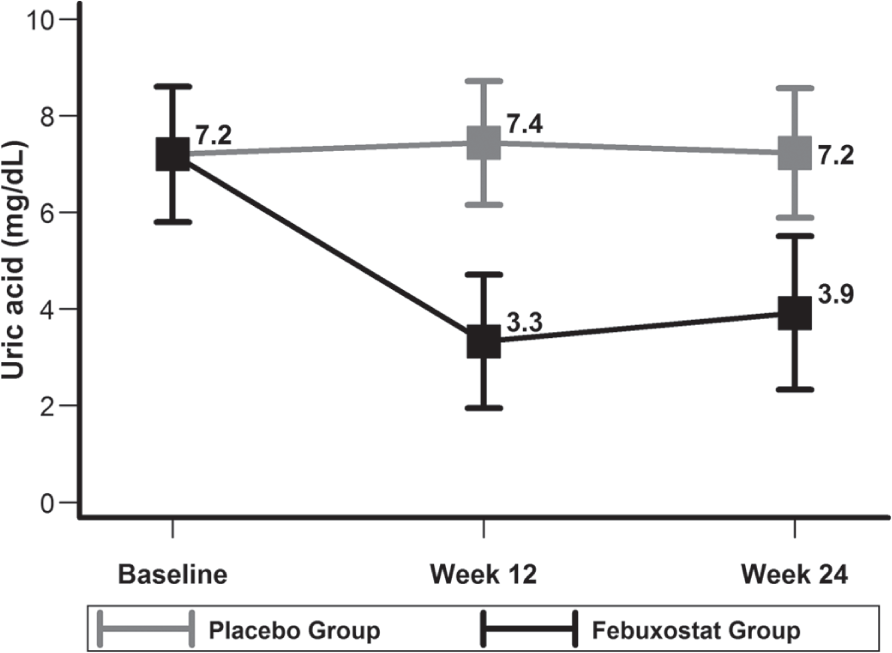
Description of mean ± SD of baseline and follow-up plasma uric acid levels in febuxostat and placebo groups.
Raw data of the subcutaneous adipose tissue, plasma, and urinary parameters are summarized in Tables 3 to 5, and the effects of febuxostat on these parameters in mixed-effects models are summarized in Figure 3 and Table 6.
Description of Adipose Tissue Parameters at Baseline and End of the Study in Febuxostat and Placebo Groups.

Note. CI = confidence interval; TBARS = thiobarbituric acid reducing substances.
Adjusted geometric mean changes between baseline and week 24 estimated under a mixed-effects analysis.
Description of Plasma Adipokines and Markers of Inflammation and Oxidative Stress at Baseline, Week 12, and Week 24 in Febuxostat and Placebo Groups.

Note. CI = confidence interval; HMW-A = high molecular weight–adiponectin; CRP = C-reactive protein; TBARS = thiobarbituric acid reducing substances; TNF-α = tumor necrosis factor–α; IL-6 = interleukin–6.
Adjusted geometric mean changes between baseline and average of the week 12 and week 24 levels estimated under a mixed-effects analysis.
Description of Urinary TGF-β and Albumin at Baseline, Week 12, and Week 24 in Febuxostat and Placebo Groups.

Note. TGF-β = transforming growth factor–β; CI = confidence interval.
Adjusted geometric mean changes between baseline and average of the week 12 and week 24 levels estimated under a mixed-effects analysis.
Mixed-effects models of between the groups comparisons of the primary endpoint.
Mixed-Effects Models of Between the Groups Comparisons of the Secondary Endpoints.

Note. HMW-A = high molecular weight–adiponectin; hsCRP = high-sensitivity C-reactive protein; TBARS = thiobarbituric acid reducing substances; TNF-α = tumor necrosis factor–α; IL-6 = interleukin–6; eGFR = estimated glomerular filtration rate; CI = confidence interval; BMI = body mass index; BP = blood pressure; ACE-I = angiotensinogen converting enzyme inhibitor; ARB = angiotensin receptor blocker.
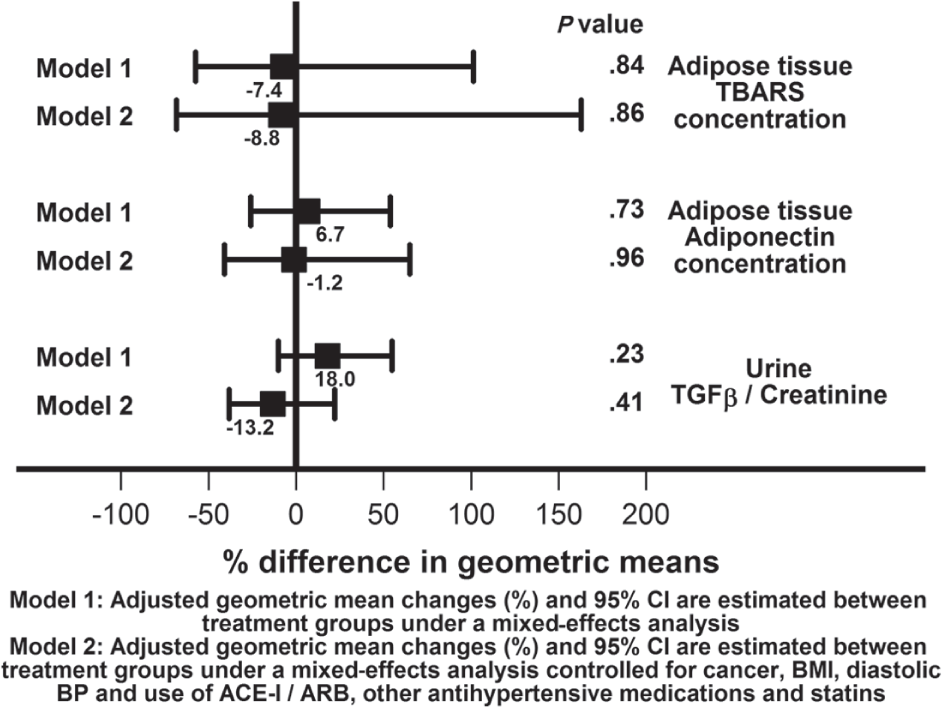
Adjusted geometric mean changes (%) and 95% CI are estimated between treatment groups under a mixed-effects analysis.
Adjusted geometric mean changes (%) and 95% CI are estimated between treatment groups under a mixed-effects analysis controlled for cancer, BMI, diastolic BP and use of ACE-I/ARB, and other antihypertensive medications and statins.
The predefined primary endpoints were adipose tissue TBARS and adiponectin concentrations and urinary excretion of TGF-β. As shown in Figure 3, compared with placebo, with febuxostat therapy there were no significant differences in subcutaneous adipose tissue TBARS concentration (−7.4%, 95% confidence interval [CI], 57.4%-101.4%, P = .84) or adiponectin concentration (6.7%, 95% CI, 26.0%-53.8%, P = .73). There were also no significant differences in urinary TGF-β excretion (18.0%, 95% CI, 10.0%-54.8%, P = .23). With additional adjustment for factors that were imbalanced between the two groups at baseline (cancer, BMI, diastolic BP, use of ACE-I/ARB, and other antihypertensives and statins), the results were consistent with the main model (subcutaneous adipose tissue TBARS concentration: −8.8%, 95% CI, 68.4%-162.9%, or adiponectin concentration: −1.2%, 95% CI, 40.8%-64.9%). There were also no significant differences in urinary TGF-β excretion (−13.2%, 95% CI, 8.3%-22.0%).
Plasma and urinary concentrations of various markers during the study are summarized in Tables 4 and 5. The effects of febuxostat compared with placebo on these markers in mixed-effects models are summarized in Table 6. Compared with the placebo group, in the adjusted model, febuxostat group had 25.7% reduction in IL-6 levels with a trend toward statistical significance (P = .06). However, none of the other markers were significantly different between febuxostat and placebo groups (Table 6).
The mean eGFR declined by ~3 mL/min/1.73 m2 over 6 months for an annualized loss of 6 mL/min/1.73 m2 in both groups (Supplemental Table 3). However, no effects of febuxostat on eGFR, systolic or diastolic BP, or the number of antihypertensive medications were noted (Supplemental Table 3).
Discussion
In this RCT, febuxostat was effective in lowering serum uric acid. However, contrary to our research hypothesis, compared with placebo, febuxostat therapy did not affect the subcutaneous adipose tissue oxidative stress or adipokine concentrations. It also did not significantly affect plasma levels of adipokines or markers of inflammation and oxidative stress. Similarly, we found no evidence of treatment effects on urinary markers of kidney fibrosis and inflammation as well as urinary albumin excretion.
As discussed earlier, experimental studies of cell cultures and animal models suggest that uric acid per se and/or xanthine oxido reductase (XOR), the enzyme involved in the production of uric acid, could play a causal role in diabetes, cardiovascular disease, or kidney disease.13-16 As shown in Table 2, compared with historic healthy controls, the diabetic CKD population in the current study had elevated levels of markers of oxidative stress and/or inflammation in subcutaneous adipose tissue and/or plasma as well as increased urinary markers of kidney fibrosis. Therefore, the current study population is well suited to examine whether decreasing uric acids levels with febuxostat improves metabolic milieu in stage III diabetic CKD.
Nonetheless, effective therapy for lowering serum uric acid did not ameliorate subcutaneous adipose tissue oxidative stress or alter adiponectin concentrations. However, drugs such as thiazolidinediones that have been shown to affect plasma adiponectin levels have demonstrable effects on subcutaneous adipose tissue adiponectin production in studies with similar or smaller number of patients and similar or shorter duration.33-36
Epidemiological studies suggest that hyperuricemia is a risk factor for kidney disease progression. 6 In animal models of hyperuricemia, therapy with allopurinol or febuxostat decreased kidney damage.7,9 In the current study, the mean eGFR declined by 3 mL/min/1.73 m2 over 6 months for an annualized loss of 6 mL/min/1.73 m2 (Supplemental Table 4) consistent with progressive nephropathy. As urinary TGF-β has been shown to be a marker of kidney fibrosis 37 and predicts the progression of kidney disease,37-41 it was chosen as a predefined primary outcome in this study. We did not observe an effect of febuxostat on markers of urinary fibrosis or inflammation (Table 6). Furthermore, we did not observe an effect of febuxostat therapy on albuminuria (Table 6) or eGFR (Supplemental Table 3).In a meta-analysis of 8 RCTs that compared allopurinol with placebo/standard of care42-48 with a follow-up duration of 4 to 24 months, there was no effect on proteinuria or BP or serum creatinine. 49 In contrast, in a more recent RCT of stage 3 and 4 CKD patients 50 treated with febuxostat 40 mg (n= 45) or placebo (n = 48) for 6 months reported a nonsignificant increase in eGFR with febuxostat from 31.5 ± 13.6 to 34.7 ± 18.1 mL/min/1.73 m2 and a significant decrease in eGFR with placebo from 32.6 ±11.6 to 28.2 ± 11.5 mL/min/1.73 m2. The biological plausibility of febuxostat reversing kidney damage and improving kidney function is unclear. However, large RCTs are needed to definitively determine whether uric acid lowering therapies could reduce CKD progression.
In animal models, higher serum uric acid levels result in elevated BP and reducing uric acid with either a xanthine oxidase inhibitor or a uricosuric agent reduced BP. 51 Epidemiological studies suggest that hyperuricemia is a risk factor developing hypertension in young adults.52,53 However, the strength of the relationship between uric acid level and hypertension decreases with increasing patient age and duration of hypertension. 1 We did not observe an effect of febuxostat therapy on BP or number of BP medications in the current study (Supplemental Table 3).
It is conceivable that at even higher serum levels of uric acid, febuxostat might impact adipokines and kidney disease. However, it should be noted that despite higher levels of baseline uric acid, allopurinol did not affect eGFR or albuminuria in the above-mentioned studies4,42-45,47,48 with the exception of the Sircar et al. study. 50
Febuxostat was well tolerated at 80 mg/d dose in this CKD population. There was 1 episode of increase in liver enzymes in the febuxostat group which warranted cessation of the intervention.
A strength of the study is a very high retention rate (95%), and the study population was adherent to the intervention as evidenced by pill count and the serum uric acid levels.
One of the limitations of the current study is the relatively modest sample size and short duration of follow-up. Hence, larger, longer term studies are needed to draw definitive conclusions. Other limitations of the current study include a single center study in a predominantly Caucasian population. We also did not measure glycated hemoglobin levels. As the current study was not designed to examine the effects of uric acid lowering therapies on cardiovascular parameters such as left ventricular hypertrophy, arterial stiffness, endothelial dysfunction, or atherosclerosis, no inferences on the effects of uric acid lowering therapies on cardiovascular disease in CKD could be drawn from this study.
Conclusions
In summary, in persons with diabetic CKD, febuxostat was well tolerated and was effective in reducing serum uric acid levels. However, in this study, no effects of febuxostat therapy were observed regarding subcutaneous adipose tissue oxidative stress and adipokine production, and urinary markers of fibrosis. Larger RCTs are needed to determine the role of uric acid lowering therapy on kidney disease progression.
Supplemental Material
Additional_file_1 – Supplemental material for A Randomized Controlled Trial of the Effects of Febuxostat Therapy on Adipokines and Markers of Kidney Fibrosis in Asymptomatic Hyperuricemic Patients With Diabetic Nephropathy
Supplemental material, Additional_file_1 for A Randomized Controlled Trial of the Effects of Febuxostat Therapy on Adipokines and Markers of Kidney Fibrosis in Asymptomatic Hyperuricemic Patients With Diabetic Nephropathy by Srinivasan Beddhu, Rebecca Filipowicz, Bin Wang, Guo Wei, Xiaorui Chen, Abinash C. Roy, Scott L. DuVall, Hanadi Farrukh, Arsalan N. Habib, Terrence Bjordahl, Debra L. Simmons, Mark Munger, Greg Stoddard, Donald E. Kohan, Tom Greene and Yufeng Huang in Canadian Journal of Kidney Health and Disease
Footnotes
Acknowledgements
The Data Safety and Monitoring Board was chaired by Dr Mark Munger, and Dr Donald Kohan and Mr Gregory Stoddard were members.
List of Abbreviations
ACE-I, angiotensinogen converting enzyme inhibitor; ACR, albumin/creatinine ratio; ARB, angiotensin receptor blocker; BMI, body mass index; CKD, chronic kidney disease; CRP, C-reactive protein; ER, emergency room; eGFR, estimated glomerular filtration rate; HMW, high molecular weight; IL-6, interleukin–6; MDA, malondialdehyde; MDRD, Modification of Diet in Renal Disease; PAI-1, plasminogen activator inhibitor; RCTs, randomized controlled trials; TBARS, thiobarbituric acid reducing substances; TGF-β, transforming growth factor–β; TNF-α, tumor necrosis factor–α; XOR, xanthine oxido reductase.
Ethics Approval and Consent to Participate
Research was approved by the University of Utah Institutional Review Board (IRB_00044016). All participants consented to participate using an informed consent.
Consent for Publication
Not applicable.
Availability of Data and Materials
This data will not be shared at this time; we are still working on secondary analyses using this dataset.
Authors’ Note
The views expressed are those of the authors and not necessarily those of the Department of Veterans Affairs. The results presented in this article have not been previously published except in abstract form.
Author Contributions
SB, TG and YH helped design the study. All authors were involved in the acquisition of data. SB, GW, XC, MM, GS, DK, TG, and YH helped analyze and interpret the data. All authors were involved in drafting and revising the manuscript. All authors read and approved the final manuscript.
Declaration of Conflicting Interests
The author(s) declared the following potential conflicts of interest with respect to the research, authorship, and/or publication of this article: This study was supported by an investigator-initiated research (IIR) grant from Takeda Pharmaceuticals of North America.
Funding
The author(s) disclosed receipt of the following financial support for the research, authorship, and/or publication of this article: This project was supported by an unrestricted grant from Takeda North America. Dr. Beddhu was supported by R01-DK091437 and RO1-DK078112. University of Utah Study Design and Biostatistics Center is funded in part from the Public Health Services research grant numbers UL1-RR025764, 1UL-1RR024975, and C06-RR11234 from the National Center for Research Resources. The funding bodies had no role in the design, analysis, interpretation, or writing of the manuscript. This project was supported using resources and facilities at the VA Salt Lake City Health Care System and the VA Informatics and Computing Infrastructure (VINCI), VA HSR RES 13-457.
References
Supplementary Material
Please find the following supplemental material available below.
For Open Access articles published under a Creative Commons License, all supplemental material carries the same license as the article it is associated with.
For non-Open Access articles published, all supplemental material carries a non-exclusive license, and permission requests for re-use of supplemental material or any part of supplemental material shall be sent directly to the copyright owner as specified in the copyright notice associated with the article.