
Abstract
Summary
Objective
To assess the relationship between GP experience, phone and website access measures, and NHS App use.
Design
An ecological study using practice-level NHS App usage data between March 2020 and June 2022. GP practice codes were used to link patient-reported experience and ease of access scores from the General Practice Patient Survey to the NHS App data. Practices were grouped into five quintiles based on experience and access measures, and negative binomial regressions were used to estimate Incident Rate Ratios (IRR) comparing NHS App usage across quintiles. Models were adjusted for age, sex, deprivation, ethnicity and long-term healthcare needs.
Setting
General practices across the NHS in England.
Participants
Patients registered at 6386 GP practices in England.
Main Outcomes
Weekly rates of NHS App functions used (registrations, logins, prescriptions ordered, medical record views and appointments booked) per 1000 GP-registered population.
Results
Fully adjusted models found lower NHS App use in practices with the highest patient experience. Registration rates were 3.5% lower in practices with the highest vs. lowest experience scores (IRR 0.96, p < 0.001) and logins were 5.2% lower (IRR 0.95, p < 0.001). Practices with better phone access had 27.0% higher prescription orders (IRR highest vs. lowest = 1.27, p < 0.001), and 57.8% higher appointment bookings (IRR highest vs. lowest = 1.58, p < 0.001). Prescriptions were 7.7% higher in practices with the highest vs. lowest web access scores (IRR 1.08, p < 0.001).
Conclusion
NHS App use was lower in practices with the highest patient experience, but generally higher in practices with better phone and web access. Results highlight the need for coordinated action to improve access and patient satisfaction.
General practice (GP) is a cornerstone of the UK primary health care system, accounting for the largest volume of activity within the NHS and delivering approximately 27 million appointments in August 2024 alone.1–2 However, a persistent workforce crisis and COVID-19 related challenges have negatively impacted GP accessibility, with delays in timely access to care and a decline in public satisfaction.3–5 In response, the NHS in England has adopted a multi-channel approach, offering a range of healthcare access options including in-person visits, phone consultations, and using web/online solutions. 6 The NHS App is one such service which offers online access to a range of primary care services.7,8 It was recently expanded to include secondary care, supported by initiatives such as the NHS elective care reform plans. 9
The NHS App could improve service access, yet its uptake has been uneven, with lower registration rates in more deprived areas and certain patient groups. 10 These disparities suggest that not all patients have the opportunity for gaining equal access to, or familiarity with digital tools, which may hinder their ability to benefit from online services. However, among those who are able and willing to use technology, digital tools may serve as useful alternatives to traditional healthcare approaches and improve some access barriers.11–13
Patient experience of care and familiarity with existing GP services may be important considerations that affect how patients engage with technologies such as the NHS App, and evidence suggests digital health experiences are closely linked to interpersonal aspects of care. 14 For example, a positive patient experience with online services has been shown to improve patient-provider communication and reinforce patient confidence in using digital tools for tasks such as health information seeking.12,15 In turn, positive interactions with technology increase patient exposure to digital pathways and promote willingness to engage with newer services. 16 Likewise, the quality of provider-patient relationship can also influence technology uptake as individuals are more likely to adopt new services endorsed by their healthcare provider, particularly when trust and positive care experiences are well-established.15,17 As research on the NHS App is emerging, these factors that relate to technology use can help understand aspects related to adoption and utilisation in a national portal context. Therefore, this study aims to explore the relationship between patient experience of GP care and access on the use of NHS App features.
Methods
Study design
An ecological study with GP practice-level data in England was conducted to explore variations in NHS App feature use by patient experience of GP service access and care.
Data sources and linkage
NHS App usage data was obtained from the NHS App dashboard as anonymised logs for a 27-month period between March 2020 and June 2022. 18 Socio-demographic data, including age, sex, ethnicity, long-term healthcare needs and practice-level deprivation, were collected from publicly available data sources (detailed in Appendix A).
Data on patient experience of care and access were extracted from the GP Patient Survey (GPPS) database, which is an annual survey of approximately 2.4 million adult GP-registered patients in England. The data used for this study was collected between January and March 2021, a period when England was in COVID-19 lockdown and GP access was largely remote. The survey was completed online or via post by 850,206 patients nationally, representing a response rate of 35.3%.
19
GPPS provides GP practice-level population-weighted responses for a number of questions from a topic list which include: ‘Your local GP services’, ‘Overall experience’, ‘Making an appointment’, ‘Last general practice appointment’, ‘Your health’, ‘When your GP practice is closed’, as well as ‘NHS dentistry’, ‘COVID-19’ and patient demographics.
19
Patient responses to questions on access and experience from the first two topics listed above were used to categorise practices into quintiles, where quintile 1 included the lowest-ranked practices and quintile 5 the highest. The following GPPS indicators were selected:
Overall GP practice experience: ‘Overall, how would you describe your experience of your GP practice?’ [GPPS Question 30] Ease of phone access: ‘Generally, how easy is it to get through to someone at your GP practice on the phone?’ [GPPS Question 1] Ease of web access/use: ‘How easy is it to use your GP practice's website to look for information or access services?’ [GPPS Question 4]
The relevance of the research questions, as well as the identification of GPPS indicators specific to the research aims, and their appropriateness for use were refined through multiple Patient and Public Involvement (PPI) inputs and wider stakeholder engagement throughout the research process.
Statistical analyses
GP practice code was used as a unique identifier to link GPPS response data to the NHS App usage metrics. Practices with missing practice size or area codes were removed, as were practices with fewer than 200 registered patients (n = 146) to exclude atypical and specialist practices. For analysis, complete NHS App data was available for 6386 GP practices, which represents approximately 95% of all GP practices in England at June 2022. Usage data was available for the full period between 23rd of March 2020 to 27th of June 2022. Stata 17.0 software was used for statistical analyses.
The correlation between the GPPS indicators was assessed using pairwise Spearman's rank correlation coefficient (rs). Weekly rates of each NHS App function used (e.g. registrations, logins, prescriptions ordered, medical record views and appointments booked) per 1000 registered GP practice population were the outcome variables. Incident Rate Ratios (IRR) from Negative binomial regression models were used to explore the differences in outcomes for each GPPS variable compared to the reference group (Q1). Regression models also controlled for age, sex, ethnicity, long-term healthcare needs and practice-level deprivation. To account for multiple comparisons across the five NHS App features and eight predictors, we applied a Bonferroni correction with an adjusted p value threshold of p < 0.0013 to assess statistically significant changes. We also conducted sensitivity analyses comparing our regression models across the 27-month period to the GPPS data collection period to test for temporal variations.
Results
Forest plots with IRRs and confidence intervals for each of the NHS App features are presented below. Percentage changes from adjusted models and Bonferroni adjusted p-values are presented in Appendix B. Assessment of correlation among access and experience measures found moderate positive associations among all variables: phone access and web access (rs = 0.52, p < 0.001), patient experience and phone access (rs = 0.64, p < 0.001), and patient experience and web access (rs = 0.60, p < 0.001). The correlation coefficients are presented in Appendix C (Table 1) and the unadjusted summary statistics are available below. Sensitivity analyses showed that the direction of associations in the full model vs. reduced model remained unchanged for most predictor quintiles, with only minor differences in magnitude, suggesting that the underlying associations remained broadly stable over the 27-month period (Appendix C, Table 2).
Unadjusted summary statistics (mean and standard deviation) for NHS App features used across the GPPS variable quintiles.

Registrations
Figure 1 shows NHS App registration (IRR values) by patient-reported GP experience and access scores, where Q1 = lowest and Q5 the highest. The relationship between practice experience and NHS App registrations varied, and registration rates were 3.5% lower in the highest rates quintiles compared to the reference group, Q1 (p < 0.001). Practices with better reported phone access had lower registration rates overall. For example, registration rates were 2.7% lower in Q3 than Q1 (p < 0.001) and 1.1% lower in Q5 than Q1, although this was not statistically significant (p = 0.07). Practices with better web access had higher registrations, with registration rates 2.6% higher in Q4 than Q1 (p < 0.001) and 2.1% higher in Q5 than Q1 (p < 0.001).

Weekly NHS App registrations.
Logins
Figure 2 shows NHS App login (IRR values) by patient-reported GP experience and access scores, where Q1 = lowest and Q5 the highest. Login rates by overall practice experience showed a non-linear relationship. For example, login rates were 2.7% higher in Q3 compared to the reference group, Q1 (p < 0.001) and 5.2% lower in Q5 compared to Q1 (p < 0.001). The relationship between rates of logins and ease of phone access was also non-linear. For example, login rates were 2.3% lower in Q3 compared to Q1 (p < 0.001) and 3.5% higher in Q5 compared to Q1 (p < 0.001). Practices with better web access had higher logins, for example, login rates were 5.4% higher in Q4 than Q1 (p < 0.001) and 5.1% higher in Q5 than Q1 (p < 0.001).
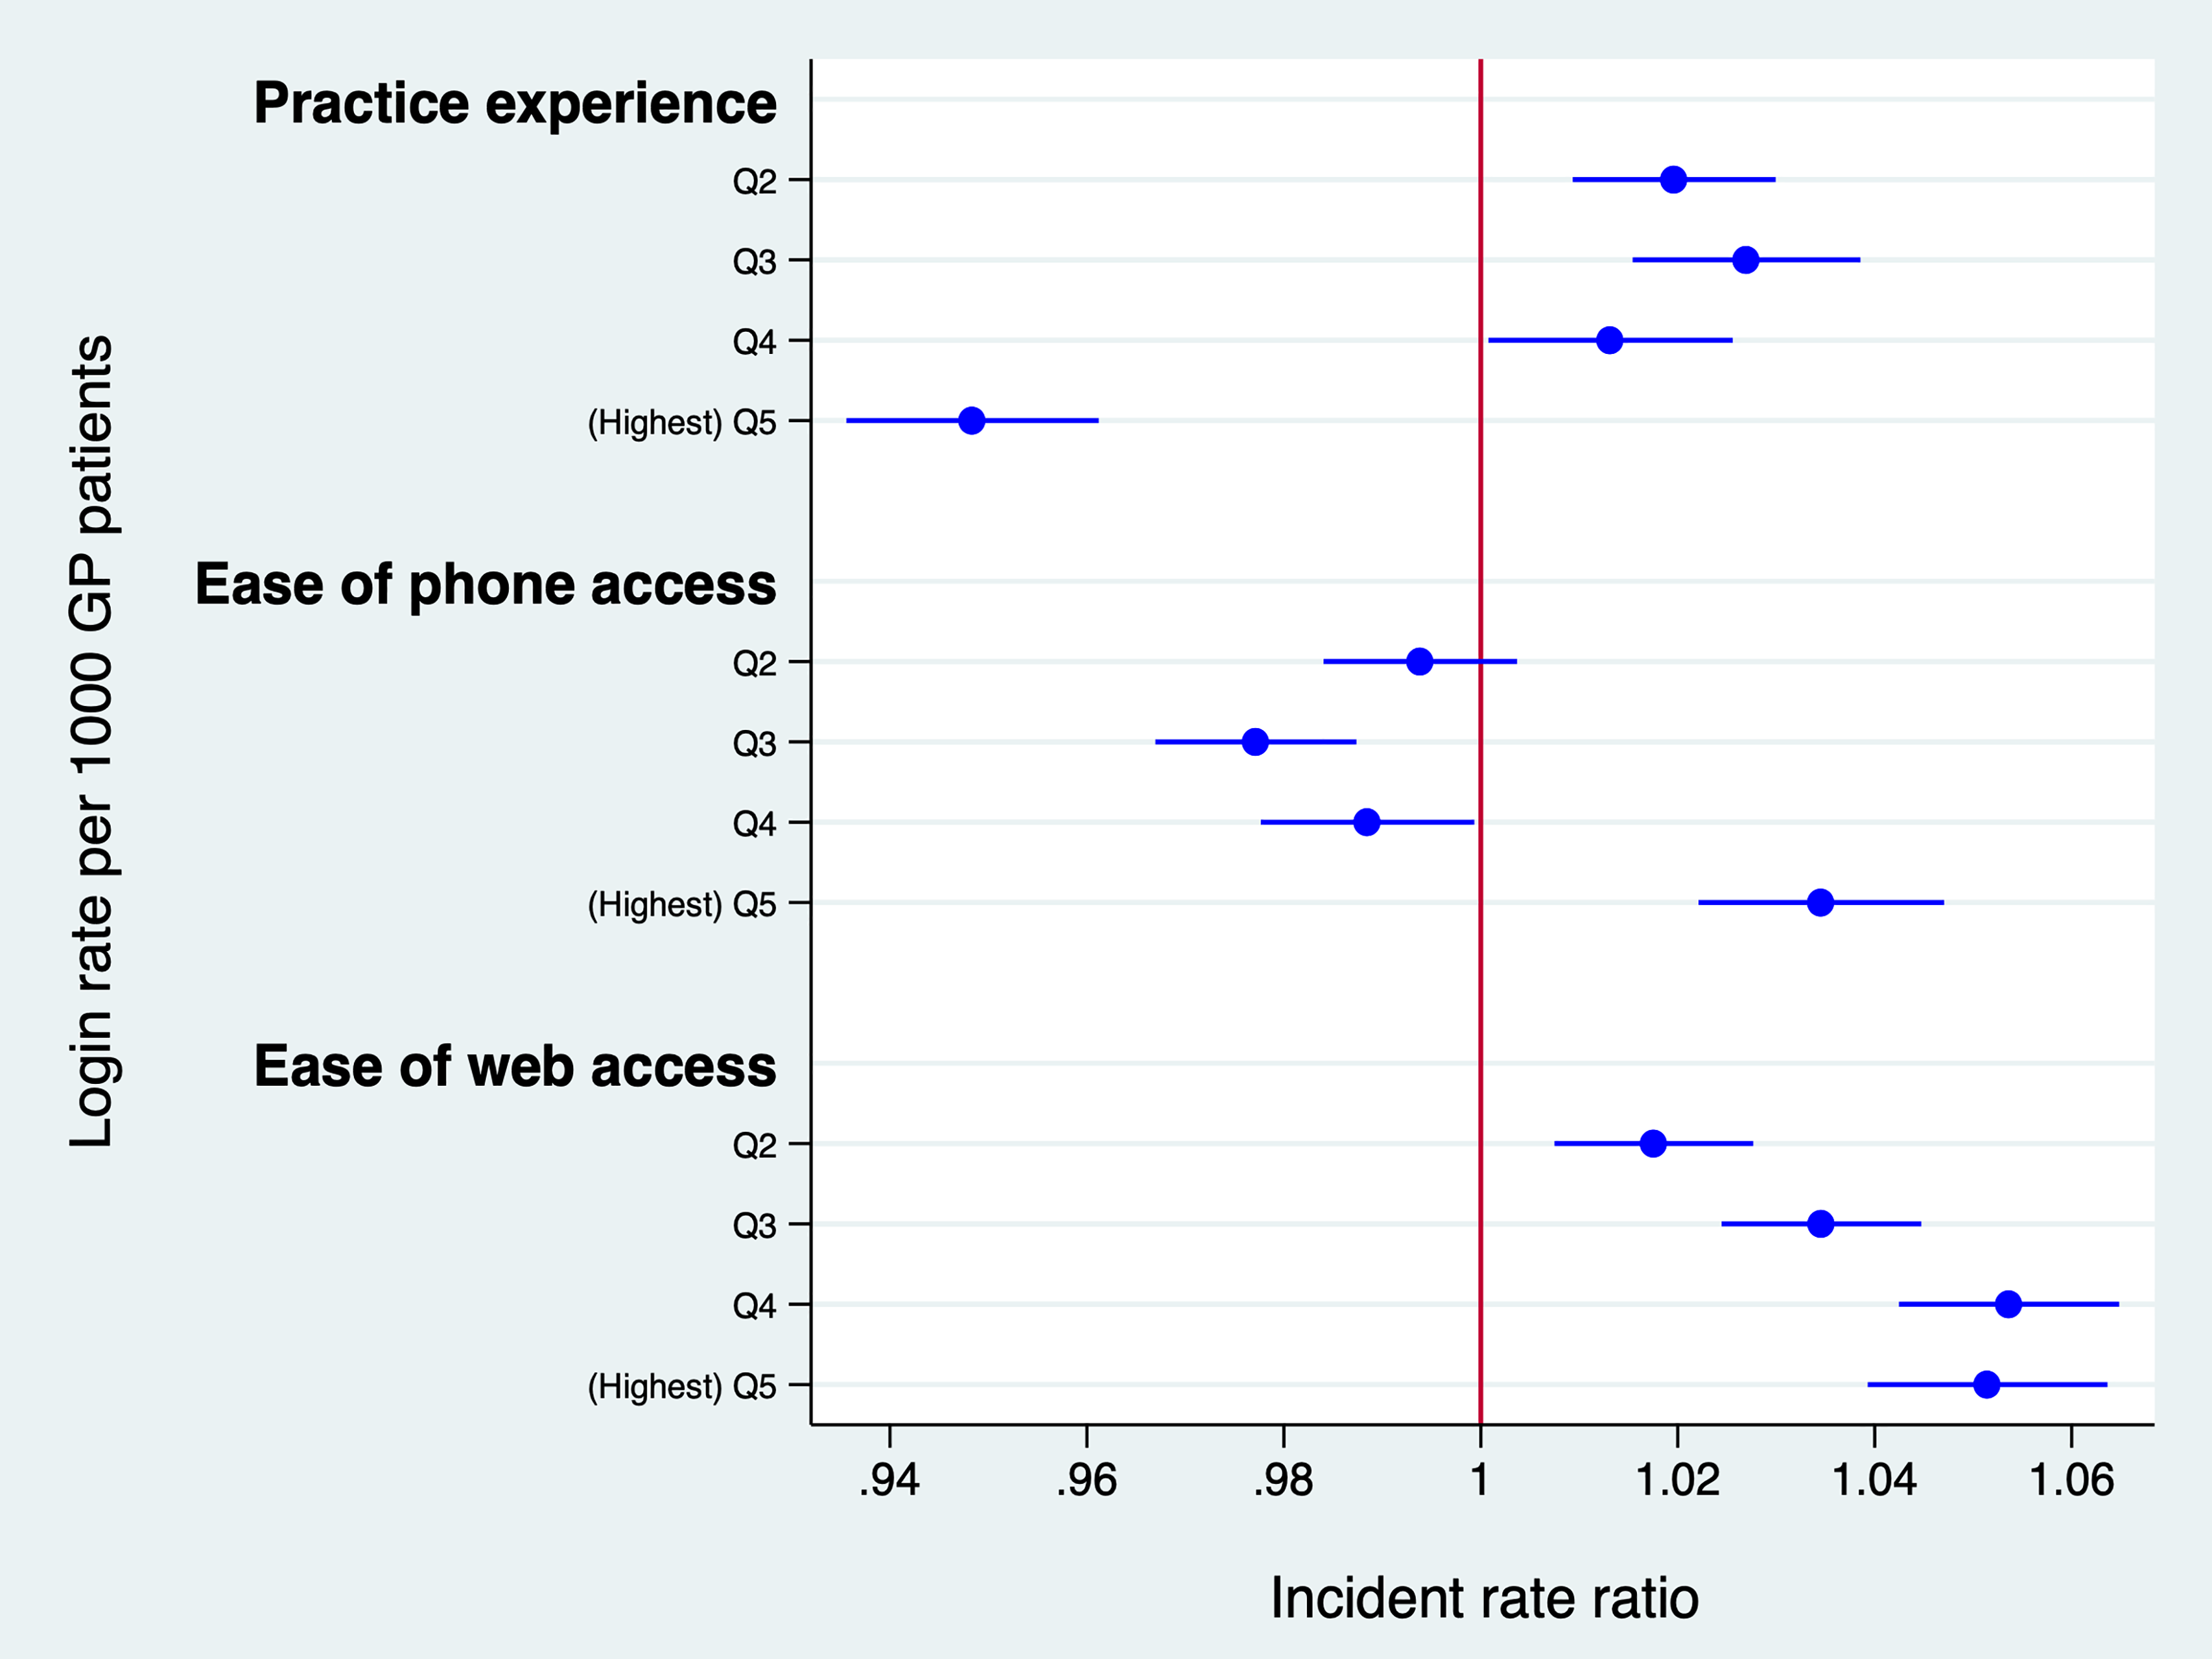
Weekly NHS App logins.
Appointments booked
Figure 3 shows appointments booked (IRR values) by patient-reported GP experience and access scores, where Q1 = lowest and Q5 the highest. Fully adjusted models showed lower rates of appointments booked in practices with better experience scores. For example, appointment booking rates were 29.3% lower in Q4 compared to the reference group, Q1 (p < 0.001) and 27.5% lower in Q5 compared to Q1 (p < 0.001). Practices with better phone access had higher appointment bookings through the NHS App. For example, rates of appointments booked were 25% higher in Q4 than Q1 (p < 0.001) and 57.8% higher in Q5 than Q1 (p < 0.001). Practices with better web access had lower rates of appointments booked with appointment booking rates 17.6% lower in Q4 than Q1 (p < 0.001) and 18.9% lower in Q5 than Q1 (p < 0.001).

Weekly appointments booked through the NHS App.
Prescriptions ordered
Figure 4 shows prescriptions ordered (IRR values) by patient-reported GP experience and access scores, where Q1 = lowest and Q5 the highest. Practices with better overall experience had lower rates of prescriptions ordered through the NHS App. For example, rates of prescription orders were 8.3% lower in Q4 than the reference group, Q1 (p < 0.001) and 16.1% lower in Q5 than Q1 (p < 0.001). The relationship between prescriptions ordered and ease of phone access was non-linear. For example, compared Q1, rate of prescriptions ordered was 27.0% higher in Q5 (p < 0.001), but 0.4% lower in Q2, although this difference was non-significant (p = 0.35). Practices with better web access had higher rates of prescriptions orderes. For example, rates prescription orders were 7.8% higher in Q4 than Q1 (p < 0.001) and 7.7% higher in Q5 than Q1 (p < 0.001).

Weekly prescription orders through the NHS App.
Medical record views
Figure 5 shows medical record views (IRR values) by patient-reported GP experience and access scores, where Q1 = lowest and Q5 the highest. Fully adjusted models showed a non-linear relationship between medical record views and practice experience. For example, rates of medical record views were 3.2% higher in Q4 than the reference group, Q1 (p < 0.001) and 3.3% lower in Q5 than Q1 (p < 0.001). Practices with better phone access had higher rates of medical record views. For example, rates of medical record views were 5.4% higher in Q4 than Q1 (p < 0.001) and 13.8% higher in Q5 than Q1 (p < 0.001). Practices with better web access also had higher rates of medical record views. For example, medical record view rates were 3.4% higher in Q4 than Q1 (p < 0.001).

Weekly medical record views through the NHS App.
Discussion
Principal findings
This analysis of data on patient experience of GP care and access revealed lower levels of NHS App use among practices with the best experience scores. The app functions can be grouped into two main categories: prerequisites (registration and login) and services (appointments booked, prescriptions ordered, and medical records viewed). The differences in patient experience and app use were most apparent for two of the three services (appointment bookings and prescription orders), with lowest use among the higher quintiles. Practices with better phone access showed higher rates of appointment bookings and medical record views among the best-ranked practices, but registrations were lower and the pattern of logins and prescription orders varied. Practices with better web access had higher usage of all app functions except appointment booking.
Strengths and limitations
Although the GPPS is the largest validated survey of patient-reported measures in England, it has a low completion rate (35.3% in 2021). Therefore, the GPPS sample used for this analysis may only detect issues reported by the subset of patients who complete the survey. Furthermore, the GPPS data used relates to January 2021, whereas use of the NHS App features peaked around May 2021, coinciding with the COVID-19 vaccine pass introduction. 10 Using the January 2021 time point allowed measuring patient satisfaction with web and phone routes prior to a more widespread adoption of the NHS App. However, as the GPPS was redeveloped in 2021 to reflect pandemic related changes to service delivery, 19 it was not possible to compare patient satisfaction before and after the app's release using multiple timepoints. Averaging the app data over the 27-month period may also not adequately capture temporal trends, and longitudinal analyses capturing data in relation to NHS App use may provide a more direct measure of association. In addition, we used practice-level data to infer patient satisfaction, although individual level data on this have provided greater granularity.
There are a wide range of potential confounders of any relationship between patient experience and NHS App use, and we recognise that this study was unable to assess all of these. Other possible confounders include secondary/tertiary care services or wider patient and provider factors such as patient income and education levels, and previous healthcare experiences. These remain a potential avenue for future research. The relationship between the GPPS indicators may also influence the study findings as practices with high experience ratings are likely to be more digitally mature, or focused on supporting access through conventional routes that is, by offering enhanced phone support and web access options. Although we noted only moderate positive correlations among these variables, these need to be carefully considered in future studies. Furthermore, our study focused on the NHS App even though there are alternative commercial providers that offer similar services within the NHS framework. While this approach is effective for capturing a national population sample, it restricts the generalisability of results to other digital tools.
Interpretation and comparison with existing literature
Practice experience in relation to NHS App use showed generally low usage among practices in the highest quintile, suggesting that GP practices with the best patient experience had the lowest rates of use of these different functions. However, this did not follow a clear gradient and highlighted a mixed picture making it difficult to ascertain the relation between the two. The exception was prescription ordering which declined linearly with higher quintile ratings, indcating that practices with the lowest rated satisfaction had higher app prescription requests on average. Significantly lower app feature usage overall among the highest rated practices may suggest that where patients remained satisfied with their current GP care infrastructure, the app likely offered minimal perceived added value, leading to lower engagement.20,21 Other issues such as barriers during technology adoption (e.g. registration steps, or verification requirements) can also deter patients and make new systems appear disruptive, particularly when patients remain satisfied with the relative convenience of existing care methods.22–23 However, for certain functions such as prescription requests, the NHS App likely offered an alternative for poor GP patient experience. Although, this may not necessarily reflect greater digital engagement and could be substituting for ‘good practice’ when traditional access or support is perceived as inadequate.
We also found that better phone access to the practice meant people were signing up less to use the app, but where they had signed up, uptake of the different features generally remained high. In particular, improved phone access corresponded with higher app appointment booking, likely reflecting enhanced communication and the use of remote triage in GP services at that time. Studies show that provider encouragement and accessible support is crucial for patient portal use, particularly for tasks such as appointment scheduling and messaging providers,24,25 and telephone access could be useful transitional medium to facilitate this. Our qualitative analysis examining the implementation of the NHS App (published elsewhere) found that its adoption relied on the capacity and support by the GP staff to facilitate access, 22 which further reinforces the link between GP assistance and endorsement using traditional channels and technology utilisation. Although we could not directly measure the relationship between provider support and app engagement, our results indicate a pattern of association that is consistent with existing literature, and it warrants further investigation. It is also important to consider patient satisfaction with the wider GP teams, including receptionist staff, who often mediate access experiences and may consequently shape NHS App use.
Patient motivation is another important factor influencing patient willingness to engage with digital tools.26,27 Familiarity with existing digital infrastructure may reduce motivation to explore new technologies, which may be reflected in our results showing lower appointment booking rates despite high reported web access. The availability of other commercial provides such as Accurx that allow patients to book their GP appointments directly using provider links or via practice website could also influence these findings. 22 Wider systemic challenges such as usability of the booking systems and availability of appointments are other important considerations, 28 especially for tasks such as appointment scheduling which is often more complex than other functions, requiring patients to navigate multiple steps. In some cases, appointment options may be presented more clearly through pre-existing GP systems, 22 making the NHS App seem less intuitive or accessible by comparison. Such challenges can act as external influences, confounding the relationship between access experiences and patient engagement with the NHS App functions. The use of certain services such as prescriptions and record views remained generally high among practices with better web access, suggesting that patients may prefer to engage with the NHS App for certain functions, but find it easier to use their practice websites for others.
Implications for practice and research
These results demonstrate a mixed and complex relationship between app use and experience. It is not as simple as NHS App use being associated with better experience of the practice overall, or vice versa. While our results are ecological and reflect a period during the COVID-19 pandemic, they do suggest that driving use of the app or similar products will not change patient experience by itself. The relationship is more nuanced and requires targeted efforts to support patients to effectively engage with the different access channels. This could include, for example, providing training and funding for GP staff (or wider community initiatives) to promote NHS App use among patients with low digital literacy, as well as addressing barriers to registration such as simplifying verification processes. Offering patients multiple access options as a part of the multi-channel strategy remains key.
Broader policy influences on healthcare access requirements and digital integration, particularly for services such as appointment bookings and medical record views could also shape the findings here. 29 Future research could explore the sequence of policy changes and app feature rollouts to assess their impact on the availability and utilisation of the different features. Equally, analysis of the use of the different features and patient experience over multiple time points alongside provider support may provide a clearer overview.
Conclusions
Our study provides a comprehensive evaluation of the multifaceted dynamics that shape public engagement with digital health solutions such as the NHS App, and demonstrate that relationships between NHS App use and patient experience are multifaceted and non-linear. The findings underscore the complexity of patient interactions with novel digital solutions in relation to their experience of care and care access, highlighting the need for a tailored and nuanced approach to digital health interventions. To maximise patient engagement with digital tools, individualised and flexible strategies are required.
Footnotes
Abbreviations
Declarations
Competing interests
Sukriti KC, Chrysanthi Papoutsi, Claire Reidy, Bernard Gudgin, John Powell, Azeem Majeed, and Anthony A Laverty have no competing interest to declare. Felix Greaves is employed by the Department of Health & Social Care, UK.
Funding
This study was funded by the NIHR Health and Social Care Delivery Research Programme (NIHR128285). The study was also supported by the NIHR Applied Research Collaborations in North West London and Oxford and Thames Valley at Oxford Health NHS Foundation Trust, and the latter fund, John Powell. The views expressed are those of the authors and not necessarily those of the NIHR, NHS or Department of Health and Social Care.
Ethics approval
Ethical approval was provided by Imperial College London Research Ethics Committee (ICREC), reference 21IC7292.
Contributorship
SKC, AAL, JP and FG conceived of the idea for the paper and designed it with all authors. SKC conducted the analyses assisted by AAL. SKC wrote the first draft which all authors contributed to.
Acknowledgements
The authors express gratitude to the NHS App teams at NHS England (NHS E) for enabling access to NHS App usage data.
Availability of data and materials
NHS App data was obtained through NHS E, which is accessible with appropriate permissions.
Consent to participate
Not applicable. This study used anonymised, routinely collected data and did not involve direct patient participation.
Provenance
Not commissioned; peer-reviewed by Frauke von Bieberstein and Julie Morris
Appendix A
Details of the variables used and their sources.
Where GPPS = General Practice Patient Survey, which provides weighted response data for individual question category.
Appendix B
Where, * = Percentage change calculated using incident rate ratios (IRR) obtained from the Negative Binomial Regression model after controlling for baseline differences in age, sex, ethnicity, deprivation and long-term healthcare needs. For all Quintile categories (Q), Q1 represents practices with the lowest population percentage for the given variable and Q5 represents practices with the highest population percentage for the given variable. ** = Significance denoted after Bonferroni correction for 40 comparisons. Adjusted p-values are available in Table 2 below. The colour shading represents a heat-map style output.
Table showing un-adjusted p-values and Bonferroni-corrected p-values. The correction was applied across 40 tests with an adjusted significance threshold of 0.05/40 = 0.0013. Italicised values indicate p values that were non-significant at the conventional 0.05 level and the values in bold indicate results that did not remain significant after Bonferroni correction.
Appendix C
1. Pairwise Spearman correlations among the quintile-coded variables.
2. Comparison of Negative Binomial Regression Models Using Averaged Data across a 27-Month Period (March 2020 and June 2022) and the GPPS data collection period (January to March 2021).
IRR = incidence rate ratio; CI = confidence interval. The sensitivity model (IRR1) was restricted to a prespecified narrower time corresponding to the GPPS data collection period (January to March 2021) and the full model (IRR2) includes estimates from our original model using data over a 27-month study period.