
Abstract
This article offers a detailed examination of the content of predictive policing applications. Crime prediction machines are used by governments to shape the moral behavior of police. They serve not only to predict when and where crime is likely to occur, but also to regulate police work. They calculate equivalence ratios, distributing security across the territory based on multiple cost and social justice criteria. Tracing the origins of predictive policing in the Compstat system, this article studies the shift from machines to explore intuitions (where police officers still have control over the machine) to applications removing the reflexive dimension of proactivity, thus turning prediction into the medium for “dosage” metrics of police work quantities. Finally, the article discusses how, driven by a critical movement denouncing the discriminatory biases of predictive machines, developers seek to develop techniques to audit training dataset and ways to calculate the reasonable amount of stop and frisk over the population.
Introduction
How should we make sense of the promise to “predict where and when crimes are likely to happen”? 1 How do the private companies that sell software as a service (SaaS) to police departments, in the form of predictive maps and analytical dashboards, envision public action on safety? What do the developers of crime prediction machines dream of (Cardon, 2015)? In this article I propose to answer these questions by examining the content of the software used in “predictive policing,” a topic that bounces back systematically in the overall public debate on big data and machine learning (Mayer-Schonberger and Cukier, 2013; O’Neil, 2016).
Crime prediction machines are used by governments to shape the moral behavior of police. That is, they calculate equivalence relations (Desrosières, 2002), distributing safety over the territory according to multiple criteria of cost and social justice. They serve not only to predict where and when crimes may occur, but also, and in fact mainly, to direct, supervise, and regulate police work.
To understand the development of predictive policing, it must be situated within the policing reform movement in the United States aimed at making the police more proactive and vigilant, rather than reactive and emergency-focused. Emerging along this line, Compstat was designed and deployed in New York in the 1990s by the chief of police William Bratton (Bratton and Knobler, 2009). According to this doctrine, which is directly inspired by New Public Management, to make policing proactive, change was needed in the organization of police work. The idea was to ensure the accountability of all levels of the police organization, and in particular the levels closest to safety problems, at the level of the precinct heads, who would be required to systematically account for the results of the work of each officer in their territory. In practice, the method is based on weekly “Compstat meetings”—more explicitly, “crime control strategy meetings”—supported by a computerized data recording system, the Compstat System (short for Computerized Statistics). At these meetings, the strategies implemented at the precinct level are evaluated in light of the associated trends in crime (Silverman, 1999).
The emergence of the category of predictive policing can be interpreted as a process whereby the two overarching principles of Compstat are progressively implemented as algorithms, or automated. The first is the orientation of action based on knowledge in order to better identify problems; the second is the management of police organization through mechanisms of measurement, monitoring, and control of officers’ activity. The objective of the developers of police machines is to link together these two dimensions in the form of metrics for predicting both crime and organizational efficiency. In other words, predictive policing uses the trappings of technological innovation and big data (cloud data storage and a dashboard interface) to dress up what is essentially a management tool.
Here I focus on the management dimension of predictive policing, examining in detail the production of these different algorithmically calculated metrics that allow a quantitative measurement of the production of safety by the police. We will see that predictive policing extends Compstat’s project of rationalizing the administration of policing by implementing metrics aimed at quantitatively measuring out “doses” of police work. These metrics aim not only at increasing the productivity of the police, but also at reinforcing the sense of political legitimacy that it needs in the population. By exploring the diversity of types of metrics, their ways of defining priorities and optimizing police presence in space and time, I will show how predictive machines seek to transform police action (part 2). I will also explore how, in response to a movement criticizing the discriminatory biases of predictive machines, developers conceived techniques for auditing the learning databases and the calculations of reasonable amounts of police stop and frisk in the population (part 3). But before entering into the details of these metrics, we must retrace the origins of these analytical platforms in the Compstat system (part 1). This will help us understand how geographical information systems (GISs) were first conceived as web sites aimed at giving officers easy and quick access to statistical information and allowing them to test the intuitions on strategies that arose at Compstat meetings. Only in a later phase did predictive machines emerge, not to serve officers as part of the Compstat procedure, but to transform Compstat itself into an algorithm.
This article focuses on two predictive platforms, Hunchlab and PredPol, but there are many others. Over the last five years, I have followed the evolution of these systems, accumulating all available documents, interviewing key actors, 2 consulting software, and taking part in both private discussions and public debates with the developers themselves as a sociologist of science and technology. Here I present the results of a comprehensive study of what predictive machines are, or at least what they seek to become.
The origins of predictive policing
Before analytical platforms came to market, crime maps were created in police departments using GISs installed on the personal computers of crime analysts (Chainey and Ratcliffe, 2013). In the 1990s, the spreadsheets, spatial analysis, and statistical software packages that make up GISs presented this emerging profession with the occasion to discover tools that opened up new perspectives for the analysis of crime (Weisburd and Lum, 2005). However, they did not prove to be well suited to the informational needs of police administration: the demand for the management of a growing quantity of data collected with the development of microcomputing and for statistical and cartographical information connected to new managerial practices. In this context, automating the production of analytical information and making it quickly and easily accessible to police officers appears as a solution.
An online cartographic information system for Compstat
The emergence of crime mapping platforms in the late 1990s was not simply the fruit of chance developments in local police forces. In Philadelphia, one actor in particular worked toward the development of the first “web mapping” applications in this domain: Robert Cheetham, the developer of the GIS of the Philadelphia police, the Philadelphia Crime and Mapping Systems (PHiCAMS) and the Crime Spike Detector (the prototype of Hunchlab) between 1997 and 2006, first within the police administration, and then as an entrepreneur in the startup he created in 2000. When Cheetham was recruited by the Philadelphia police to set up a crime analysis and mapping unit, he continued at the same time to work as a software developer within the Cartographic Modeling Lab at the University of Pennsylvania. Cheetham approached GIS simultaneously in both computing and analytical terms.
This approach was a good fit with Compstat, with its need for a computerized system to collect and process spatial and temporal data. Compstat was implemented in Philadelphia following the arrival of a new chief of police in 1998, John Timoney, whose program was inspired by his experiences in New York under William Bratton. In this context, the crime analysis and mapping unit became the central instrument of the reform of the Philadelphia police to support the Compstat process. This “Compstat process” consisted in weekly three-hour meetings where each commanding officer would present the situation in his precinct, the actions undertaken there, and crime trends within his geographical area. The aim of these meetings was to enable discussion on the allocation of resources based on an analysis of problems and the presentation of strategies to resolve them. Crime maps were the core tools in this negotiation.
But with only three analysts, the crime mapping and analysis unit did not have enough staff to meet the statistical needs of an organization of more than 6000 police officers. The arrival of Compstat meant the weekly production of a series of quantitative measures and cartographic representations of crime for each of the 39 districts. The desktop tools used by crime analysts did not meet the double challenge that faced the unit with the arrival of Compstat: first, to collect, store, and rapidly update flows of data, and second, to meet the analytical needs of police officers.
When Cheetham joined the unit, located within the Information Systems Division at the Philadelphia Police Department, officers had access to multiple databases, but most could only be accessed from machines physically located in police headquarters. At the time there was no system linking the data together. In demanding the implementation of data-based strategies, Compstat created a requirement for all officers to have access to information systems, anywhere and anytime, in order to combine data from different sources and project them onto maps. However, with its thousands of officers, the police did not have the means to pay for a license for GIS software on each personal machine within the force. And even if it had managed to find funding for these licenses, the problem would not have been solved. Maintenance costs for software installed across multiple workstations in geographically distributed locations were very high, and it was difficult to maintain up-to-date spatial and criminal incident data on workstations.
The solution chosen to this problem was to develop an online platform for the organization and technical management of the data, which would also allow police officers operating from multiple sites, far from headquarters, to access and manipulate it through GIS software. Beginning in the 1980s, database management systems were sufficiently optimized to enable their execution on low-cost hardware. Cheetham drew on this technical advancement to develop a web-based GIS, PHiCAMS, allowing officers to visualize all incidents to which the police had reacted, to search in multiple databases, to create graphical representations, and to easily produce reports. In the late 1990s, when Cheetham implemented PHiCAMS, the Philadelphia police was considered to be at the cutting edge among police departments in terms of geographical information technologies. The innovative character of PHiCAMS can be understood by situating it in the context of the 1990s, when the web was providing a new “envelope” which implied major changes in police officers’ relationship and access to cartographic information on crime. The assessment of problems within the district was now mediated by the web interface.
Computer-assisted intuition
If Phicam appeared as a computational innovation, it remained a descriptive tool. During Compstat meetings, anticipation of the future was present as a reflexive and strategic dimension constructed through police officers’ discussions around historical maps of criminal activity. PHiCAMS thus kept police officers in a reactive stance: crime maps reflect past activity. But police officers must develop their strategies on the basis of predictive information. The challenge thus becomes to automate reflexivity and proactivity within the map.
It is possible to train police officers in the subtleties of using GIS, database manipulation, and the use of statistical software packages in order to allow them to make connections between variables and estimate the future behavior of criminal phenomena, but this type of training would be highly time-consuming, costly, and would not necessarily fit with the role of the police officer. How, then, could a prescriptive GIS be created? How could pattern detection be put to work upstream, in order to offer autonomy to police officers, downstream? What type of prescription do police officers need? What intelligence can a machine automatically provide that is useful to police officers and at the same time meets the demands of Compstat? To answer this question, Cheetham understand that police officers need to be able to interact with analytical applications that would be limited to predefined uses and that would be updated daily.
It was in this context that Cheetham conceived a machine for detecting and signaling trends in criminality: the Crime Spike Detector, a machine based on the model of the early warning system. In 2000, at the national conference on crime mapping in San Diego, the first prototype was presented as a program enabling data on recorded incidents and service calls to be used to detect areas of statistically unusual activity, or “crime spikes.” The version of the Spike Detector that followed the prototype was developed beginning in 2004 and then released in 2006 in the form of a web application. The innovative aspect of the Spike Detector lay less in the algorithm that calculated the warnings than in the web technologies on which it was based. The major transformations in police work that it would bring came from the manipulation of its dynamic pages, visualization through maps, and signaling of alerts. The principle of the Spike Detector was as follows: police officers could access the web site at any time to perform analyses, but in most cases they would do so because they had received a notification from the Spike Detector by email. They also had access to the specific incidents that contributed to a particular peak via PHiCAMS, which provided details on the individual crimes. By clicking the “Graphs” link, the user would access a histogram that would make the spike statistically intelligible. In addition to this ability to visualize the spikes on a graph, the user could click on the “Map” link to display a map of the city presenting other spikes in the form of a square.
The version of Hunchlab that followed the Spike Detector maintained the model of the early warning system, but became more flexible. The Hunchlab developers sought a way to represent the intuitions of police officers that would allow a computer to understand and visualize them. In 2008, the first version of Hunchlab put on the market worked on the principle of a search based on five predefined criteria (incident categories, a geographical area determined by the user on a map, the definition of a historical period of comparison, the definition of the period corresponding to the intuition (the hunch), and the direction of the spike—up or down). While this first version remained quite simple, the research projects from this period that I consulted sketch out the premises for a machine that would be able to test more precise intuitions (time of day, day of the week, modus operandi associated to the class of incident, etc.).
From intuition to prediction
The Hunchlab machine whose development I have just described was aimed at police officers, but also at crime analysts. It automated the production of the information on which discussion would be based. Contrary to the predictive machines of the 2010s, it did not yet recommend patrolling trajectories.
To understand the movement from the first version of Hunchlab to the emergence of predictive machines, note that in the late 1990s in the United States, machine learning techniques to predict the occurrence of crime in space and time were being tested in laboratories (Groff and Vigne, 2002). This academical research took place at the same time as the creation of the Crime Spike Detector, but the developers of the Philadelphia platform deliberately avoided the notion of prediction. The main aim was to develop a machine in the form of a web site, in order to allow officers to test their intuitions and navigate in the detected spikes.
Between 2000 and 2006, the Spike Detector remained an experimental platform within the computing environment of the Philadelphia police. The first version of Hunchlab, released in the late 2000s, was designed for sale as a commercial product. In market research performed in 2008, around 50 police departments were identified as potential clients for the first version of Hunchlab, notably on the basis of their computing resources. To use Hunchlab, the police had to possess the computing equipment needed for the application to work, that is they had to be equipped with servers for its storage and execution, but also with the entire development environment that was associated to it. However, only two cities took up the experiment. The cruel upshot was that the first version of Hunchlab was a commercial failure, despite 10 years of intensive research and development. In contrast, when PredPol burst onto the scene in 2012, it found immediate commercial success.
Faced with the commercial success of PredPol, Hunchlab progressively relinquished its innovative concept of “computer-assisted intuition.” According to Cheetham, PredPol succeeded based on something Hunchlab lacked: in his terms the productization of the platform. PredPol’s innovation lay in its simplicity. The platform provided simplified interactive maps (a red square on a map) using a hotspot calculation algorithm projected on a dashboard, which could be displayed on a computer, tablet, or smartphone. In 2013, the company that brought Hunchlab to market undertook a complete overhaul of the platform. A second version was developed from scratch, becoming SaaS and entirely revamping the tool’s uses to align it with the model of the PredPol machine. The second version of Hunchlab was thus entirely different from the first. Like PredPol, it would project future crimes on a map. The projections would require no interpretation on the part of the police officers. The machine was now aimed at directly orienting police patrols. From an application constructed within the computing system of the police, aimed at helping police officers to explore hypotheses and intuitions, it became a much more external application producing automatic predictions and, thereby, eliminating the reflexive dimension of proactivity.
Productivist policing
Before the commercialization of PredPol, the Hunchlab platform was a component of a broader doctrine in policing. The developers of Hunchlab sought to instill the machine with a certain flexibility. Police officers would test their intuitions at the commands of the machine. In introducing the vocabulary of prediction, PredPol changed the nature of the interaction between the police officer and the machine, that is the human–machine hierarchy is reversed: the machine is situated at the center of police action and not at its periphery.
Predictive policing was progressively placed at the same level as Compstat (Police Executive Research Forum, 2013). But when predictive policing ceases to be merely a software solution, and becomes a more general approach to policing, prediction no longer serves to predict crime—in the multiple senses that scientists give to this expression (Hofman et al., 2017). Contrary to what common sense might suggest, prediction in itself is not the objective of these machines. Prediction quickly became a standard element, which was fairly simple to implement: I do think that the idea of creating crime predictions – is beginning to be somewhat commoditized. By this I mean the idea of just the predictions themselves. Building a system that just makes predictions is not all that difficult and so it is ripe for commoditization. (Interview with Jeremy Heffner, developer and product manager of Hunchlab, August 2016)
Stop and frisk quotas dosed out in real time
The initial objective of Compstat was to manage proactive policing. But how can proactivity be made into a quantity? How can an equivalence be established between this quantity and safety? Since the reforms of public administrations in the 1990s, police district commanders have been charged with the management of an amount of proactivity, to be quantified in terms of decreases in expected criminality. But how can the manager of a police district ensure the proactivity of each officer in the field, and thereby of the productivity of their work? How can district commanders ensure that tasks of producing safety have been successfully performed? In the field, far from the eyes of supervisors, police officers have a great deal of freedom.
One way to constrain them is to subject them to quotas of proactivity (Bronstein, 2014; Eterno and Silverman, 2012; Spitzer, 1999). In New York, a “stop and frisk” system was implemented, requiring a minimum quantity of identity stop and frisk and, potentially, body searches per officer. This was highlighted by Wesley Skogan (2017), a well-known observer of police practices in the United States, who views these quotas as an organizational strategy: Stop and frisk as an agency strategy takes on many additional features. In this instance, stops are not just reactions to events; officers set out on patrol intending to conduct them. That is their mission, or part of it. It is their mission because their managers expect them to conduct stops and “lay hands on people” (a Chicago phrase for conducting a search). Officers are encouraged to “make their numbers” in order to keep their bosses happy. Their stops are entered into the agency’s data system, so they are indeed numbers. Their managers monitor the numbers. They may impose a formal quota, setting a target number of stops for each shift, or they may just call for “more numbers” during roll call meetings. Managers insist on numbers because they, in turn, are being held to account by executives at police headquarters. In organizations that adopt stop and frisk as a strategy, the numbers generated by various units will be utilized at CompStat management sessions to berate or belittle unit commanders who do not “make their numbers.” In turn, top executives will describe what they are doing as “vital to crime prevention” when they address their political leaders, the media and the public. They will interpret their numbers as evidence that they are doing a great deal to combat crime, and warn that any move to question their numbers will put the public at great risk.
But quotas have been heavily criticized by networks of civil rights activists and by police officers themselves (Ismaili, 2015). The use of stop and frisk in high doses was judged unconstitutional in 2013 by a federal judge in the case of Floyd v. City of New York (Bellin, 2014; White and Fradella, 2016). This was followed by a huge decrease in stop and frisk (97% between 2011 and 2016). This deprived the police not only of the sole strategy on which its proactivity was based, but also of its principal management tool.
The PredPol company innovated by offering a platform that integrated the same function as quotas: allowing managers to ensure that officers, during the time of their patrols, carry out the work expected according to production objectives established by their superiors. To do so, they conceived the platform not as a GIS, but as a “dashboard” to be used to monitor this production in real time, through the quantity of work performed by police officers in the field. To put the police officers under real-time pressure, a stream computing platform was needed that could process data flows “on the fly” in order to record the trajectories of patrols. To do this, PredPol integrated the data from the GPS monitoring systems placed in police cars, so that officers could be tracked and the time that the patrols spent in different areas of the city could be monitored. To organize the distribution of patrols in space and time, the PredPol developers proposed a smart use of the results of their research: they discovered that the police patrols attained a sufficient level of efficiency by spending only 5% of their time in the areas identified by the algorithm. These results were precious, because they made it possible to precisely control the dosage of patrols, while making the most economical possible use of the proactive portion of police activity. One of PredPol’s early users was Sean Malinowski, who at the time was police captain in the Foothill Area in Los Angeles as well as project head of the predictive policing program funded by the Bureau of Justice Assistance. He explained to me how this quantified dosage helped to improve the management of proactivity: I think this is what’s difficult for leaders in our job to understand, once you start saying, well you shall spend time in this box, and if you don’t something’s going to happen to you, then they start self-over-reporting, I think. So what we started doing then is have them hit the button in the computer in the car to start their time in a box, and we were tracking them that way, cause we didn’t have Automatic Vehicle Locators (AVL), so right now AVL in all of the patrol vehicles, and we are dealing with bringing all of that data in and have been testing setting up electronic fences with PredPol missions, and we’re going to have real dosage. We did an experiment in Foothill where […] we were able to track how much time they were spending. […] What we think was happening is […] the GPS was picking up the times when they weren’t even aware they were in a box, so if they stopped on their way to a radio call, and they stopped at a traffic light that happens to be in a predictive box, that is still a deterrent. It might have been, because if a suspect sees them there, he doesn’t know what they’re doing there, so we were tracking all of that [...]. George took it to Topanga and had like 200 hours or something a week, and we looked at, what’s optimal, and we were able to break it down to somewhere between 70 and 100, I mean, the more dosage the better, but it’s diminishing returns over time, in terms of the effect on crime. So you’re going to have this dosage meter. (Sean Malinowski, The International Association of Chiefs of Police conference, 2015, allocution)
Hunchlab oriented the development of its instrument according to the same aim of the dosage of patrols through the integration of GPS data, but its approach was significantly different. The time of the dosage was defined not as a percentage of daily working time, but on the basis of key performance indicators (KPIs): quantitative measures of returns chosen to account for police activity in relationship to predefined objectives. The difficulties with this method lay mainly in the choice of indicators, in particular their feasibility and usefulness. In collaboration with actors in the field, Hunchlab chose three KPI indicators of patrol activity: Minutes on Mission (the time spent visiting mission), Good Mission Sessions (the number of visits to a mission that likely represent a meaningful dose), Cleared Missions (at least three good mission sessions during a shift).
The machine thus uses a dashboard which displays several KPIs to push the police officers to vary the style of patrols on their missions (the equivalent of PredPol’s “boxes”). Aside from the definition of these activity indicators, Hunchlab plans to develop dosing information at a more granular level. The challenge today is for machines to use GPS data to compare the behaviors of patrols and detect efficient patrolling patterns. Compstat would thus become a platform that collects data in order to support continual progression in the logic underlying the dosage of patrols.
Clearly, then, whether in the case of PredPol or Hunchlab, predictive information is not only a projection into the future, but it is also a tool for establishing a quantitative equivalence between the value of work and the production of security. From saturation through quotas, which worked as performance metrics, police systems moved to the optimization of patrols through the dosimeter. This shift from quotas to dosimeters can be understood as a form of integration of previous criticisms of Compstat. Compstat took on the form of an application offering a concrete and softer managerial solution: a dosimeter for activity, used to control the production of safety, quantified as patrolling time or particular ways of patrolling. Predictive machines enable the quantity of work carried out by police officers in the field to be controlled and supervised without the use of quotas. With such systems, there is no need to wait for weekly meetings to motivate officers to work. In real time, commanding officers at different levels can control the public supply of safety from behind their screens. The task of predictive policing is to manage the daily time of police presence, according to new managerial productivity criteria.
The value of the patrol
Dosage is not only temporal, but it is also situational: what are the situations to which police officers should give priority when patrolling? To answer this question, the companies developing predictive analysis platforms complement risk scores with weighting metrics enabling situations requiring police intervention to be ranked in order of priority. A comparative analysis of these metrics in the PredPol and Hunchlab platforms shows that risk can be weighted according to two different logics, which have evolved over time with changes in how the platforms conceive the relations between prediction, policing, and the population.
PredPol offers a method that highlights the economic aspect of police action. To do this, the platform assesses the value of the patrol using a classical formula for calculating return on investment

As indicated in a report on the study performed by a PredPol doctoral student, this ratio, which is theoretically simple to specify, implies an evaluation of police work in accounting terms through the establishment of an equivalence between avoided costs (gains) and police action (Samuels, 2014). To evaluate this measurable return on investment, PredPol drew on the Rand Corporation’s monetary estimation of the “cost of crime.” This provides a single summary value allowing the police to measure its predictive action in investment terms, expressing the prediction as a monetary value. This accounting evaluation classifies situations by degree of priority using a “safety production function” couched in terms of monetary costs and benefits. PredPol thus automated the economic analysis of police action, in a rudimentary but operational and effective manner. In other words, prediction became the vehicle for a commoditization of police action.
Hunchlab, on the other hand, has been working to develop a platform that integrates political choices concerning public action. In keeping with the aims of the Task Force on 21st-Century Policing created by President Barack Obama in 2015, notably that of adopting “model policies and best practices for technology-based community engagement that increases community trust and access” (Final Report of the President’s Task Force on 21st Century Policing, 2015), the Hunchlab platform proposes to rank the priority of situations for patrols in a more open manner than PredPol. Four different ways of weighting crimes are proposed: 1/Police department decided weights. We don’t really recommend this because we think it makes more sense for the police department to rely on some 3rd party assessment of severity, but it is a possible option. 2/Cost of crime numbers. The benefit here is that many types of costs to society can be incorporated into one number. It also makes it easier to talk about different types of community investment because the crime forecasts are also expressed in dollars. The downside is that the published cost of crime numbers are not granular and are only available for major types of incidents. 3/Sentencing guidelines A benefit here is that sentencing guidelines are available for every distinct classification of incident, so it is very granular. If we set the weights to the sentencing guidelines, then the system is optimizing to prevent incidents such that the total length of sentences is reduced – essentially trying to reduce the ‘need’ for incarceration by preventing events with longer sentences. A criticism that some will bring up would be that sentencing guidelines don’t always reflect actual harm to the community. For instance, drug incidents have longer sentences than are likely warranted. 4/ Public process. What we are pushing towards is such a public or semi-public engagement process to set weights. (Interview with Jeremy Heffner, Hunchlab Data Scientist, July 2016)
While the PredPol platform frames police administration as a business whose aim is profitability, Hunchlab presents the administration of the digital system as a fully fledged administrative system, containing the contradictions and tensions inherent in the public administrations of Western democracies (Rosanvallon, 2015). The opposition between the two approaches is a classical one: on the one hand, PredPol embodies a form of reasoning that fits within the long-standing process of the naturalization of the economic analysis of public action; on the other hand, Hunchlab offers a politicization by offering the user a choice among multiple weightings. Hunchlab even goes as far as to open the weightings to discussion with the population.
But both platforms set out to integrate evaluation metrics that were previously used in ex ante or ex post form at Compstat meetings, in itenere, at the level of police officers’ daily activity. The need to formalize these metrics within the platforms imposes the requirement of making the values involved in the choice of one or another police tactic more explicit. Should the police be viewed as an organization that must be economically profitable, or as a service focused on responding to the demands and concerns of the population? The developers of PredPol answered this question themselves by coding the calculation of ROI into their machine; Hunchlab allows police actors to answer it themselves in the system administration interface. In any case, predictive policing requires the values attributed to the patrol to be made explicit. The presence of police in public space is now systematically associated to a continuous operation of evaluation (Dussauge et al., 2015) which can be parametrized and automated.
Discrimination and “policing harm”
Today, these predictive machines and their metrics, like Compstat before them, are facing criticism in their turn. While they seem to offer alternatives to the logic of quotas and racial profiling by patrolling officers, these machines have increasingly been the focus of critiques of “algorithmic bias,” which hold that predictions reinforce police discrimination against minorities (Ferguson, 2016; Robinson and Koepke, 2016; Selbst, 2018; Shapiro, 2017).
In a context marked by activist mobilization in the United States, both PredPol and Hunchlab have had no choice but to respond decreased to these critiques, integrating the problem of algorithmic biases into the process of machine design. The developers of PredPol have engaged in research auditing the impact of learning data, while those of Hunchlab have sought to regulate and optimize “policing harms”—negative effects caused by police proactivity.4 The reactions of PredPol and Hunchlab offer insights into the ways in which the promoters of such platforms can devise means to control biases and to develop metrics for regulating police action.
Managing biases
Since its creation, there have been many criticisms of PredPol, but the developers have responded publicly only to those alleging discriminatory biases. The charges of the nonprofit association Human Rights Data Analysis Group particularly interested PredPol. In their study “To Predict and Serve” (Lum and Isaac, 2016), the group published an analysis of the effects of the PredPol algorithm based on a digital stimulation. The demonstration is simple. They projected the spatial distribution of drug arrests, constructed from data recorded by the police, on a map of the city of Oakland. It is immediately clear that arrests are concentrated in neighborhoods with predominantly nonwhite and low-income populations. If these arrest data are fed into the machine learning process, it is not surprising that the PredPol algorithms contain this discriminatory bias. The simulation, carried out using PredPol’s predictive model, shows that blacks are indeed twice as likely to be targeted by predictive policing as whites, and that the likelihood of arrest of persons classified in any category other than white is 1.5 times greater than that of whites. But the crucial question is whether there is a feedback loop, that is whether the results of predictions then become further learning data which reinforce and increase the unequal distribution of arrests in the population. Illustrating the typical case of demands for productivity as in Compstat, the simulation showed a reinforcement of inequalities in arrests over time as the algorithm learned from arrest data produced on the basis of actions recommended by the algorithm itself.
PredPol developers defended themselves with a twofold response to these critiques. The first response was a demonstration that the situation is less alarming than the critique suggested. In their article entitled “Does Predictive Policing Lead to Biased Arrests? Results From a Randomized Controlled Trial” (Brantingham et al., 2018), the PredPol developers analyzed data from a randomized controlled trial carried out in 2011 in Los Angeles to test the efficiency of their machine (Mohler et al., 2015). Comparing the distribution of arrests by patrols according to ethnic variables (as reported by the police officers themselves) for areas where no algorithmic recommendations were made (control group) with those where PredPol was used (treatment group), the study demonstrated that the activity produced by predictive policing is neither more nor less discriminatory than the existing practices of patrols.
A second response was formulated in an article published in a special issue of the Ohio State Journal of Criminal Law on predictive policing (Brantingham, 2017). This study was based on a simulation, but involved a more sophisticated construction of the problem of algorithmic bias than that of PredPol’s detractors. The civil rights organization’s criticisms of PredPol deviated from the reality of practice: the PredPol algorithm learns not from arrest data, but mainly from crimes reported to the police by the public. As Brantingham points out in his article, while all the debate has focused on biases against minorities in arrests, the input data is reported criminal incidents, rather than criminal acts directly captured by police officers. According to Brantingham (2017): some pathways bring police into contact with victims, while others bring police into contact with suspects. In the former case, implicit bias will seek to minimize victimization through the downgrading of crimes. In the latter, implicit bias will seek to maximize liability through upgrading of crimes. Graphs from Brantingham (2017: 482) showing the effect of biases (on upgrading, at top, and on downgrading, at bottom) on the learning process for the three parameters in the model (from left to right, concentration, contagion, and the temporal window of contagion). Each graph represents the mean and the one standard deviation range of the parameters estimated based on the model, for five independent simulations, systematically applied to six variant levels of bias (from 0 to 20%). The dotted red line shows the value of the initial parameters of the model, that is the model that was used to generate the data and that served as a reference for the experiment. The light gray band shows the range of natural variation in the parameter (0% of data biased). The minimum quantity of biased data needed to distinguish natural variation in the parameters observed in unbiased situations can thus easily be seen.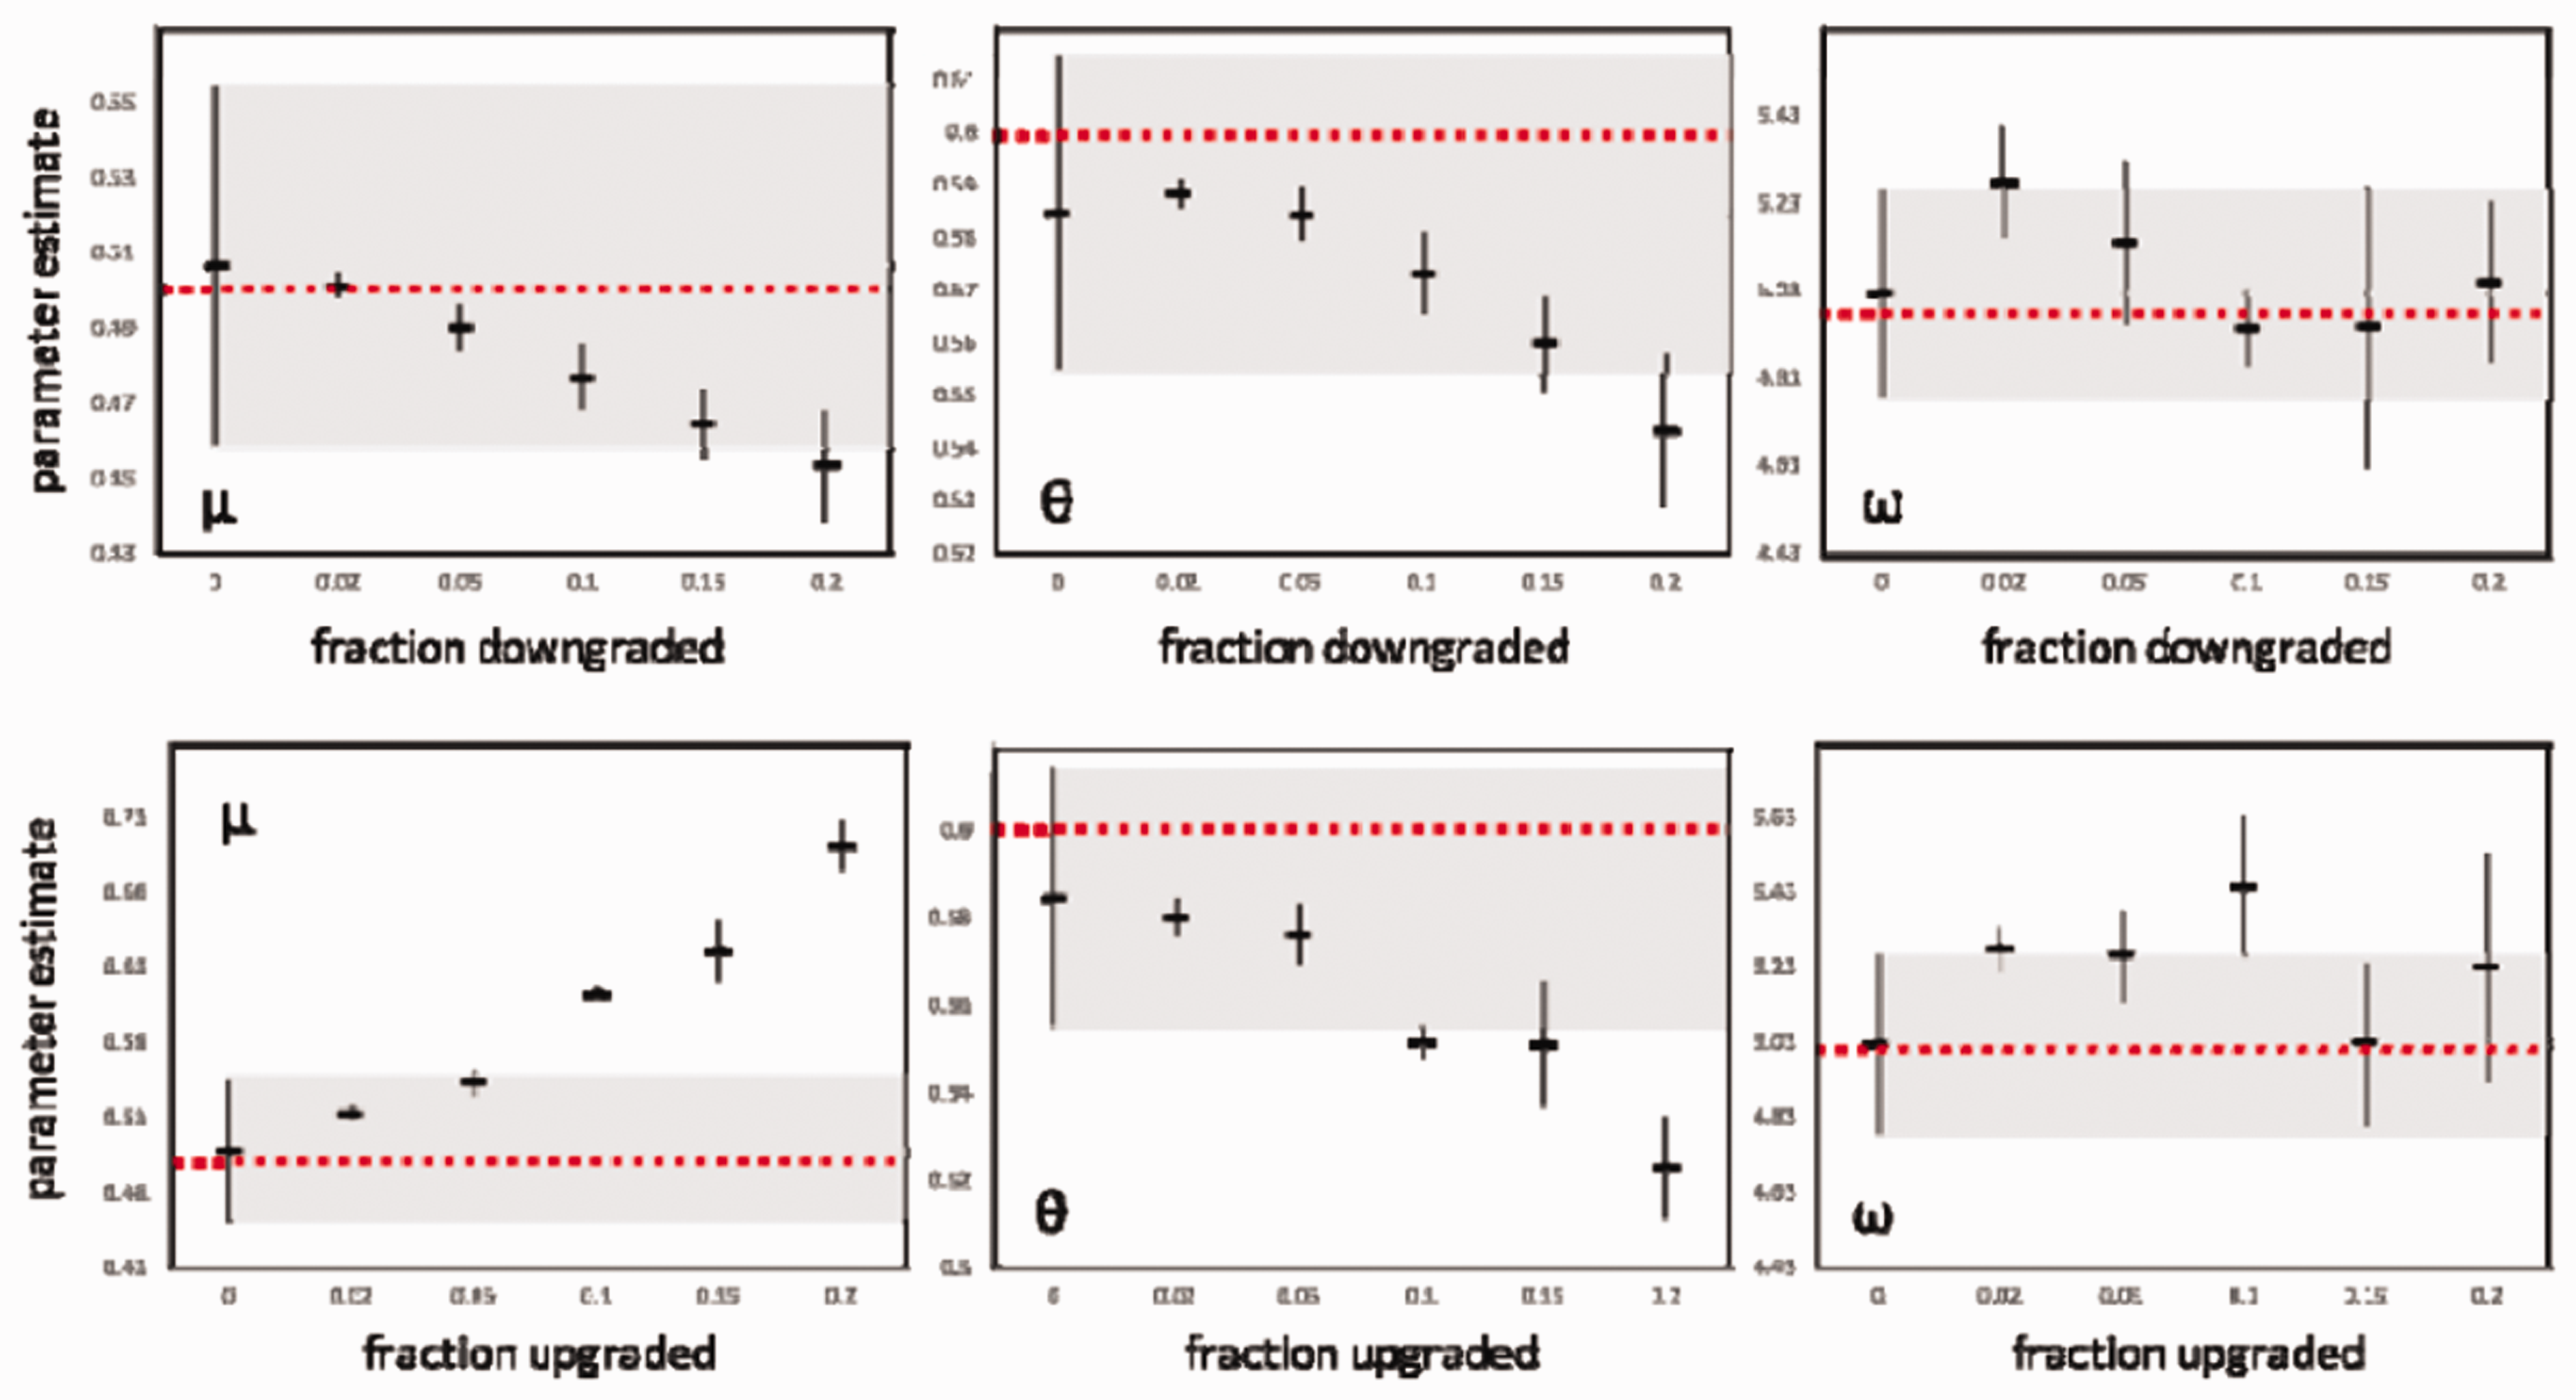
Optimizing harms
Responding to criticisms of discrimination in predictive policing is not simply a matter of resolving the problem of algorithmic biases. In a democratic society, the police conduct stop and frisk on a low percentage of the population, but some proportion of these stop and frisk reveals no criminal activity, and they can in some cases target wrongly suspected persons. A certain quantity of stop and frisk on the population is acceptable if the result is safety for the population. In other words, fruitless police stop and frisk on wrongly suspected persons are legitimate insofar as they are needed to produce of a supply of proactive policing, and only to the extent that these stop and frisk continue to benefit the population (Bambauer, 2014).
But in reality there is a disconnection between the population that benefits from the safety advantages of police proactivity and that which pays its costs in the form of unwarranted or inappropriate police stops (Harmon, 2012, 2015; Huq, 2016). This unavoidably harmful component of proactive policing is not randomly distributed in the population. It is concentrated on a minority who are in spatial and social proximity to suspected criminals. The main political problem in policing is that of the just distribution of harmful police action in the population and the associated regulation (Harmon 2012). Could protective machines not simply respond to this crucial problem as well by regulating day-to-day police work in such a way as to minimize the resulting harm caused to the population? How can data on police activity be strategically used at the operational level to decrease the frequency and impact of these harms?
In a white paper that is currently in preparation: “Using Data to Reduce Policing Harms,” 5 Hunchlab attempts to answer these questions by imagining how this unavoidable harmful portion of proactive police work could be reduced using a calculation. While it is difficult to model all of the harms caused by police action, Hunchlab proposes to deal with the portion of policing harm produced by patrolling activities in public places, that is all ordinary interactions that are negatively experienced by the population, in particular stop and frisks that do not reveal any criminal activity. After a stop, officers fill in a form that records various aspects of the situation, including the demographic characteristics of the suspect, the time and the place, the suspected crime, and the reason for the stop. After stopping someone, officers can proceed to frisk the person if they have a reasonable suspicion. The officers can also carry out a search if they believe that they have probable cause to suspect criminal activity. An officer can then decide to make an arrest or issue a summons, all of which is recorded on the form. The responses are then normalized, compiled, and made accessible as open data. A startup such as Hunchlab can thus easily use these data to analyze the contexts in which stops occur, and thus calculate the probability of fruitless stops.
In the white paper, Hunchlab presents the scenario of a machine that recommends patrol trajectories as a function of a more or less acceptable quantity of fruitless stops distributed in the population. But how should this quantity be distributed in space and time? As we saw above, predictive machines are designed not only to predict crime, but also to optimize the allocation of resources in order to maximize the public supply of safety: predictive policing takes a method of cost–benefit calculation which relates the total cost of mobilized resources to the expected gains in well-being associated to the dissuasion of avoided criminal activities and integrates it into a machine. Hunchlab proposes to extend this economic reasoning to the problem of reducing policing harms: if the police unavoidably cause disturbances as they produce safety, these can be considered negative externalities of the production of a public good. Policing harms represented nonnegligible portion of the cost of policing, which can be integrated into the calculation of the safety production function on which the dosage of patrols is based.
How should police activity be regulated in order to minimize the negative external costs that the police imposes on the population, while supporting it in the task of maintaining order? Well the white paper does not provide a precise definition of the concept of an externality linked to policing harms, it seems clear that the authors’ approach is inspired by methods used in environmental economics, and in particular those developed around the regulation of polluting businesses. The production of day-to-day safety can be treated as analogous to that of polluting goods: it generates diffuse negative externalities, with a low level of harm per individual, but which affect a large number of persons. While the white paper avoids the issue of the calculation of the quantitative value of the negative externality of police activity (mentioning only the possibility of a survey asking individuals about the stop and frisk they are willing to undergo in order to benefit from greater safety), it nonetheless offers some details on how these harms could be regulated. The principle used in environmental economics, of the gradual introduction of a system of progressive taxation, proposed in order to incite polluters to internalize negative externalities, could be transposed to public safety: For some harms, like fruitless stops, a graduated-progressive approach to magnitude — that is, a model that ratchets up the marginal harm of each additional fruitless stop as the total number goes up, as in progressive taxation — could help capture the more diffuse aspects of policing harms. (Using Data to Reduce Policing Harms, document in progress not yet publicly available)
Conclusion
What does this examination of the historical development and content of predictive machines in policing contribute? It enables us to understand predictive policing as a management tool for increasing the productivity of the police and reinforcing the sense of political legitimacy of policing among the population. By developing predictive platforms that collect and process data flows in real time in order to coordinate police activity in the field, the developers of these systems propose a new way to manage police work organization.
For example, the integration of stop and frisk quotas (which Skogan (2017) defines as an agency strategy in the Compstat process) requires officers to be proactive during their patrols according to production objectives established by their superiors. Officers are not simply encouraged to “make their numbers” by their bosses, but are continually monitored by a predictive machine designed to produce particular metrics of safety in real time. In other words, predictive platform developers seek to solve the problem of proactivity in policing: optimizing the daily vigilance of patrols in space and time and minimizing the amount of stop and frisk in the population. As a result, predictive policing is less a tool about the anticipation of crime a more like a dosage machine of safety in the continuity of Compstat. Of course, the metrics used to define safety and harm are subjective to debate, particularly as they are balanced against each other. In this case, driven by a desire to make this dosage fair, developers try to limit the algorithmic biases into the process of machine design and imagine an algorithmic solution that recommends patrol trajectories as a function of a more or less acceptable quantity of fruitless stops distributed in the population. PredPol or Hunchlab try to compute a quantitative norm that not only distributes safety in the population, but also corrects police behavior, and, thereby, reflect the right of each person to be protected against excessive stops guaranteed by the Fourth Amendment. To predict crime is to integrate rules for action into machine parameters—the cybernetic imaginary of grounding social harmony in calculations (Supiot, 2015).
As predictive policing private companies become more active actors in public safety policies, they must be continued to be closely followed by sociological inquiries. Understanding how these new actors help guide choices, give specific meaning to public action, and produce “algorithmic” rules that govern safety will be fundamental to understanding the practice of policing in our data and algorithm rich society.
Footnotes
Declaration of conflicting interests
The author(s) declared no potential conflicts of interest with respect to the research, authorship, and/or publication of this article.
Funding
The author(s) received no financial support for the research, authorship, and/or publication of this article.