
Abstract
Hopes and fears about algorithmic predictions are often rooted in the assumption that they represent a particularly actionable form of knowledge. Algorithmic predictions, the story goes, turn historical data into anticipatory actions instantly and on a large scale. Recent empirical evidence, however, casts doubt on whether algorithmic predictions are best understood as being inherently actionable. In this study, we draw on adjacent debates about actionable knowledge and reconceptualize the actionability of predictions as an active and deliberate construction accomplished by the designers of algorithmic systems. We demonstrate the value of this new perspective using material from an ethnographic research project on predictive policing in Germany. Over a 12-month period, we followed the work of designers in a police research unit responsible for developing an algorithmic system that generates crime predictions. We found that an important part of the designers’ work is calibrating the predictions. When engaging in calibration work, the designers adjust the form of the statistically calculated predictions—their volume, time, and space—to reflect their assumptions of what is most actionable knowledge for frontline police officers. Our study highlights a type of work on algorithmic systems that has received little attention, but which can have a significant impact on how the intended effects of algorithmic predictions are translated into their users’ actions.
Introduction
Currently, there is hardly a domain in which algorithmic predictions are not considered, prototyped, or otherwise experimented with. From medicine (Geampana and Perrotta, 2023) to insurance (Cevolini and Esposito, 2020), from education (Jarke and Macgilchrist, 2021) to agriculture (Heimstädt, 2023), and from finance (Borch and Hee Min, 2022) to policing (Egbert and Leese, 2021), it is being explored how algorithmic predictions can support, enhance, or even replace human decision making. Research on the broader transformative potential of algorithmic predictions suggests that they are a particularly actionable form of knowledge—one that insistently encourages people to make decisions and take anticipatory actions (Amoore, 2013; Büchner and Dosdall, 2021; Esposito, Hofmann and Coloni, 2024; Flyverbom and Garsten, 2021). In these accounts, actionability is oftentimes portrayed as an inherent quality of algorithmic predictions. This notion, however, is at odds with a growing body of empirical findings on the implementation of algorithmic predictions in real-world settings. These empirical accounts shed light on situations where algorithmic predictions fail to induce the intended action on the part of its users (Bader and Kaiser, 2019; Christin, 2017; Pachidi et al., 2021; Waardenburg et al., 2022). A lack of actionability often means that once ambitious experiments with algorithmic prediction are discontinued after a short time (Cummings, 2021; Ratner and Schrøder, 2024). In sum, actionability is a central concept for understanding the social consequences of algorithmic prediction. At present, however, the theoretical understanding of actionability as a natural and inherent quality of predictions does not correspond to their often hesitant reception by users. This gives rise to problems, such as the difficulty of properly assessing when and how algorithmic predictions augment or accelerate the decisions and actions of human users.
To overcome this mismatch, we propose to bring research on algorithmic prediction in conversation with more established debates about the actionability of knowledge. In these adjacent (but so far unconnected) debates, actionability is not understood as a natural and inherent quality of knowledge, but as a quality that needs to be actively constructed. For example, researchers have examined how to make paradigmatic assumptions and choose research methods in order to render scientific knowledge actionable (Argyris, 1996; Kieser, Nicolai and Seidl, 2015). In a similar vein, there has been research into how creators of data sets design them so that they are perceived by other users as prompts to intervene in the world (Hansen and Borch, 2022; Jasanoff, 2017). We take this research on the construction of actionability as an invitation to de-naturalize the actionability of algorithmic predictions as well. A particularly relevant setting for studying the social construction of actionable predictions is the work of people who design algorithmic prediction systems (Bailey and Barley, 2020). While previous research has focused primarily on how these designers develop “ground-truth” data sets for training algorithmic models (Jaton, 2021; Kang, 2023; Orr and Crawford, 2024; Semel, 2022), we are particularly interested in how designers shape the predictions that result from the application of these algorithmic models to new data sets. This specific perspective on a barely explored aspect of designing algorithmic systems allows us to learn more about the oftentimes subtle and mundane ways in which the designers of predictive algorithms attempt to make the outputs of these systems actionable for potential users.
A research project on predictive policing in Germany gave us the opportunity to examine in close detail how the designers of an algorithmic system actively construct the actionability of the system's output. Specifically, during a 12-month ethnographic stay in a research unit of a State Criminal Police Office, we noticed the great importance of the concept of actionability for our participants. The research unit's mandate was to develop and maintain an algorithmic system for making predictions about residential burglaries. The stated aim of this initiative was that the predictions would help police officers across the state to take action to prevent burglaries. As we spent time among the designers, we understood that actionability is not just a theoretical label used by researchers to understand the transformative potential of predictions, but also a meaningful concept for the designers of predictive systems to structure and orient their work. By talking about actionability, the designers opened up a space to evaluate the quality of the predictions beyond questions of statistical soundness. To render the algorithmic predictions more actionable, the designers engage in three types of what we conceptualize as calibration work. When calibrating the algorithmic system, the designers adjust the form of the predictions according to their ideas of what knowledge about the future looks like that is not only statistically sound but also actionable for potential users. During the development of the algorithmic system, they pursue actionability by calibrating (1) the volume of predictions sent to regional police offices, (2) the time frame for which a set of predictions is valid, and (3) the size and contour of the spatial area for which individual predictions are made.
The main contribution of our study is that we introduce calibration work as a type of work on algorithmic systems that has received little attention to date, but which can have a substantial effect on how the objectives behind algorithmic predictions are translated into the actions of their users. Calibration work thus differs from other more prominent activities in the design process, such as assembling data sets or training predictive models (Jaton, 2021; Orr and Crawford, 2024; Semel, 2022), as well as from more mundane activities that take place after the design process is complete, such as repair and maintenance work (Jackson, 2014; Sachs, 2020).
Algorithmic prediction and actionability
Currently, attempts are being made in almost all domains of life to find out whether algorithmic predictions can support people in their decisions and actions. In domains such as medicine (Geampana and Perrotta, 2023), social services (Ratner and Elmholdt, 2023), or education (Jarke and Macgilchrist, 2021), algorithmic predictions are developed to support experts in selecting the best interventions for their clients. In areas such as finance (Borch and Hee Min, 2022), insurance (Cevolini and Esposito, 2020), agriculture (Heimstädt, 2023) and even the arts (Sachs, 2020), algorithmic predictions are introduced in order to help clients make better decisions themselves. And with regard to social phenomena like protests (Grill, 2021) or crime (Egbert and Leese, 2021)—the latter also being the empirical context of this study—algorithmic predictions are drawn upon by state authorities to maintain social order.
This proliferation of algorithmic prediction is often associated with the idea that it is a particularly actionable form of knowledge—one that enables, encourages, or even obliges people to make decisions and take actions (Amoore, 2013; Büchner and Dosdall, 2021; Esposito et al., 2024; Flyverbom and Garsten, 2021). Notably, many inquiries into the broader transformative potential of algorithmic predictions give the impression that the actionability of predictions results directly from the combination of large data sets with advanced statistical methods. For example, in a study of algorithmic systems in financial trading, Borch and Hee Min (2022: 1) argue that such systems “extract patterns from huge amounts of data to make actionable predictions when confronted with new data.” While the authors are interested in how users of these systems attempt to “explain the actionable predictions” (2022: 2), the question of whether the actionability of the predictions necessarily results from the technical procedures of pattern extraction and application is not explicitly addressed. A similar taken-for-grantedness of the actionability of predictions can be found in the conceptual work of Flyverbom and Garsten (2021) on the links between different forms of knowledge about the future and anticipatory actions in organizations. They argue that, compared to other forms of future-oriented knowledge, such as statistical trend reports or narrative scenarios, algorithmic predictions represent particularly “invasive attempts to shape future patterns of action” (2021: 12). The authors thus claim that algorithmic predictions, as a form of knowledge, have in general a very immediate influence on actions. Taken together, we see that algorithmic predictions are often—at least implicitly—portrayed as an inherently actionable form of knowledge, an attribution that is made plausible by reference to the specific methods of knowledge production involved (e.g. large data sets, pattern extraction) or in demarcation from other forms of knowledge (e.g. trends, scenarios).
However, empirical findings on the use of algorithmic predictions in real-world settings are increasingly casting doubt on the idea of their inherent actionability. Some of these studies report on organizations and institutional contexts in which managers and data scientists emphasize the actionability of algorithmic predictions, but in which the actual users of the predictions find them irrelevant or distracting (Brayne and Christin, 2021; Christin, 2017; Pachidi et al., 2021). Other studies look at the life cycles of experiments and initiatives on algorithmic prediction. They reveal that a lack of perceived actionability is one of the reasons why many real-world experiments with algorithmic prediction are discontinued after the pilot phase (Cummings, 2021; Ratner and Schrøder, 2024). The discrepancy between the popular characterization of predictions as inherently actionable and their repeatedly observed lack of actionability in practice raises a number of concerns. Do characterizations lean too heavily on the “modern myth” (Ziewitz, 2016: 8) of algorithms as particularly powerful actors? Or is it rather the case that empirical studies have not examined the practical use of algorithmic predictions persistently or broadly enough to recognize their action-inducing nature?
In this study, we propose that one way to resolve this discrepancy in the literature is to shift the perspective on actionability itself—from a static property that forms of knowledge either naturally have or do not have, to a property that can be actively and deliberately constructed in knowledge production processes. This alternative perspective is already established in research on other forms of knowledge and therefore seems as a useful way of informing research on algorithmic predictions. For example, organizational research has long been grappling with the question of how to create actionable scientific knowledge. In the second half of the twentieth century, criticism was voiced within organizational research that the narrow focus on positivist knowledge overlooked the uniqueness of each organization and was therefore not useful for solving real-world problems (see Kieser et al., 2015: 161–165). As an alternative, some members of this academic community proposed “action research” as a new paradigm in which researchers would be actively involved in the solution of concrete problems in organizations (Susman and Evered, 1978). Instead of knowledge that is internally valid but practically useless, proponents of action research believed their new paradigm to bring about “actionable knowledge” (Argyris, 1996). From the perspective of the proponents of action research, scientific knowledge is actionable “if the actions that arise from it solve an organization's specific problems” (Kieser et al., 2015: 164). It becomes clear here that actionability was not understood as a quality of knowledge that inevitably resulted from scientific research, but as something that had to be actively constructed through certain paradigmatic assumptions and research methods.
Another, more recent line of work, in which the social construction of actionability is particularly clearly pointed out, deals with data as a form of knowledge (Alaimo and Kallinikos, 2022; Flyverbom and Murray, 2018; Hansen and Borch, 2022). Contributions to this line of work share the assumption that data is never simply “neutral” or “raw,” but always the result of an active construction of the relationships between the observer, the observed object, and the consumer of the observation (Bowker, 2005; Gitelman, 2013). From this perspective, actionability is seen as a quality of data that may or may not result from this construction process. Jasanoff (2017) has explored this construction process with regard to data on global environmental phenomena. She argues that data on phenomena such as climate change can only “elicit a social response” (2017: 2) from politicians or legislators if these actors perceive it as actionable. To be “seen as actionable,” she suggests, a data set must “show people both something actual and something that begs to be investigated, explained, or solved” (2017: 2, emphasis in original). Tempini and Leonelli (2021) investigated this proposition in the field of precision oncology and found that medical experts evaluate the actionability of a data set both on the basis of the predictive relationships it reveals to them and on the basis of what kind of interventions (i.e. treatments) their institutional and organizational context actually allows for. Taken together, the construction of a data set as actionable can be considered a success if the consumers of that data set interpret it not only as a representation of reality, but also as a prompt or even a guideline for practical interventions in that reality.
Examining the actionability of algorithmic predictions not as an inherent quality, but as an actively constructed one, may allow us to better understand the inconsistencies described above—namely, that the popular description of algorithmic predictions as a particularly actionable form of knowledge collides with empirical findings about a lack of actionability in practice. To examine in more detail how the actionability of predictions is achieved, we turn to an approach that examines the social construction of technology through the situated work practices of its designers (Bailey and Barley, 2020). In line with this approach, several studies have already examined the piecemeal, complex and sometimes messy work of creating training data for machine learning algorithms (Kang, 2023; Orr and Crawford, 2024; Semel, 2022). Although studies suggest that the actionability of predictions depends not only on these trained models, but also on the user-facing form and presentation of the predictions (Jarke and Macgilchrist, 2021), we know little about this aspect of the design work. In the remainder of this paper, we therefore address the exploratory research question: How do the designers of an algorithmic system for generating crime predictions attempt to make its outputs actionable?
Methods
Setting and data collection
To address our research question, we use empirical material from a larger ethnographic research project on predictive policing in one of Germany's 16 states. In this project, we—the first and second author—investigated how crime predictions are produced, distributed, and used across the state's police organizations. Here, we focus on the production of crime predictions at POLAR (a pseudonym), a research unit within the State Criminal Police Office. Police organizations engaged in predictive policing often purchase the algorithmic system used to produce crime predictions from private software companies (Brayne, 2021; Egbert and Leese, 2021). The trade secrets involved in such external procurement can make it very difficult for researchers to gain deep insights into the design of an algorithmic system (Burrell, 2016). In our “revelatory case” (Yin, 2018: 86), however, the algorithmic system was developed by the State Criminal Police Office itself, which allowed us to empirically examine in great depth the work of the system's designers. We negotiated ethnographic field access to POLAR through an official request to the state's Ministry of the Interior. The fact that the second author had already conducted interviews with members of POLAR for a previous research project probably helped to ensure that our inquiry was approved.
In 2015, a team of data scientists and criminologists at POLAR began developing an algorithmic system to predict residential burglaries. This type of crime was chosen for two reasons: First, the number of residential burglaries increased sharply at this time. The police leadership was therefore looking for a way to signal that it was taking the problem seriously. Second, the police leadership assumed that residential burglary was a type of crime that could be proactively prevented through increased police presence in “risky” areas. The structure of the offence thus matched the method of predictive policing, which led the police leadership to instruct POLAR to develop the algorithmic system. By the end of 2017, the POLAR team was able to regularly produce crime predictions for all regional police agencies in the state. Since then, the system has been routinely operated and continuously improved by POLAR staff.
The data collection for our larger research project predominantly took place over a 12-month period between 2022 and 2023. During this time, we spent several days at the POLAR research unit (about 75 h in total). We were able to talk to all the staff and ask them to explain the various tasks and projects of the research unit. On days when new crime predictions were being produced, we closely observed this process. To do this, we sat right next to the employees responsible for operating the algorithmic system. We asked the employees to describe their work steps to us in great detail as they proceed through their routine activity (e.g. what kind of data they retrieve, what software they use). We audio-recorded these descriptions and transcribed them later on. In addition, we took handwritten notes (e.g. on work steps that were not made explicit by the employees). At the end of each day, we compared our notes and merged them into a joint document. In addition, we took many photos of computer screens (e.g. showing spreadsheets or interfaces of statistical software). When we weren’t observing the production of predictions, we conducted semi-structured interviews with most of the POLAR employees who had been involved in the development or maintenance of the algorithmic system (20 interviews in total, some pre- and post-dating the 12-month data collection period). Finally, we collected documents related to the algorithmic system, including technical documentation and reports, presentation slides, email correspondence, and scientific publications written by POLAR staff (70 documents in total).
Data analysis
Our data analysis process consisted of three phases. In the first phase, we reconstructed the routine process by which members of POLAR produced new crime predictions at the time of our data collection. Reconstructing this routine process allowed us to understand the steps through which crime predictions take their final form. We used documents to understand what artifacts and infrastructures (e.g. databases, software, scripts, models) are involved in the process. Our transcripts and field notes helped us reconstruct how members of POLAR bring these elements together to produce crime predictions from crime data. Already in this first phase of analysis, it became clear to us that for the designers, the question of actionability played an important role in the design of this routine process.
How the designers of a technology approach the question of actionability also depends on how they are able to interact with the intended users of the technology (Bailey and Barley, 2020). In the second phase of our analysis, we therefore sought to understand how the designers at POLAR engaged with the intended users in the regional police agencies regarding the question of actionability. For the period between 2015 and 2017, we were again able to draw on extensive documents. For the time after 2017, there were fewer documents on the development process, which is why we also drew on our interviews with designers. Circling through this data repeatedly, we understood that the development process consisted of two phases in which the designers discussed matters of actionability with frontline police officers in different ways. At the beginning of the development process, regular meetings were held with representatives of the regional police agencies. However, as the algorithmic system became more mature, formal opportunities for exchange with regional police agencies diminished and designers had to rely primarily on occasional informal conversations with users.
Having charted the scope and context of work on the algorithmic system, our aim in the third and final phase of the analysis was to understand the actual working practices that the designers used to modify the form of the predictions towards greater actionability. After a further round of coding, it emerged from our data that designers distinguished their pursuit of actionability from other parts of their work. From their perspective, the pursuit of actionability often represented a tension or even a contradiction with more “technical” aspects of their work, e.g. established statistical procedures and quality criteria. We returned to the data to better understand this “other” of the designers’ work. At this point, we moved back and forth between our data and the literature on working practices around algorithmic systems. Unable to find a concept that fully captured the working practices we identified, 1 we conceptualized them as calibration work. Calibration often refers to the adjustment of the output of a newly constructed technical device to a reference point external to that device (see Collins, 1985: 79–112). In the context of developing algorithmic systems, calibration work then describes how designers adjust the form of algorithmically calculated predictions (e.g. the contours of the geographical areas for which crime is predicted) to their ideas of actionable knowledge about the future. Applying the concept of calibration work to our data in a final round of coding, we eventually identified three distinct types: Adapting the form of predictions by modifying their quantitative, temporal, and spatial dimensions.
In the following, we first describe the routine process of producing predictions (first phase of analysis), then the designers’ attempts to obtain knowledge about the use of the predictions (second phase of analysis), and finally the three types of calibration work with which the designers attempt to make the predictions actionable (third phase of analysis).
Findings
Routinely producing actionable predictions
At the beginning of each week, the POLAR team produces new residential burglary predictions for the entire state. The predictions are produced centrally by POLAR and subsequently made available to the state's regional police agencies. On a typical Monday morning, a POLAR staff member downloads the latest residential burglary data from a police database. Using a memory stick, the person transfers the crime data to a “dirt computer” (Criminologist, Interview, August 2022)—a computer, which for safety reasons is not connected to the police network but runs statistical software and houses the algorithmically trained predictive model. In the statistical software, the person responsible for generating the predictions (the task rotates within the team) runs a script that preprocesses the new data and eventually applies the predictive model to calculate new burglary predictions. The time required for this process varies from 30 min to several hours, depending on the amount of new data to be processed and whether “everyday troubles” (Ziewitz, 2017: 10) occur during the execution of the script that need to be solved by one of POLAR's data scientists. For example, during one of our first observations of the process, the execution of the script suddenly stopped and a red error message appeared on the screen. The incident seemed remarkable to us, but a data scientist was quick to emphasize the mundanity of the event: This is an error message. Basically, it's a follow-up error message from our server change, because we didn’t transfer all [past] predictions from the old server to the new one. So basically we still need to do a final update of the data. It's nothing particularly earth-shattering. (Fieldnotes, August 2022)
When the script has been successfully executed, the algorithmic system outputs a folder full of spreadsheets. In the folder, there is one “large” spreadsheet for each regional police agency. The large spreadsheet contains a long list of 14-digit alpha-numeric codes, each of which is assigned a numeric value between 0 and 100 (see Figure 1). The codes represent geographic areas within a regional police agency's jurisdiction. The entire jurisdiction of each regional police agency is divided into these smaller areas, all of which are included in the large spreadsheet. POLAR staff refer to the numerical value between 0 and 100 as the “model probability” of an area (Field notes, November 2022). On most Mondays, the folder also contains “small” spreadsheets for some of the regional police agencies. Which regional police agencies receive a small spreadsheet varies from week to week, but regional police agencies in high-crime cities tend to receive a small spreadsheet more often than those whose jurisdictions are primarily rural. The small spreadsheets look very similar to the large spreadsheets but contain much fewer rows of area codes and probability values (see Figure 1). Members of POLAR sometimes refer to the entries in the small spreadsheets as the “real predictions” (Criminologist, Interview, January 2023). Once the production of spreadsheets is completed, the employee in charge carries out a visual inspection: We always take a look to see whether the spreadsheets look reasonable. Whether at least the prediction date is correct, whether the values shown here make sense. If it says ‘minus three thousand’, we would know that something has definitely gone very wrong. Or if it didn’t show the [alpha-numeric codes], then we’d know it just didn’t work. (Data scientist, Interview, August 2022)
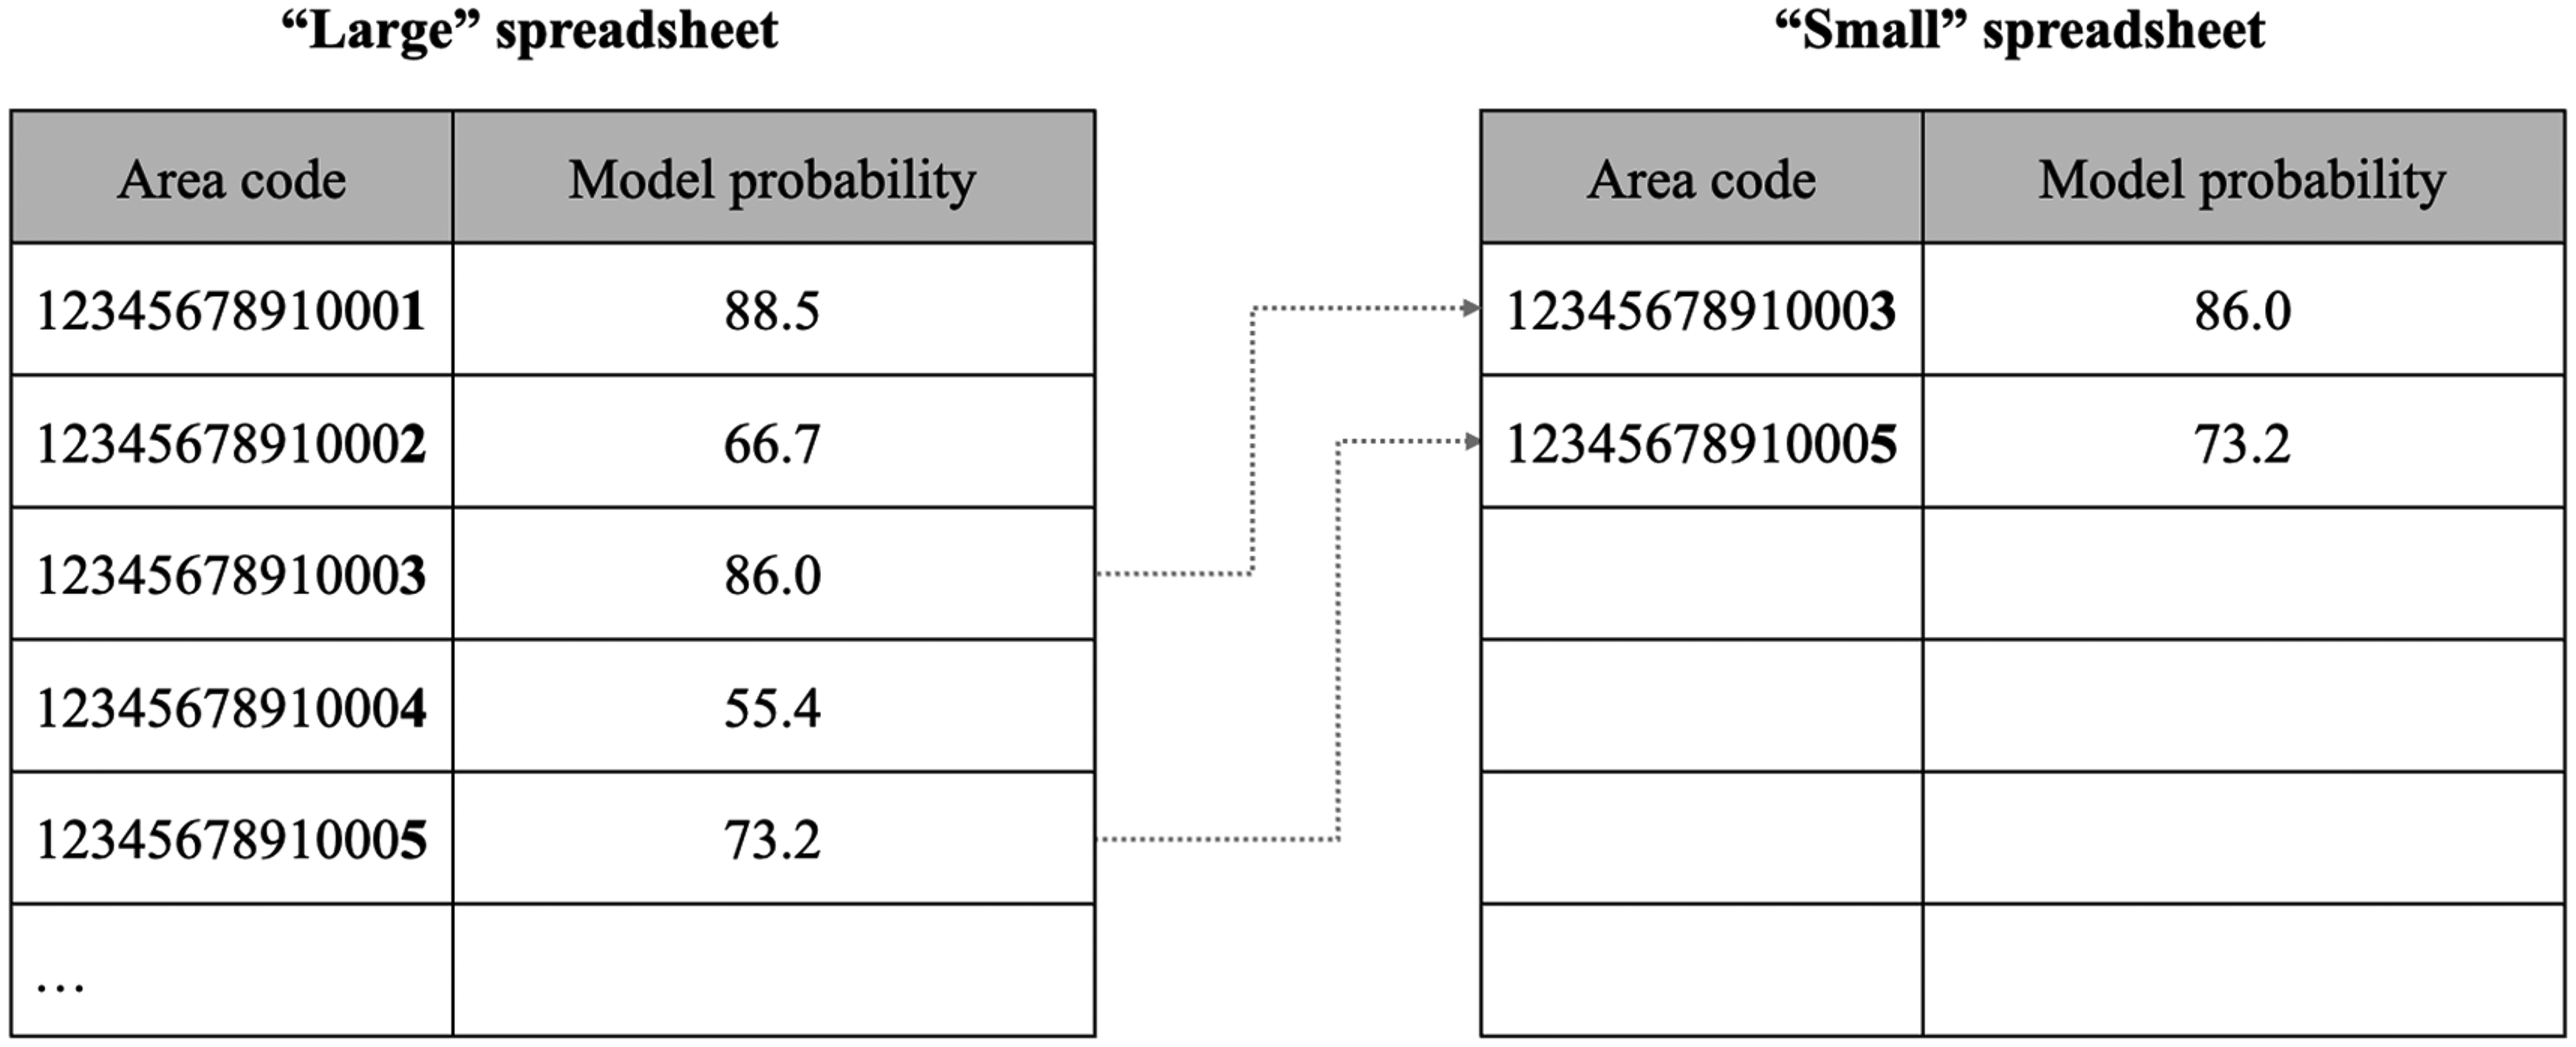
Schematic representation of the “large” and “small” spreadsheets.
Once the spreadsheets have passed this inspection, the POLAR employee transfers both the large and small spreadsheets back to a computer on the police network and uploads them to a cloud storage location that is accessible to all regional police agencies. As a final step, the employee sends a standardized e-mail to the agencies informing them that the new predictions are now available online.
Designing for actionability at a distance
A common challenge of any design work is that designers can only have incomplete knowledge about the contexts in which their products and services will be used (e.g. Akrich, 1995; Woolgar, 1990). An important part of the work of designers is therefore to find ways to deal with the distance (spatial as well as cognitive) between the context in which an object or a technology is developed and the context in which it is used. Previous studies on the development of algorithmic systems have described, for example, that designers deal with this distance by conducting “prototype testings” with potential users (Heimstädt, 2023: 176) or even establish more longstanding processes of “mutual learning” with domain experts (van den Broek et al., 2021: 1557).
The POLAR team faces this challenge as well. They produce predictions, but can know very little about the specifics of the many dozens of regional police agencies where the predictions are supposed to be used. Although some members of POLAR have personal experience in frontline police work, this selective experience is of little help given the great heterogeneity of the regional police agencies (of which there are several dozen, in both rural and urban environments). In addition, POLAR is embedded in a wider network of police organizations whose strictly bureaucratic character makes lateral coordination difficult. How the designers gained knowledge about the needs of their potential users in this situation can be divided into two temporal phases. In the first phase, the focus was on formal procedures to gain user feedback at a distance. In the second phase, formal procedures were no longer available and POLAR employees had to rely on the few informal occasions for communication available to them.
The first phase lasted from the beginning of 2015 to the end of 2017. During this phase, the management of the State Criminal Police Office classified the development of the algorithmic system by POLAR as a temporary “research project” (Press release, January 2015). At the beginning of the phase, the POLAR team worked with only two regional police agencies. These agencies were chosen because they were both fairly large, structurally similar (predominantly urban), and had similarly high-crime rates. The designers hoped to be able to leverage this similarity for the development of the first prototype of the algorithmic system. Over time, more and more regional police agencies were added to the project. At the end of the phase, POLAR produced crime predictions for all regional police agencies in the state. During this time, formal meetings were held every 2 weeks between the POLAR designers and representatives of the participating regional police agencies. During these meetings, the designers provided information on the progress of the algorithmic system. The representatives of the agencies provided information on the extent to which the predictions were already being “implemented” and “put into practice” (Evaluation report, January 2018). These meetings also allowed “feedback from administrative practice to be incorporated into the [algorithmic] system” (Evaluation report, January 2018). On the one hand, the meetings allowed the designers to gain regular impressions of the use of the predictions through discussions with the representatives. At the same time, this form of feedback was described by some participants in the meetings as “very intensive in terms of content and time” (Evaluation report, January 2018).
The second phase began in early 2018 and was ongoing at the time of data collection. The phase began when the management of the State Criminal Police Office evaluated its predictive policing initiative, considered it a success, and eventually reclassified POLAR's development of the algorithmic system from a temporary research project to a permanent duty. This reclassification had a significant impact on the opportunities for exchange between the designers and users of the predictions. First, the reclassification put an end to the “intensive” formal meetings between POLAR and representatives of the regional police agencies, because the State Criminal Police Office considered the development of the algorithmic system to be completed. Second, the State Criminal Police Office made it clear to POLAR that it did not wish to systematically collect data on the use of the predictions in regional police agencies. With this measure, POLAR employees suspected, the State Criminal Police Office intended to prevent frontline police officers from not using the predictions because they perceived them as hierarchical surveillance or an unjustified restriction of their professional autonomy (see Brayne, 2021; Christin, 2017). The difficulty of providing services to the regional police agencies without being perceived as too patronizing was something that some of the POLAR employees knew from their own experience: I used to be an analyst at the State Criminal Police Office for three years and I had many meetings with regional police agencies. There was always the reservation towards us that we were too bossy. I was confronted with concerns like ‘If we tell you too much, I don’t know what will happen to it. Maybe you’ll tell the Ministry of the Interior straight away. Or there’ll be an order, then you’ll impose something on us.’ So there's just a lot of mistrust. (Criminologist, Interview, January 2023)
Although predictive policing was no longer a research project, the POLAR team continued to develop the algorithmic system and tried to further improve the actionability of the predictions. To do so, they increasingly relied on informal techniques to build knowledge about the use of predictions. For example, one of the designers told us that her husband's friend happens to be a police officer in a city that receives predictions from POLAR. Through informal conversations with this personal acquaintance, the designer learned about areas that “keep getting predicted even though nothing has ever happened there” (Data scientist, Interview, March 2024). Based on this informal feedback, the team of designers made adjustments to the predictive model. The designers also used incoming phone calls from frontline police officers. Sometimes police officers call POLAR to ask questions about the latest predictions. Designers sometimes steer these conversations toward the actionability of the predictions and prompt the callers to make “suggestions” for further improvements (Data scientist, Interview, March 2024). These formal and informal techniques allowed the designers of POLAR to come to terms with the fact that they knew little about the use of the predictions in the many different regional police agencies.
Through these formal and informal exchanges, the designers felt at least sufficiently informed to calibrate the algorithmic system to produce actionable predictions. In the designers’ daily activities, three types of calibration work can be distinguished, each focusing on a different dimension of the predictions (volume, time, space), but all aiming at the same goal, that is, ensuring actionability.
Calibrating the volume: numerically consistent or statistically valid?
Influenced by the information they gathered from frontline police officers, the POLAR team regularly discusses the scarcity of human and material resources in regional police agencies: “We get the impression that a lot of things that could be done with the predictions are not done. Maybe they can’t get it right because of resource problems” (Head of POLAR, Interview, June 2023). Again and again, the designers tie these discussions back to the development of their algorithmic system and deliberate what volume of weekly predictions would be most actionable given the scarce resources on the frontline. When the designers calibrate the volume of predictions, they develop ‘filters’ that adjust the volume of predictions calculated by the statistical model to an amount that the designers believe can be processed at the frontline and will not lead to a feeling of being overloaded or underserved. The work of calibrating the volume becomes particularly tangible at a point in the development process when the designers drastically change their view on what volume of predictions is most actionable.
At the time of our visits to the POLAR office, the regional police agencies receive their weekly predictions in the form of small spreadsheets, whereby the number of predictions in these spreadsheets and the number of agencies that receive them fluctuates. However, this division into large and small spreadsheets has not existed since the beginning of predictive policing activities. An earlier version of the algorithmic system produced only one large spreadsheet for each regional police agency each week. At that time, the designers assumed that a numerically consistent volume of predictions would be most actionable for regional police agencies. At the same time, they were eager to make use of some of the suggestions they received from frontline police officers and “take into account the different sizes of regional police agencies” (Data scientist, Interview, March 2024). They therefore calibrated the algorithmic system so that in each of the large spreadsheets, exactly 1.5% of the geographic areas were marked as “real” predictions each week, namely the 1.5% with the highest probability value. Police agencies with a large jurisdiction thus consistently received around 20 real predictions each week. Police agencies with a small jurisdiction consistently received a smaller number.
At one point in the development process, however, the designers’ view on what volume of predictions is most actionable changed. Influenced by personnel changes in the team, the designers became increasingly convinced that the previous approach to determining the volume of the predictions was “methodologically suboptimal” (Data scientist, Interview, March 2024). Instead of favoring numerical consistency, they now publicly advocated the view that crime predictions are most actionable when they meet high statistical quality criteria. However, the new focus on statistical soundness meant that the volume of predictions was no longer consistent but began to fluctuate. From that point on, it was no longer the case that each regional police agency received a small spreadsheet each week. And even if a regional police agency continues to receive small spreadsheets on a regular basis, the number of predictions in them could now fluctuate significantly from week to week.
In the algorithmic system, this change was implemented by amending the script that generates the predictions. The designers refer to this amendment as adding a “model evaluation” (Data scientist, Interview, February 2023). The model evaluation takes action immediately after the prediction model is applied to the new crime data. During the model evaluation, all entries in the large spreadsheet are sent through a series of statistical tests (i.e. for “precision,” “recall,” and “accuracy”). Only if an area's model probability passes the threshold for each of these tests is it added to the small spreadsheet. This procedure may, for example, result in an area with a very high model probability not being included in the small spreadsheet (because it did not pass the statistical tests), while an area with a lower model probability is included (because it passed the statistical tests) (see Figure 1). The designers at POLAR are convinced that extending the script with statistical tests has made the predictions “truly robust,” “methodologically reliable,” and “statistically valid” (Data scientists, Interviews, January–March 2023). At the same time, they point out that changing the volume exclusively according to statistical quality criteria would probably have resulted in regional police agencies losing interest in the predictions altogether: If the agencies didn’t receive any predictions from us for like six months, acceptance would drop massively. There would be no one to contact. No one would check their email inbox for the predictions anymore. (Criminologist, Interview, January 2023)
The calibration work in this scene does not consist of inserting the model evaluation itself. Rather, the calibration work consists of tinkering with the thresholds of the new statistical tests until the regional police agencies receive fewer predictions than before—but not too few. At the time of our observations at POLAR, this “balancing act” (Data scientist, Interview, February 2023) resulted in some regional police agencies receiving no predictions in a given week while the rest received a maximum of 10 predictions.
In sum, from the designers’ perspective, the volume of predictions is not determined by the data or the predictive model. They do not see the volume as the result of a “mechanical projection of the past onto the future” (Rona-Tas, 2020: 13) but as something that needs to be calibrated in order to make the individual predictions more actionable for frontline police officers. In the course of developing the algorithmic system, the designers significantly reduced the weekly volume of predictions. On the surface, this reduction was justified by a greater emphasis on statistical soundness. Behind the scenes, however, assumptions about the scarce resources and rigid routines of regional police agencies also played an important role in setting the thresholds for the newly introduced statistical tests.
Calibrating the time: theoretically flexible but practically restricted?
“Monday is prediction day” was the brief answer to our question as to when we could visit the POLAR office for our ethnographic study (Field notes, July 2022). During our subsequent visits, we quickly learned that the temporal validity of predictions and the resulting rhythm of their production are a key concern in the design of the algorithmic system. This ethnographic observation corresponds with mathematical research, from whose perspective the “architecture” of a statistical model for classifying historical data “knows no future” (Lopez, 2021: 15). Rather, what makes the “statistical analysis of the past a ‘prediction’ is the active assumption that the future will behave in the same way that the past has behaved” (2021: 15, emphasis added). For the POLAR designers, articulating and justifying this “active assumption” was another facet of their calibration work. When the designers calibrate the temporal validity of the predictions, their challenge is to present a fixed temporal interval as plausible or even inevitable, despite the timelessness of the statistical procedures themselves. Once again, the designers adapt the statistically calculated predictions to their assumptions about which temporal interval is particularly actionable for frontline police officers.
At the center of this type of calibration work are established scientific theories from criminological research that suggest a connection between past data and future crimes. In one of POLAR's publicly available reports on its predictive policing activities, the unit provides a list of criminological theories, such as “routine activity theory,” “crime pattern theory,” or “broken windows theory,” that have informed the development of the algorithmic system (Project report, January 2018). One theory that the designers of the algorithmic system most often referred to in our discussions and in which the connection between past and future becomes particularly clear is the so-called “near-repeat approach” (Bowers et al., 2004). The theory suggests that in the case of professional burglaries, there is a high risk that other burglaries will occur in the immediate vicinity. POLAR employees mobilize the near-repeat approach in order to justify to their various audiences (e.g. the public, the State Criminal Police Office, regional police agencies) that their statistical analysis of data from the past allows statements to be made about crime in the future. From the very beginning, POLAR has specified the official validity of the predictions as exactly 7 days. This is remarkable insofar as the near-repeat approach mobilized by POLAR is less precise in this temporal dimension. According to theory, a shorter or longer period would be permissible, too. The calibration work of the developers we observed therefore consisted primarily of justifying to various stakeholders why the temporal validity of the predictions is theoretically flexible but practically restricted.
In their formal feedback meetings with representatives of the regional police agencies, the designers of POLAR were often confronted with the wish to receive predictions at intervals of less than a week. In internal communication with the regional police departments, POLAR makes it clear that shorter intervals might be justified by the near-repeat theory but are not actionable in practice: “Shorter prediction intervals would be possible and professionally justifiable. However, this would increase the organizational effort for the planning and implementation of police interventions” (FAQ document, January 2023). The “planning and implementation” refers to a procedure that POLAR developed with the regional police agencies during their joint meetings. The procedure requires that the predictions be received by local crime analysts in the agencies. The analysts then convert the predictions into maps with color-coded areas. The analysts then send these maps to patrol officers. When asked about the frequency of the predictions, one of the designers explains that although the temporal validity was initially discussed at length within the team, there were ultimately various reasons in favor of the seven-day interval: It just wasn’t practical for us in the team to make it any shorter, because we always have to pull the data and run the model. There always has to be someone who is familiar with the prediction routine. And that's something that takes at least an hour. Even more important are the processes in the regional police agencies. […] If they receive predictions more than once a week, it wouldn’t be easy to integrate them into their work process. (Data scientist, Interview, March 2024)
Particularly interesting about this account is that the temporal validity of the predictions is no longer justified exclusively on the basis of their actionability for frontline police officers, but that the routines and limited resources of POLAR itself are also brought in. For the calibration of the upper temporal limit of the predictions, POLAR uses a slightly different argumentation pattern: “The longer the validity period, the more likely it is that the intention and effect of a crime prediction shifts and changes its character towards a strategic tool” (Project report, January 2018). The designers here argue that burglary predictions with a validity period of more than one week lose the character of a prediction and become a different, “strategic” type of knowledge about the future—one that may also be useful for the police in a broader sense, but that does not directly inform or induce actions and decisions.
Overall, the designers of POLAR consider it an important task to calibrate the temporal validity of crime predictions in a way they assume to be particularly actionable for police officers. This type of calibration is necessary because, in most cases, a precise temporal validity needs an “active assumption” that cannot be derived either from the data or from supporting theories. For the designers of POLAR, the calibration work consisted of identifying and justifying a time period—1 week—that would fit both the routines and resources of their own research unit and the workflows they expected in the regional police agencies.
Calibrating the space: uniform size or intuitive contour?
POLAR's predictions are not about the future behavior of specific individuals, but about the potential for criminal activity (i.e. burglaries) in specific areas. In the language of criminological research, this type of prediction is called “place-based predictive policing” and stands in contrast to “person-based predictive policing” in which risk scores for individuals are determined (see Heimstädt et al., 2021; Sommerer, 2022). Thus, in addition to volume and time, the calibration of “place”—the spatial dimension of predictions—plays a central role for the designers of the algorithmic system. When the designers calibrate the spatial dimension of the predictions, they are trying to determine which layout of prediction areas (size and contour) is most actionable for users within the statistical constraints of the algorithmic system (i.e. areas must be large enough to occasionally meet statistical thresholds and trigger “real” predictions).
From a technical point of view, the smallest possible size of a prediction area for residential burglary is a single residential address. However, the designers exclude this size in the belief that it “does not promise much in the way of knowledge gain,” since “the statistical probability that house X will be the subject of a burglary the next day is close to zero” (Project report, January 2018). The designers thus determine the lower bound of the size by the effect that this bound would have on the volume of the predictions. The calibration work gets, however, a bit more delicate when it comes to the upper bound of the size. Depending on the task at hand, regional police agencies in Germany use different “spatial definitions,” such as “police inspectorates,” “guard districts,” or “search areas” (Project report, January 2018). During the development process, the designers were confronted by representatives of the regional police agencies with the question why none of the established spatial definitions were used for the predictions. In the view of the representatives, the use of these areas would have the advantage that the predictions could be more easily integrated into the everyday work of frontline police officers. From the designers’ point of view, there were several reasons against the various established spatial definitions. Police inspectorates and guard districts, they argued, “cover too large an area” with the result that predictions “do not provide any added value for operational police forces.” The size of search areas was evaluated by the designers as sufficiently actionable for patrol officers, but they dismissed this spatial definition as the required “digital data material” was only “selectively available” (Project report, January 2018).
In the end, the designers of POLAR chose a spatial definition that they refer to as “residential quarters.” These are areas of a city that always contain about 400 households. In densely populated inner cities, residential quarters are relatively small areas. In the sparsely populated outskirts of cities, however, residential quarters can be very large areas that include both inhabited streets and uninhabited areas such as forests and lakes (see Figure 2). By choosing residential areas, the designers of POLAR decided not to tie the predictions to a fixed uniform size, but to allow the predictions to vary greatly in size depending on the population density. The explanation as to why the designers ultimately preferred areas of fluctuating size to areas of uniform size is in turn closely linked to a second component of the spatial dimension: the contour of prediction areas.
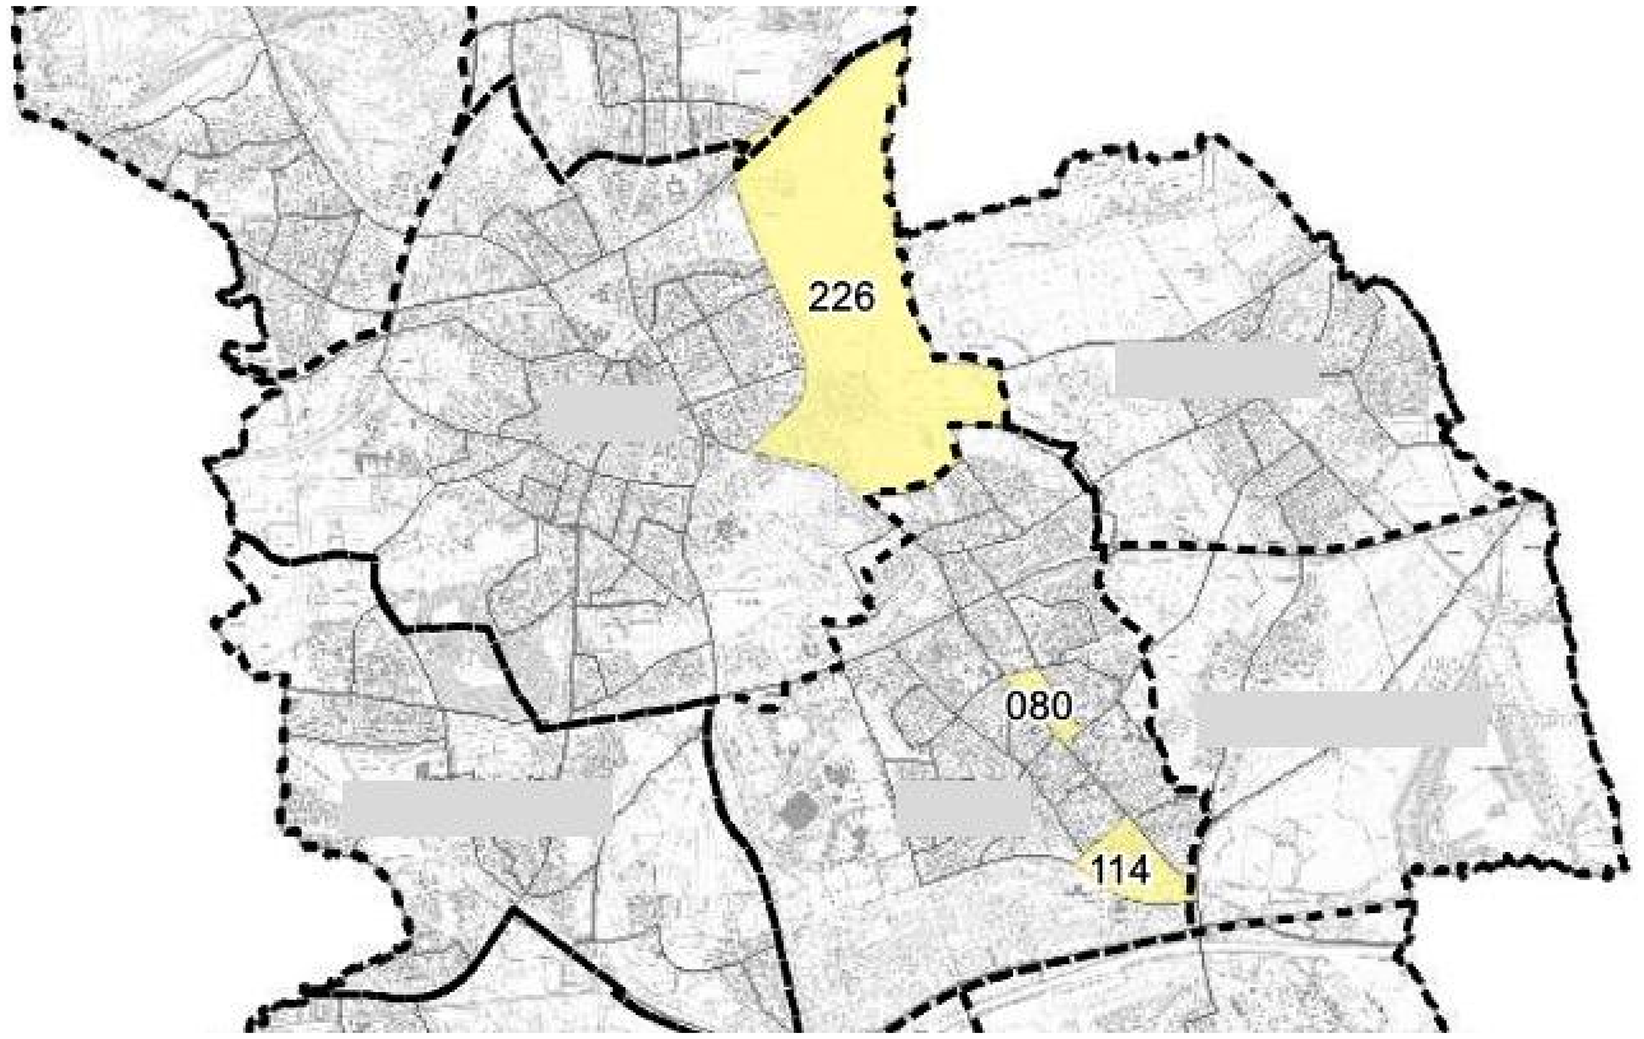
Section of a map showing the jurisdiction of a regional police agency. The map shows “residential quarters” marked as predictions (yellow) and the much larger “guard districts” (dotted line). Names of the guard districts are retracted.
Among designers and other practitioners in the field of predictive policing, there is disagreement as to which contour of a prediction area is the most actionable. This is also reflected in the fact that different commercial providers of predictive policing algorithms have opted for different contours. Some vendors claim their prediction to be valid for a circular area around a “hot spot” (e.g. the German vendor PRECOBS, see Egbert and Krasmann, 2020). Other vendors lay a grid over a city to produce uniform “boxes” as prediction areas (e.g. the US vendor PredPol/Geolitica, see Brayne, 2021). However, POLAR's staff decided against uniform circles and boxes in favor of the residential quarters described above. The residential quarters are polygons whose edges generally correspond to existing streets that can be driven or at least walked on by police officers. Since the residential quarters vary greatly in size, the polygons also vary greatly in shape.
The designers’ decision to use residential quarters with fluctuating sizes and non-uniform contours was influenced by both the availability of geospatial data and assumptions about how police officers perceive and navigate the city. On the one hand, the designers quickly realized that their available resources and the timeframe of the research project did not allow them to “hand-cut” geographic areas for the entire state (Data scientist, Interview, February 2023). They therefore decided to purchase pre-cut geographic area data from an outside vendor through a public bidding process. The residential areas in this data set corresponded to former political constituencies, but matched the designers’ assumptions about what size—or better: range of different sizes—would enable actionable predictions. On the other hand, the designers also suspected that uniform circles and boxes were at odds with how police officers perceive and navigate the city. POLAR believed it should be avoided that police officers on patrol consult the predictions but then “don’t understand why this box only covers a part of the street and half a house” (Project manager, Interview, December 2022). In contrast, the residential quarters cut along streets, according to the designers, “paint a picture of the urban structure that is very close to the actual perceptible structure” (Project report, January 2018).
In conclusion, from the designers’ point of view, calibrating the spatial dimension is an important way of making predictions as actionable as possible. On the one hand, designers try to identify a spatial unit that is neither so small that valid predictions are too rare, nor so large that police officers cannot derive actions from valid predictions. However, the calibration work not only involves the question of the correct size of the prediction area, but also the search for a contour that corresponds as closely as possible with the designers’ assumptions about how frontline police officers “see” the city.
Discussion and conclusion
Our aim was to better understand the activities through which designers of an algorithmic system attempt to make the system's outputs—predictions—actionable. Based on an ethnographic study of the development of an algorithmic crime prediction system, we showed that in addition to “technical” activities such as selecting data and training the predictive model, the designers engage in what we call calibration work. Through calibration work, designers adjust the form of statistically computed predictions so that they correspond to their assumptions about the resources and routines of their users. In our case, the designers adjusted the volume, time, and space of crime predictions according to their information and imagination about frontline police work.
We argued that a deeper understanding of the social construction of actionability in the design process would help us to explain why algorithmic predictions are often described as a form of knowledge particularly suited to inducing human action (Amoore, 2013; Büchner and Dosdall, 2021; Esposito et al., 2024; Flyverbom and Garsten, 2021), but that this expectation is often unfulfilled in the real-world application of such systems (Bader and Kaiser, 2019; Christin, 2017; Pachidi et al., 2021; Sandhu and Fussey, 2021). With this claim and our research question, we have joined an emerging line of research that is interested in connections between work on algorithmic systems and these systems’ consequences for individuals, groups, and organizations. To date, this research has been very much concerned with the “front-end” of the design process, in particular the compilation of training data sets (Orr and Crawford, 2024) and the translation of a qualitative phenomenon, such as speech, into machine learnable problems (Kang, 2023; Semel, 2022). One of the assumptions behind this line of work is that “we get the algorithms of our ground truths” (Jaton, 2021: 24), or in other words, that we get algorithmic predictions that only induce actions that are inherent in the structure of the training data.
Our study differs from this existing research, as we have focused on work at the “back-end” of the design process. We have shown that in addition to constructing training data and training the predictive model, designers also engage in calibration work that can potentially have a major impact on the extent to which predictions influence the actions of their users. Our study thus fills an important gap in the literature on the social consequences of algorithmic predictions: Calibration work might explain why predictions do not induce the desired actions, even though the “learnability” (Kang, 2023: 3) of the problem at hand has been established. For example, if an algorithmic system produces predictions with a high degree of statistical soundness (expressed through concepts like “accuracy” or “precision”), these may still fail to trigger action if presented to users in an overwhelmingly high volume. Conversely, calibration work might also explain why biases in the structure of the training data are not immediately reflected in the “final” predictions available to users. For example, if the way crime data is collected means that very specific locations (e.g. a particular high-rise building) have to be patrolled with above-average intensity (leading to an even greater production of crime data on that exact building and its tenants), calibrating predictions to slightly larger spatial areas might counteract this bias in the data sets.
The forms of calibration work that we have identified are closely linked to the empirical context of our study. The decision by the State Criminal Police Office to “make” rather than “buy” the algorithmic system has allowed us rare insights into the work of its designers. But what makes our case so revealing is also what makes it specific in several ways. First, there is reason to believe that we would see less calibration work in software companies developing predictive policing systems for sale. Although the developers of these commercial systems will also be striving to produce actionable predictions, it seems unlikely that they will be given the resources to engage with potential users to the extent as we have seen in the case of POLAR. Second, beyond the context of policing, the different types of calibration work will be of varying importance to designers of algorithmic systems, depending on the structure of the activities the systems are intended to induce. For example, we expect that similar to the POLAR staff, designers of algorithmic systems for the agricultural context calibrate the volume, time, and space of predictions, e.g. regarding areas that are at risk of pest infestation (Heimstädt and Heimstädt, 2025). Other comparable contexts include the prediction of migration flows (de Valk et al., 2022), disruptions in global supply chains (Heimstädt and Dobusch, 2021), or social unrest (Grill, 2021). In other contexts, not all three dimensions are relevant for prompting action. For example, when calibrating predictions of students’ future performance for use by school teachers, designers are likely to focus on the timing and volume of the predictions (Jarke and Macgilchrist, 2021). Although new data on all students is collected daily that could be turned into updated predictions, developers will try to anticipate what timing (e.g. weekly or monthly predictions) and volume (predictions for one, two or all students per class) are actionable for teachers.
We see a number of directions in which future research on calibration work could be fruitfully extended. First, future research should identify other forms of calibration work that did not surface in our context but may be relevant in others. For example, it seems possible that in some contexts dimensions like “urgency” or “complexity” of a prediction are interpreted as important levers for its actionability that are available for calibration. Second, future research should try to explore the relationship between the construction of actionability by designers and the interpretation of actionability by users (Egbert and Heimstädt, 2024). A challenge for this research will be to gain access to situations in which predictions provoke action, without this provocation being merely a reactive result of the observation itself—just as we experienced it when we joined one of our participants in his patrol car: “So you’re the researchers who want to see how we drive to the prediction areas? We can do that if you insist. Just buckle up.”
Footnotes
Acknowledgments
We are grateful to our research participants for their patience, time and openness. Many thanks to Klara Friese, Cornelius Heimstädt, Konstantin Hondros, Tomi Koljonen, Suna Özdemir, and three generous reviewers for helping us improve the paper. Earlier versions of this paper received insightful feedback at the Research Seminar at Weizenbaum Institute in Berlin, the EGOS Colloquium in Milan, the annual meeting of the Scientific Commission Organization (WK ORG) at Witten/Herdecke University, the STS-Hub conference in Berlin, and the PREDICT-Workshop on Actionability at Bielefeld University.
Funding
The author(s) disclosed receipt of the following financial support for the research, authorship, and/or publication of this article: This work was supported by the European Research Council (ERC) under Advanced Research Project PREDICT no. 833749.
Declaration of conflicting interests
The author(s) declared no potential conflicts of interest with respect to the research, authorship, and/or publication of this article.