
Abstract
Psychologists have long observed that people conform to majority opinion, a phenomenon sometimes referred to as the ‘bandwagon effect’. In the political domain people learn about prevailing public opinion via ubiquitous polls, which may produce a bandwagon effect. Newer types of information – published probabilities derived from prediction market contract prices and aggregated polling summaries – may have similar effects. Consequently, polls can become self-fulfilling prophecies whereby majorities, whether in support of candidates or policies, grow in a cascading manner. Despite increased attention to whether the measurement of public opinion can itself affect public opinion, the existing empirical literature is surprisingly limited on the bandwagon effects of polls. To address this gap, we conducted an experiment on a diverse national sample in which we randomly assigned people to receive information about different levels of support for three public policies. We find that public opinion as expressed through polls affects individual-level attitudes, although the size of the effect depends on issue characteristics.
Psychologists have long observed that people conform to majority opinion (see, for example, Deutsch and Gerard, 1955). This is especially possible in the domain of politics where people regularly learn the views of the majority via public opinion polling. During elections, media coverage focuses on the ‘horse race’: journalists devote substantial attention to the changes in and levels of candidate support (e.g. Brady and Johnston, 1987; Mutz, 1995). Outside of election coverage, the media often report on polls about people’s support for public policies. The bandwagon effect occurs when people change their opinions to conform to the majority, shifting their preferences in favor of the leading candidate or the most popular policy position (Simon, 1954). Bandwagon effects can make polls self-fulfilling prophecies; a poll’s prediction may come to pass not only because it measures public opinion but also because it may influence public opinion.
While polling has been a central aspect of politics for decades, innovations such as prediction markets and forecasts based on aggregated polling have led to an increased opportunity for the public to learn about collective public opinion. Many have raised concerns that by documenting public opinion, polls can change individual-level attitudes. During the 2012 US elections, many conservative commentators complained about ‘skewed’ polls and how the media was attempting to influence the electorate via polling showing Barack Obama leading Mitt Romney (Easley, 2012). Poll aggregator Nate Silver has said he may stop releasing forecasts because they could influence attitudes and hinder the democratic process (Byers, 2013). Despite increased media attention being given to the potential effects of polling on public attitudes, only a limited number of studies have explored bandwagon effects in the political domain. 1 Much of the extant data are quite dated and few studies use national samples. 2
Social psychological research suggests three principal mechanisms by which polls may induce conformity: (1) normative social influence, or people’s desire to adopt the majority position in order to feel liked and accepted or believe they are on the winning team (Deutsch and Gerard, 1955); (2) informational social influence, or people learning from the ‘wisdom of crowds’ via social proof because they ‘believe that others’ interpretation of an ambiguous situation is more accurate…and will help [them] choose an appropriate course of action’ (Aronson et al., 2005); and (3) people resolving cognitive dissonance by switching to the side they infer is going to win based on the poll (Kay et al., 2002; Laurin et al., 2012). The bandwagon effect, a form of conformity, is the mirror image of the false consensus effect, where people misperceive that their own behaviors and attitudes are more popular than they actually are (Ross, 1977). In the political domain, one mechanism underlying the false consensus effect is wishful thinking – people gaining utility from thinking their candidate is ahead or their opinions are popular (Granberg and Brent, 1983). Observational data cannot disentangle the bandwagon effect from these other phenomena because of simultaneity. An experimental approach is therefore required.
We designed and conducted an experiment to assess whether polls affect public opinion on public policy issues. In addition to providing timely evidence on a topic that has received substantial attention, this research is innovative in several respects. First, we make use of a national, diverse sample, allowing us to reach more externally valid conclusions than the majority of research on the topic, which has relied on local, convenience samples. Second, our treatments cover the entire spectrum of support, allowing us to test both dose and response. Administering a broad range of public support levels is important given that people may have heterogeneous priors in their perceptions of public opinion. Third, while nearly all studies of bandwagon effects have examined electoral contests, we explore the effects of polling and predictions on public policy attitudes (see Marsh, 1985 for an exception).
We focus on preferences towards public policies because the role of polling in opinion cascades may help us understand how previously unpopular issues have increased in popularity (e.g. gay marriage: Pew, 2012a) while previously popular issues have decreased in popularity (e.g. capital punishment: Pew, 2012b). For instance, support for gay marriage has increased from 37% to 58% in less than ten years, a change that cannot be explained solely by cohort replacement (Langer, 2013). Perhaps some of this increase in support is the result of bandwagon effects. Nonetheless, our findings speak to the literature on how voters incorporate information from sequential elections such as presidential primaries (e.g. Callander, 2007; Bartels, 1988; Morton and Williams, 2001) or from early pre-election polling (e.g. Sinclair and Plott, 2012; Rickershauser and Aldrich, 2007).
We find evidence of a bandwagon effect of polls: people are generally more supportive of policies that have higher general public support. The effect, however, is issue dependent: it is largest for issues that cut across partisan lines and for issues about which people do not have strong preexisting attitudes.
Experimental design
Overview
We provide a general overview of the experimental design before discussing how we measured outcomes and administered treatments. We measured support for three policies prior to presenting any treatment information. We then asked some filler questions in order to separate the presentation of the treatment information and the initial pre-treatment measurement; this protects against both consistency bias and stickiness of pre- and post-treatment responses. 3 Conducing two different surveys and separating the measurement of the pre- and post-treatment responses temporally could have further reduced stickiness, but may also have introduced bias due to non-random attrition across surveys (Gerber and Green, 2012). Respondents were randomly assigned to a continuous variable representing the level of support for the target issue based on an average of polls. We then measured support for the target policy again immediately after the treatment was administered.
Data
Data were collected as part of the 2011 Cooperative Congressional Election Study (CCES). 4 Interviews were conducted using an opt-in sample of 234 respondents over the Internet by YouGov/Polimetrix between 9 November 2011, and 2 January 2012. While there are concerns that respondents of opt-in Internet surveys are more politically interested, YouGov/Polimetrix has developed sampling techniques to mitigate these concerns. Randomization was successful (see Appendix 1).
Dependent variable
We asked respondents to report their level of support for three different policy proposals: reducing troop levels in Afghanistan, free trade agreements, and public financing of elections. Specifically, we asked respondents to report the probability that they would vote for the policy in a national referendum. We chose topics that covered three different aspects of American politics – foreign policy, economic policy and election administration. 5 The three issues were presented in a random order to respondents. Question wordings for the three issues are presented in Appendix 2. All three policies indicate a change from the status quo, and our dependent variable is best described as ‘support for policy change’. For simplicity of exposition we refer to it as ‘policy support’ throughout. Because the survey solicited responses for the dependent variable both pre-treatment and post-treatment, we can control for pre-treatment attitudes to assess how much the treatments change policy support relative to the baseline of initial support.
Because the dependent variable is a probability, it ranges from 0 to 100. We employed this measurement strategy for both substantive and methodological reasons. Substantively, the measure is intended to tap not only attitudes but also have a behavioral element (i.e. a vote intention). Methodologically, using a finely grained scale increases the opportunity for the experimental treatments to shift opinions. We conducted a follow-up study that demonstrates our measurement strategy taps attitudes similar to a Likert scale. 6 The pre- and post-treatment questions are exactly the same, but we use a slightly different graphical interface pre- and post-treatment. 7 Distributions of pre- and post-treatment policy support are illustrated in Figure 1. The change in support is normally distributed with low density in the tails, suggesting that a few respondents dramatically shifting their positions do not drive the results.

Distributions of pre- and post-treatment policy support.
Treatments
For all three policy issues, respondents randomly received a value ranging from 20 and 80 (inclusive) in increments of five representing the level of public support for the policy. We refer to this value as the treatment value. The treatment values for the three issues were presented in a randomized order. To enhance realism, the three treatment values were different for each of the three issues (i.e. for each issue, the treatment value was randomly drawn from one of the 13 possible values without replacement). At the end of the experiment, respondents were debriefed about the true levels based on current data.
Respondents read descriptions of the following form:
Below is the percentage of Americans who support [a meaningful reduction
in US troops in Afghanistan by June 30, 2012/more free trade agreements
with North, Central, and South American countries/public financing of
elections]. This value is created by aggregating the best
available polls.
We did not include a pure control group because the comparative static we are interested in testing is how individual policy support changes as the treatment value changes. The relevant baseline is not the absence of public opinion information. Further, the pre-treatment measures of the dependent variable can be used to assess policy support in the absence of any polls.
Estimation strategy
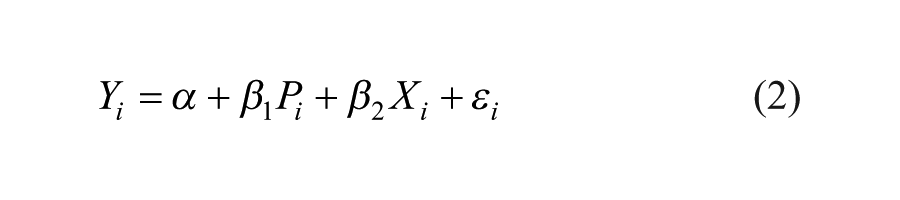
To test whether polling affects individual-level policy attitudes, we estimate the following random effects regression model via OLS, pooling responses from all three issues together:

where i indexes respondents, j indexes issues, Yij represents support for issue j measured post-treatment for each respondent, Pij represents support for policy j measured pre-treatment for each respondent, Xij represents the randomized treatment value for the issues, αj represents issue dummies where free trade is the omitted category, γi is a random coefficient for each respondent assumed to come from a Gaussian distribution, and ϵij represents stochastic error. Standard errors are clustered by respondent. We recode the treatment value to lie between 0 and 1. The coefficient of interest from model (1) is β2, which represents the effect of increasing the treatment value from the lowest value (20) to the highest value (80) on individual-level policy support in percentage points terms. For robustness, we also estimate a version of model (1) including respondent fixed effects.
We estimate model (1) pooling all three issues together to maximize efficiency and statistical power. Additionally, given that we asked about a diverse set of issues across various domains, the pooled estimates can be thought of as a meta-analysis of the results from the individual issues.
We also estimate simple OLS regression models for each issue j separately:
Results
We present estimates of model (1) in the first column of Table 1. The relationship between the treatment value and individual-level policy support is positive and statistically significant. The coefficient estimate of β2 is 8.11 (p < 0.001, two-tailed), indicating that an increase in public support for a policy from 20% to 80% is associated with an approximately 8 percentage point increase in individual-level support. 8 As shown in column 5 of Table 1, we obtained similar results from a model including fixed effects for respondents (β2 = 8.55, p = 0.001).
The effect of polling information on individual-level policy support.

p < 0.05 (two-tailed).
Notes: Columns (1) and (5) present estimates from model (1). Random effects model in columns (1) and (6). Fixed effect model in column (5). Columns (2)–(4) present OLS estimates from model (2). Standard errors in parentheses. Standard errors clustered by respondent in columns (1), (5), and (6). The treatment value is recoded to lie between 0 (20% public support) and 1 (80% public support).
How substantively important is this effect size of 8 percentage points? The average standard deviation of pre-treatment policy support is 32.5; thus, the treatment effect represents 25% of the variability in the pre-treatment measure. Of course, general support for public policies usually does not change by 60 percentage points over short periods of time. Smaller movements of public support still have meaningful impact; for example, a 20 percentage point shift in public support corresponds to an approximately 2.7 percentage point increase in individual-level support.
One should not interpret the effect size to mean that every respondent would shift their support by 8 percentage points. Respondents with weaker pre-treatment attitudes and diffuse priors about public support were likely most influenced by the polling information. Hence, the treatment effect may indicate how these people responded to observing extreme values of public support and opposition in the absence of information a priori. In column 6 of Table 1 we include a variable representing the absolute value of the distance of pre-treatment support from 50 (as well as its interaction with the treatment value). Larger values of this variable indicate respondents with more extreme pre-treatment attitudes. The interaction term is negative and statistically significant (p < 0.001), indicating that respondents with strong attitudes were least influenced by the polling information.
Another explanation for the seemingly large treatment effects is that people had heterogeneous priors. We did not measure prior perceptions of public support for the policies because we were concerned that this would prime respondents and blunt the effects of the treatment information. However, in a follow-up study we asked people to report the percentage of the general population they thought supported each of three issues. 9 The standard deviation of perceived support levels averages 19 percentage points over the three issues. With such wide variation in perceived public support, the treatment value could be meaningfully different from a person’s perceived support level.
Columns 2–4 of Table 1 present estimates from model (2) for each of the three issues separately. The effect sizes are consistently positive. However, the effects are significant for only one of the three issues: free trade. With respect to effect size, a movement from 20% to 80% public support causes a 13.5 percentage point increase in individual-level support for the free trade issue, compared to smaller 6.3 and 3.5 percentage point increases in individual-level support for the Afghanistan and public financing issues, respectively. This suggests that the bandwagon effect may not be universally powerful, but rather dependent on issue characteristics.
Why did we observe the strongest effect for the free trade issue? We offer three possible explanations. Although far from definitive, these conjectures lay groundwork for future research.
First, free trade is a cross-cutting issue that does not fall neatly along party lines. Among political elites, Bill Clinton and George W. Bush were strong proponents of free trade while Dick Gephardt and Pat Buchanan were opponents. In the absence of partisan predispositions, people may have more malleable attitudes with respect to free trade compared to the other two issues. We estimated bivariate regressions predicting individual-level support with party identification. Party identification is strongly correlated with individual-level support for the both Afghanistan and public financing issues; moving across the party identification scale from strong Republican to strong Democrat is associated with increases in the dependent variable of 26 and 20 percentage points for the two issues, respectively. In contrast, the relationship between party identification and support for increased free trade is both statistically insignificant and substantively small (4 percentage points).
Second, people were likely to be more ambivalent or more uninformed on the issue of free trade. 20% of respondents reported pre-treatment support of 49, 50, or 51 for the free trade issue. The comparable percentages for the Afghanistan and public financing issues were 14% and 15%, respectively. This is illustrated in rows 2–4 of Figure 1. Pre-treatment support bunches towards 100% for Afghanistan while pre-treatment support bunches towards 0% for public financing; pre-treatment support for free trade is dominated by responses near 50%.
Third, people were unsure of existing public opinion on the free trade issue, meaning that the treatment had more of an opportunity to have an effect. As shown in Online Appendix 2, people were more confident that removing troops from Afghanistan was popular (median perceived support: 71%) and that public financing was unpopular (35%). However, median perceived support for free trade was exactly 50%, suggesting that respondents were unsure. Further, the percentage of respondents selecting exactly 50 was higher for the free trade issue (14%) than for the Afghanistan (2%) and public financing issues (9%). In sum, showing people information about public opinion on free trade caused people to shift their opinions in the direction of the majority view. We found weaker effects for other issues, perhaps because respondents’ predispositions and priors were stronger in these domains.
Conclusion
This paper shows that polls, by directly influencing individual-level support for policies, can be self-fulfilling prophecies and produce opinion cascades. That conformity pressures can suppress minority opinion might seem disheartening for those who value highly normative conceptions of democracy (Noelle-Neumann, 1974). However, the effects that we do find are not strongly present for all issues. Rather, we observe the bandwagon effect for issues where people seem to have the weakest pre-treatment attitudes, the most uninformative priors of perceived public opinion, and for which their attitudes are not hardened by partisan predispositions.
Thus, making use of a diverse, national sample, we have found some evidence that bandwagon effects can produce opinion cascades, but the phenomenon appears to be highly issue dependent. The design we utilize in this paper can be extended to address other substantive questions as well. Although we did include some filler questions, it remains an open question whether the effects of the treatment would be sustained across a longer time period. Our experimental design also only treated people once, while in the real world people are exposed to polling information multiple times. In addition, while we only present a single poll, future research could explore how competing (and contradictory) sources influence opinion formation. Our treatment stimuli consisted of information about standard polls, but the effects of new data sources, such as prediction market contract prices, could be examined as well. Finally, our dependent variable of interest in this study was policy attitudes; it would be interesting to see if the effect of polling extends to candidate choice in the context of elections. Of course, in the context of a real election, people are often exposed to polling information in political campaigns, thereby introducing pre-treatment bias and making it difficult to conduct a controlled experimental test for polling effects. However, researchers could potentially explore low-information contests where pre-treatment information is not ubiquitous. Additionally, cues such as party identification likely swamp majority opinion in candidate choice. Consequently, primary elections are perhaps the most fruitful domain of future study, given that party identification is not an obvious cue voters can use to make decisions in these elections.
Footnotes
Appendix 1: Randomization checks
Table 1 in Appendix 1 shows that there was no relationship between the treatment value and pre-treatment demographic characteristics, determined by estimating regressions predicting treatment value with demographic characteristics (gender, race, education, age). To ensure flexibility in the regression specification, we included indicator variables representing each level of the demographic controls. The F-statistics of the regressions (i.e. the joint null hypothesis tests that all the coefficients are equal to zero) are all statistically insignificant.
Appendix 2: Full question wordings and treatment information
Appendix 3: Graphical Presentations
Declaration of conflicting interest
The authors declare that there are no conflicts of interest.
Funding
This research received no specific grant from any funding agency in the public, commercial, or not-for-profit sectors.
Supplementary material
The Online Appendices 1
and 2 are available at:
![]()