
Abstract
Do politicians demand change if party support is slipping in opinion polls? If so, should a party change its program or just the way it communicates with voters? To investigate this, we conducted a survey experiment with 1236 Swedish politicians. We exposed them to a frame in which their party was losing in the polls, or a frame in which their party was gaining in the polls without using deception. Our results demonstrate that losing politicians seek change, both in terms of program and communication. However, the effects of the most recent polls are typically stronger than our experimental treatment. Along those lines we also find that politicians who are losing in recent polls, but not in our experimental treatment, favor ideological radicalization more than moderation or staying put. With these results our study paper speaks to the discussion on how representation is achieved and whether opinion polls are good or bad for democracy.
Introduction
At least every week, opinion polls are reported that show election results if elections were held that week. The media often interpret shifts in these opinion polls as substantive preference shifts of the electorate, even when these shifts are tiny and statistically insignificant (Larsen and Fazekas, 2020). These media reports in turn influence voters, particularly when emphasis is placed on which party is winning and which is losing (Ansolabehere and Iyengar, 1994; Dahlgaard et al., 2017; Van der Meer et al., 2016). What is the effect of these opinion polls on politicians? Do discouraging signs of the party’s future electoral prospects motivate politicians to change the party’s policies and strategies (Hartman et al., 2017)? And do promising signs of future electoral prospects lead to inaction? This article presents a survey experiment with politicians that evaluates these questions. In particular, we randomly exposed politicians to frames in which their party was gaining or losing votes, and asked about their satisfaction with the party, and whether the party should change its policy and strategy, as well as the direction in which they think their party should move.
Following Erikson et al. (2002), we assume that politicians rationally anticipate electoral losses or gains, and may therefore adapt their position or strategy prior to elections. Opinion polls may feed these expectations of the politician’s or party’s electoral prospects. And indeed, there are plenty of examples of parties shifting their stance in response to opinion polls (Geer, 1996). However, according to our knowledge, no one has systematically established a direct effect of opinion polling on politicians’ strategies and positions. This is important to know because opinion polls may have real and potentially negative consequences for the quality of representation.
To investigate this, we hypothesize that politicians respond to opinion polls, particularly if they contain bad news for them. That is, when opinion polls suggest electoral losses, politicians are more motivated to act (H1).
H1: Politicians facing electoral losses are more likely to desire change in the party’s strategy and policy positions than politicians facing electoral gains.
This may not be surprising: if politicians risk losing votes, they risk losing prestige, their parliamentary seat and influence on policy. Therefore, they are motivated to act. But if politicians want change, in what ideological direction do they think the party should move? A recent observational study reports that if parties underperform in elections, politicians are generally more likely to advocate radicalization of their party’s position (Schumacher and Elmelund-Præstekær, 2018: 343). Put differently, left-wing (right-wing) politicians are more likely to advocate a more radical left-wing (right-wing) agenda if their party underperforms, and more likely to advoce a more moderate agenda if their party performs in elections as expected. We explore whether politicians facing electoral losses are also more likely to choose radicalization of the party’s policy over moderation and the status quo.
We connect these preferences for radicalization and moderation to public opinion shifts. The literature has some mixed findings, with some studies reporting that parties respond to ideological shifts in the general public (Adams et al., 2004; Adams et al., 2008) while others report that parties respond to ideological shifts in specific sub-constituencies (Ezrow et al., 2011; Lehrer, 2012; Schumacher et al., 2013). But how do parties learn about these ideological shifts? Parties typically do not have direct information on this. Polls may indirectly inform them of these ideological shifts. For example, increasing support for radical right parties in opinion polls may be interpreted as a rightward shift in public opinion. This was exactly the context in Sweden at the time of data collection. The radical-right Sweden Democrats were polling around 20% of the vote, whereas they only held 12% of the vote in the last election. As such, this can be interpreted as a rightward shift in the Swedish population. Do politicians follow this shift by suggesting that their party should move to the right? And is this effect stronger when they are exposed to the losses frame compared to the gains frame?
Data and methods
Sample
Our survey experiment was embedded in the Panel of Politicians. This is an online university-based panel consisting of local-, regional- and national-level politicians in Sweden (Butler et al., 2017; Öhberg and Naurin, 2016). The Laboratory of Opinion Research (LORE) at the University of Gothenburg carried out the survey. The Panel of Politicians has recruited respondents via email addresses found on local, regional and national parliament websites as well as via surveys of politicians where at the end of the survey the respondents are requested to sign up for the panel. Panelists are also regularly asked to recommend other colleagues to participate in the panel. With 1236 survey participants we had a response rate of 41%. Our sample is representative of party affiliation except for the Sweden Democrats, whose participation in the panel is systematically lower than average (see Online Appendix Table A1).
The Swedish electoral system is highly proportional. At the time of data collection, the Social Democrats formed a government with the Green Party. To the far left of this government stands ‘The Left’; on the right side are the Centre Party, the Liberals, the Moderates; and on the far right the Sweden Democrats.
Experimental design
Participants were randomly exposed to the losses frame or to the gains frame. 1 We understand losses here as performance below a certain reference point or aspiration level (Bendor, 2010; Kahneman and Tversky, 1979; Linde and Vis, 2017; Schumacher et al., 2015). The frames contain a current poll share and a historical poll share that serves as a reference point. To add to the realism of the experiment, no deception was used. The current poll share in the frames is the real poll share according to the latest polls provided by Statistics Sweden (June 2016). Statistics Sweden is the bureau responsible for government statistics and as such it is a highly prestigious source of information. The current poll share in the gains and losses frame is the same. The reference point, however, is manipulated. We took historical poll shares substantially below (gains frame) or above (losses frame) the current poll share. This means that per party and per experimental condition, the time frame between the reference point and the current polls differs. For the Moderate Party we had to go back to May 2013 to find a reference poll substantially higher than the current poll share. In all other cases, historical poll shares date back at most two years. 2 Because there are differences within our treatments, we also evaluate whether these differences affect our findings.
Below we present the exact (translated) wording of the losses frame and the gains frame. The first number is the current poll share and the second the reference poll. Online Appendix Table A2 provides an overview of which numbers were used per party and per treatment (for full text also see Online Appendix A):
After receiving the treatment, we first have a manipulation check in which we asked participants to indicate their dissatisfaction with the polls (5-point scale, very satisfied to very dissatisfied). To test H1 we then asked whether they supported change in party policy (3-point scale, much change to no change) and change in the way the party communicates with its voters (5-point scale, from no change to radical change). To explore the direction of the change we also asked whether they supported change in the party’s left–right position (5-point scale, much more to the left to much more to the right). We transformed the left–right question, so that shifting to the left is coded as radicalization for left-wing parties and as moderation for right-wing parties and that shifting to the right is coded as moderation for left-wing parties, and radicalization for right-wing parties. If they answered ‘stay the same’ we coded this as a preference for the status quo. Online Appendix B provides the full list of questions; Online Appendix C, Figure C1 provides descriptive stats.
In the remainder, we tackle three specific questions: are losing politicians more dissatisfied (manipulation check); do losing politicians want to change the party’s policy (hypothesis 1); should the party radicalize or moderate? Per section, we explain how we used each dependent variable, what independent variables were used and the specific estimation technique.
Manipulation check: are losing politicians more dissatisfied?
To check our manipulation, we first asked participants to report their level of dissatisfaction with the party’s performance. As expected, participants in the losses treatment reported significantly higher levels of dissatisfaction than participants in the gains treatment (µgains = 2.85, µlosses = 3.352, Welch two-sample t-test with µdiff = 0.502, t = 8.567). Specifically, politicians in the gains frame are on average somewhat in between satisfied and dissatisfied about the party’s performance. Politicians in the losses frame, however, are between ‘neither satisfied nor dissatisfied’ and ‘dissatisfied’.
But do these differences hold once we control for differences in the gains and losses treatments the politicians received? To evaluate this we ran an ordinary least squares (OLS) regression model with dissatisfaction as dependent variable, and (a) the treatment, (b) the number of months between the manipulated reference point and the current poll share in the treatment and (c) a dummy variable indicating whether the party of the politician is currently gaining in the polls or losing in the polls (see Online Appendix Table C1 for full regression results). We control for this last variable because the timing of the reference points for parties used in the treatments differs. These reference points differ because we did not want to lie to the participants and therefore used actual historical poll shares. But this also affects the urgency of the treatments. Two-year old reference points may not have the same effect as more recent reference points. In particular, the Social Democrats, the Green Party and the Liberal Party were consistently losing in the polls at the time of experiment (see Figure A1 for trends in opinion polls). This contributed to the predicted levels of dissatisfaction with the party. For that reason we distinguish here and in the following analyses between 4 conditions (2 experimental treatments (losses frame and gain frame) x 2 results in recent polls (gaining in recent polls vs losing in recent polls)).
We find that:
Politicians in the gains frame report significantly lower dissatisfaction than politician in the losses frame (b = -0.610, standard error (SE) = 0.055).
Dissatisfaction is about .5 point lower if the reference point is recent (1 point) than if the reference point is approximately 2 years ago (3rd quartile of variable distribution).
Politicians in parties that are recently losing in the polls are more dissatisfied than politicians who are gaining (b = 0.948, SE = 0.055). Online Appendix C1 contains the full regression results.
Figure 1 reports the predicted levels of dissatisfaction from the OLS regression for each combination of experimental treatment and recent poll result. Politicians who received the gains frame and who represent a party that is recently winning in the polls are predicted to be almost ‘satisfied’ (bar on the far left). Politicians who received the losses frame, and who represent a party that is also losing in recent polls are predicted to be ‘dissatisfied’ (bar on the far right). The two bars in the middle present the mixed cases in which the experimental treatment did not align with recent polls.
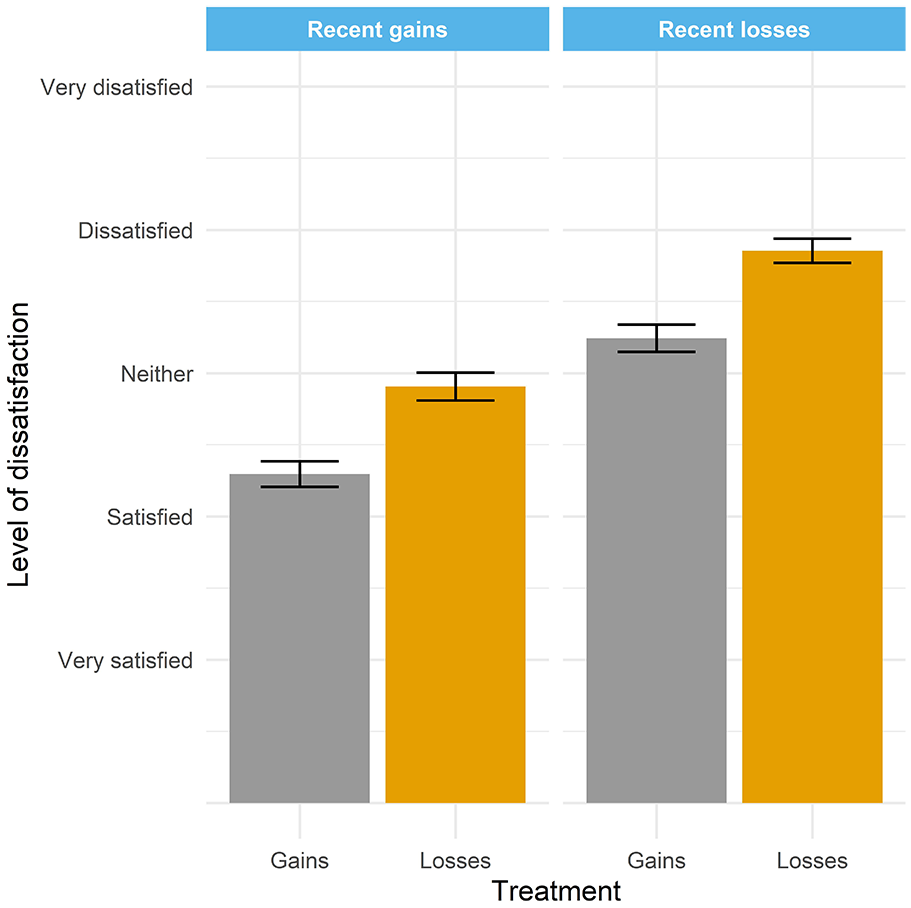
Politicians’ dissatisfaction with polls.
H1: Do losing politicians want to change the party’s policy?
We ran an ordered logistic regression model with the change policy question as dependent variable. The estimated probabilities predict stick to policy as opposed to change policy (mildly or dramatically). The treatment, a dummy variable indicating whether the party of the politician is currently gaining in the polls or losing in the polls, the gender, age and party attachment of the politician are used as independent variables. The first two and last variables are significant. Politicians who feel attached are typically more reluctant to change (b = 1.282, SE = 0.135). Gender and age have no effect. The full regression results are reported in Online Appendix Table C2.
Figure 2 reports regression predictions of participants choosing to stick to the party policy. Generally, the participants prefer parties to change their policy; only 21.1% choose for no change in policy. That said, there is a statistically significant difference between participants in the gains treatment and those in the losses treatment (b = -.218, SE = 0.120). Also, again, the real, recent performance of the party in the polls explains the outcome (b = 0.415, SE = 0.122). Therefore, Figure 2 reports predicted probabilities for the combination of these variables. The main conclusion here is that participants were most likely to advocate the status quo if they were in the gains frame and when the party enjoyed gains in recent polls. The participants were least likely to support the policy status quo if they were treated with losses, and when their party experienced losses in recent polls. There is not much difference between the two in-between categories (losses frame plus real poll gains and gains frame plus real poll losses).
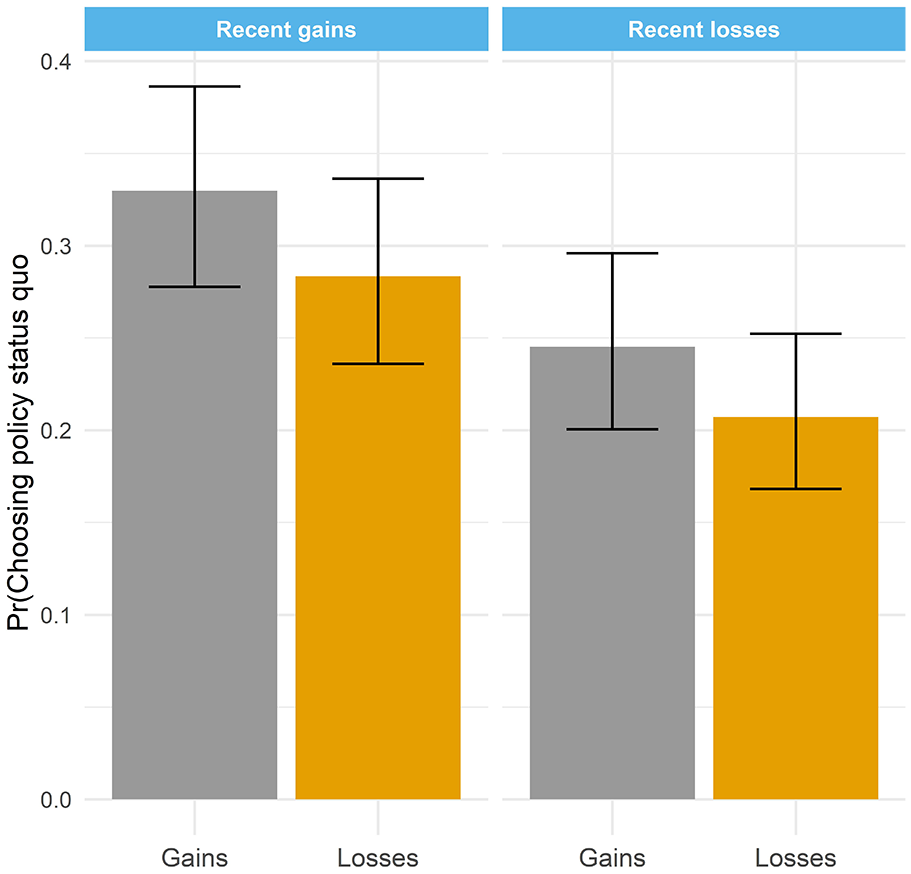
Probabilities that participants choose status quo in different gains and losses situations.
We also asked the participants whether they want to change the party’s strategy (as opposed to substantive policy). Surprisingly, the correlation between the question about willingness to change party policy and willingness to change party strategy is quite low (Spearman’s Rho = 0.29). However, the regression results are qualitatively similar (see Online Appendix Table C2, model 2). Both recent losses and exposure to the losses frame lead to stronger support for changing party strategy.
Should the party radicalize or moderate?
We ran a multinomial regression model predicting whether politicians advocated moderation, radicalization or the status quo. Again, we combine the treatment and real losses or gains in the polls, and control for gender, age and party attachment. Here, the treatment effect is insignificant (for Pr(Moderation), b = -0.062, SE = 0.204; for Pr(Radicalization), b= -0.077, SE = 0.127). However, recent losses in opinion polls do predict the difference between choosing moderation and choosing the status quo (for Pr(Moderation), b = -0.512, SE = 0.208; for Pr(Radicalization), b = .436, SE = 0.128). Figure 3 plots the results of these probabilities. Politicians of parties that gain in the polls are equally likely to choose radicalization or the status quo. Few politicians chose moderation. Politicians of parties that gain in the polls are much more likely to choose radicalization over the status quo. Also, here the option of moderation becomes more popular. Compared to politicians of parties that gain in the polls, politicians who lose in the polls are both more likely to advocate moderation and radicalization compared to staying put. This is in line with cross-national survey evidence (Schumacher and Elmelund-Præstekær, 2018).
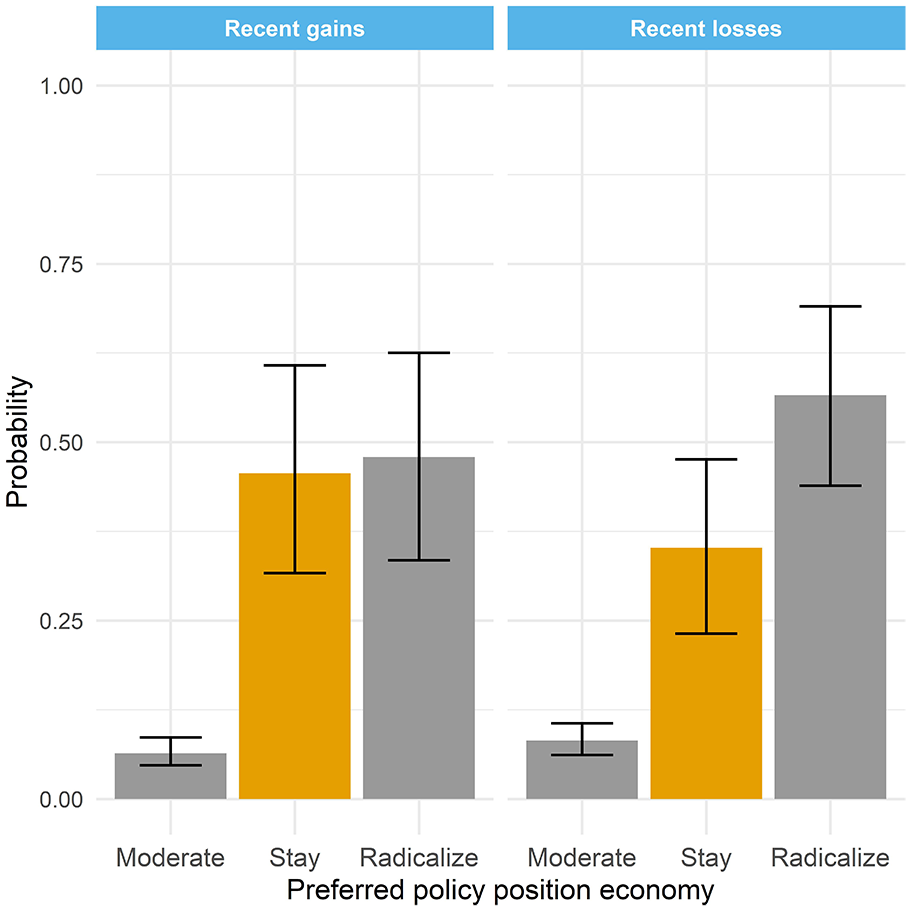
Probability of choosing preferred policy position economy with recent gains or losses in the polls.
If we break this result down per party the results are remarkably similar: politicians from the left-wing parties (the Greens, the Left Party and the Social Democrats) are strongly in favor of shifting more to the left. Politicians from the Moderate Party advocate shifting to the right. Responses from politicians from the other right-wing parties are more mixed: choosing more often to shift to the left. These tendencies are remarkable, especially when contrasted with the trends in opinion polling at the time in Sweden (see Figure A1). The Sweden Democrats were consistently predicted to win about 1.5 times more votes, whereas the Social Democrats and the Green Party were consistently predicted to lose. The Moderate Party stabilized its position, after initial predicted losses. Only the Centre Party and the Left Party were predicted to experience marginal wins. In all, Swedish public opinion was shifting to the right in this period. The politicians from the Moderate Party seem to surf that wave, by opting for shifting more to the right. The politicians from the Social Democrats, however, do quite the opposite: they are moving away from the public opinion trend. One possibility is that they are shifting with Social Democratic voters, who are also radicalizing. Unfortunately, there is no data to evaluate this.
Discussion
The results demonstrate that politicians who face losses are more dissatisfied and more likely to advocate change in the party’s strategy and policy than politicians who face gains. On average politicians want their party to radicalize, more so if their party faces losses. We end with two questions: what is the relevance of these findings for democracy? And what do the findings contribute to our understanding of how representation of public opinion operates?
First, these findings can be seen as good news and bad news for democracy. On the positive side, politicians are responsive to losses. Opinion polls may signal to politicians that their parties are out of sync with public opinion. If politicians correct this, representation improves. However, as signaled in the introduction, changes in poll shares are very often statistically insignificant, but interpreted as real (Larsen and Fazekas, 2020). By consequence, politicians may be responding to the noise in the polls, rather than the signal. This is obviously bad news for democracy. Worse, parties may create a self-fulfilling prophecy when they change policy because of statistically insignificant poll losses and voters subsequently punish them for adopting an unpopular position. We show that politicians want to change policy even after a minor experimental treatment. Therefore, media and politicians should be extremely cautious in using polls to motivate policy changes.
Second, this paper is theoretically relevant because it shows the relevance of opinion polls in explaining party position change. This contrasts with the bulk of the literature that uses public opinion data to explain party position change. Also, we show that politicians on average prefer radicalization. But this is not the modal finding in the literature: if parties follow public opinion, then left-wing and right politicians cannot radicalize at the same time. One implication of our study is that parties that face losses will radicalize. Expected losses can thereby contribute to elite polarization and more divided societies. This has been assumed in other studies too (Bawn and Somer-Topcu, 2012; Schumacher et al., 2015), but still needs to be further empirically validated.
Does this implication also apply to non-proportional representation (PR) systems? It might be. The question is how much at risk of losing prestige, a seat and influence are politicians? In first-past-the-post systems this risk is rather unevenly distributed between politicians in safe districts and politicians in competitive districts. Yet, from the electoral campaign literature in the USA we know that incumbents and challengers change their tactics depending on what opinion polls indicate about the competitiveness of the race (Druckman et al., 2009) and that challengers are willing to take more extreme policy positions to win an election (Stone and Simas, 2010). From this perspective, policy positions and opinion polls seem to be related to each other also in more candidate-centered systems.
Supplemental Material
Appendix – Supplemental material for How do politicians respond to opinion polls? An experiment with Swedish politicians
Supplemental material, Appendix for How do politicians respond to opinion polls? An experiment with Swedish politicians by Gijs Schumacher and Patrik Öhberg in Research & Politics
Footnotes
Declaration of conflicting interests
The author(s) declared no potential conflicts of interest with respect to the research, authorship and/or publication of this article.
Funding
The author(s) received no financial support for the research, authorship and/or publication of this article.
Supplemental materials
The replication files are available at https://dataverse.harvard.edu/dataset.xhtml?persistentId=doi%3A10.7910%2FDVN%2FENEHLE&version=DRAFT
Notes
Carnegie Corporation of New York Grant
This publication was made possible (in part) by a grant from theCarnegie Corporation of New York. The statements made andviews expressed are solely the responsibility of the author.
References
Supplementary Material
Please find the following supplemental material available below.
For Open Access articles published under a Creative Commons License, all supplemental material carries the same license as the article it is associated with.
For non-Open Access articles published, all supplemental material carries a non-exclusive license, and permission requests for re-use of supplemental material or any part of supplemental material shall be sent directly to the copyright owner as specified in the copyright notice associated with the article.