
Abstract
In the Anthropocene, humanity faces many questions related to the harmful effects of many substances on their health and the environment around them. One such mineral that had many uses, useful in human daily life, but which ultimately turned out to have a detrimental effect on human health and the environment, is asbestos. Due to the progressive urbanization of the world, asbestos has been widely used in the economies of many countries. Its’ unique physical and chemical properties were used, inter alia, for the production of asbestos-cement roofs. The only data available used by researchers and provided by USGS are on asbestos fiber production, which will not enable us to assess the health and environmental risk. It is estimated that over 90% of asbestos-containing products still in use are asbestos roofs. Quantity information is missing so other methods are being sought to estimate the amount and spatial distribution of these roofs to safely eliminate them from use since the environmental pollution with asbestos fibers poses a threat to humans and the natural environment. The purpose of the study is to present methods for estimating the number of asbestos-cement roofs to assess the environmental risk of air pollution on a national scale and to present methods for the recognition of asbestos-cement roofs using various classification algorithms and image data. These algorithms can be successfully used in other countries to determine the amount of asbestos-cement roofs to be safely disposed of and take the necessary actions.
Introduction
A new epoch has begun in the history of the Earth. The Anthropocene is the age of man. It is dominated by human activities (Zalasiewicz et al., 2014). Currently, human activity is so intense, and its effects so extensive that speaking about the shape of our planet, it is impossible to ignore the influence of people. Humankind is facing the problem of mitigating all side effects of anthropogenic changes in the natural environment, such as air pollution, which may be beyond our ability to cope with unfavorable changes initiated by man. For example, the rates of asbestos-related diseases have been increasing in recent decades, and despite health experts’ continuous warnings, the problem is not still treated with due attention by the political agenda. The long-term environmental indicators used in debates of the Anthropocene refer to the environmental pressure as a result of production that takes place within a specific area, without considering where the final consumption took place (Brolin and Kander, 2022). We dealt with this kind of management in the case of asbestos.
Asbestos is the general name for hydrated ferro-magnesium aluminum silicates that occur naturally. These are chrysotile and amphibole asbestos. Chrysotiles are characterized by high elasticity, relatively short fibers, prone to weaving, resistance to high temperature and abrasion, low thermal and electrical conductivity, as well as poor chemical resistance. Amphiboles are resistant to acids and alkalines, but unlike chrysotile asbestos, they are weakly elastic, less prone to weaving, and sensitive to high temperatures (Ross et al., 2008). The development of a method to strengthen cement products with asbestos fibers initiated the use of asbestos on an industrial scale (Hendry, 1965). The world production peak falls in the 1960s and 1970s when asbestos was used in the industry in over 3000 products (Virta, 2006). More than 90% of world production was chrysotile, used mainly in the asbestos-cement industry for the production of roofing and pipes, but also as a component of other products such as textiles, wires, insulation, friction materials, yarns, paper, household articles, and many others (Frank and Joshi, 2014). The production of asbestos-containing products began in Poland in 1907 at the Krakow Eternit Plant. Twenty-eight plants operated at the peak of production, and the largest recipient of asbestos fibers in Poland was the construction industry, which used over 80% of the total weight of imported asbestos (Wilk et al., 2014).
The first mentions of the pathogenic effect of asbestos appeared in the 1930s (Murray, 1990). In 1976, the International Agency for Research on Cancer (IARC) designated asbestos as carcinogenic (IARC, 1977). The recommendations of the World Health Organization issued in cooperation with the International Labor Organization (ILO) state that it is necessary to develop the National Asbestos Profile, specifying, inter alia, the amount of asbestos and used asbestos-containing products in individual countries (WHO & ILO, 2014) as factors important for the implementation of the process of determining the number of products used for their removal from the environment, places of their storage safe for human health and the environment, and costs estimation. According to International Ban Asbestos Secretariat, 67 countries around the world have introduced a ban on the use of asbestos in response to the recommendations of international organizations, including 34 European countries (IBAS, 2022). However, on a national scale, there is no comprehensive approach to estimating the amount of asbestos-cement roofs used. There are attempts around the world to estimate the amount of asbestos-cement products used based on the consumption rates of asbestos fibers in production. The data on asbestos, compiled by the American Geological Survey (USGS), are most often used in published research results (Virta, 2006).
In Poland, in 1997, a statutory ban on the production, use, and economic circulation of asbestos-containing products was introduced, and their use was allowed until the end of 2032 (Regulation, 2011). Due to the lack of complete data on the quantity of asbestos-containing products, other measures are taken to estimate the scale of the problem. The subject of the research is roofing made of corrugated and flat asbestos-cement sheets, which in the world account for over 80% of currently used asbestos-containing products (Collegium Ramazzini, 2010).
Due to the very high time and labor costs of in-situ surveys, which seem to be the most reliable source of data, new methods are sought to determine the quantity and spatial distribution of asbestos-cement roofing. The paper presents various methods of the recognition of asbestos-cement roofs, various remote sensing data, and a method of estimating the quantity in the scale of administrative units. The research was conducted in over 160 local administrative units in Poland. Research conducted to determine the possibility of estimating the area of asbestos-cement roofs requires data on the number of asbestos-cement roofs in representative administrative units. Therefore, the possibilities of obtaining such data using classification algorithms (SAM and CNN) and various data, that is, APEX aerial hyperspectral imagery and high-resolution orthophotomaps, were sought. The results of both of these independent studies are presented along with an indication of their advantages and disadvantages.
The objective of this paper is to present methods for estimating the number of asbestos-cement roofs to assess the environmental risk of air pollution on a national scale and to present methods for the recognition of asbestos-cement roofs using various classification algorithms and image data. These algorithms can be successfully used in other countries to determine the amount of asbestos-cement roofs to be safely disposed of and take the necessary actions.
Research scope
The study area for the modeling of the quantity of asbestos-cement roofing in local administrative units
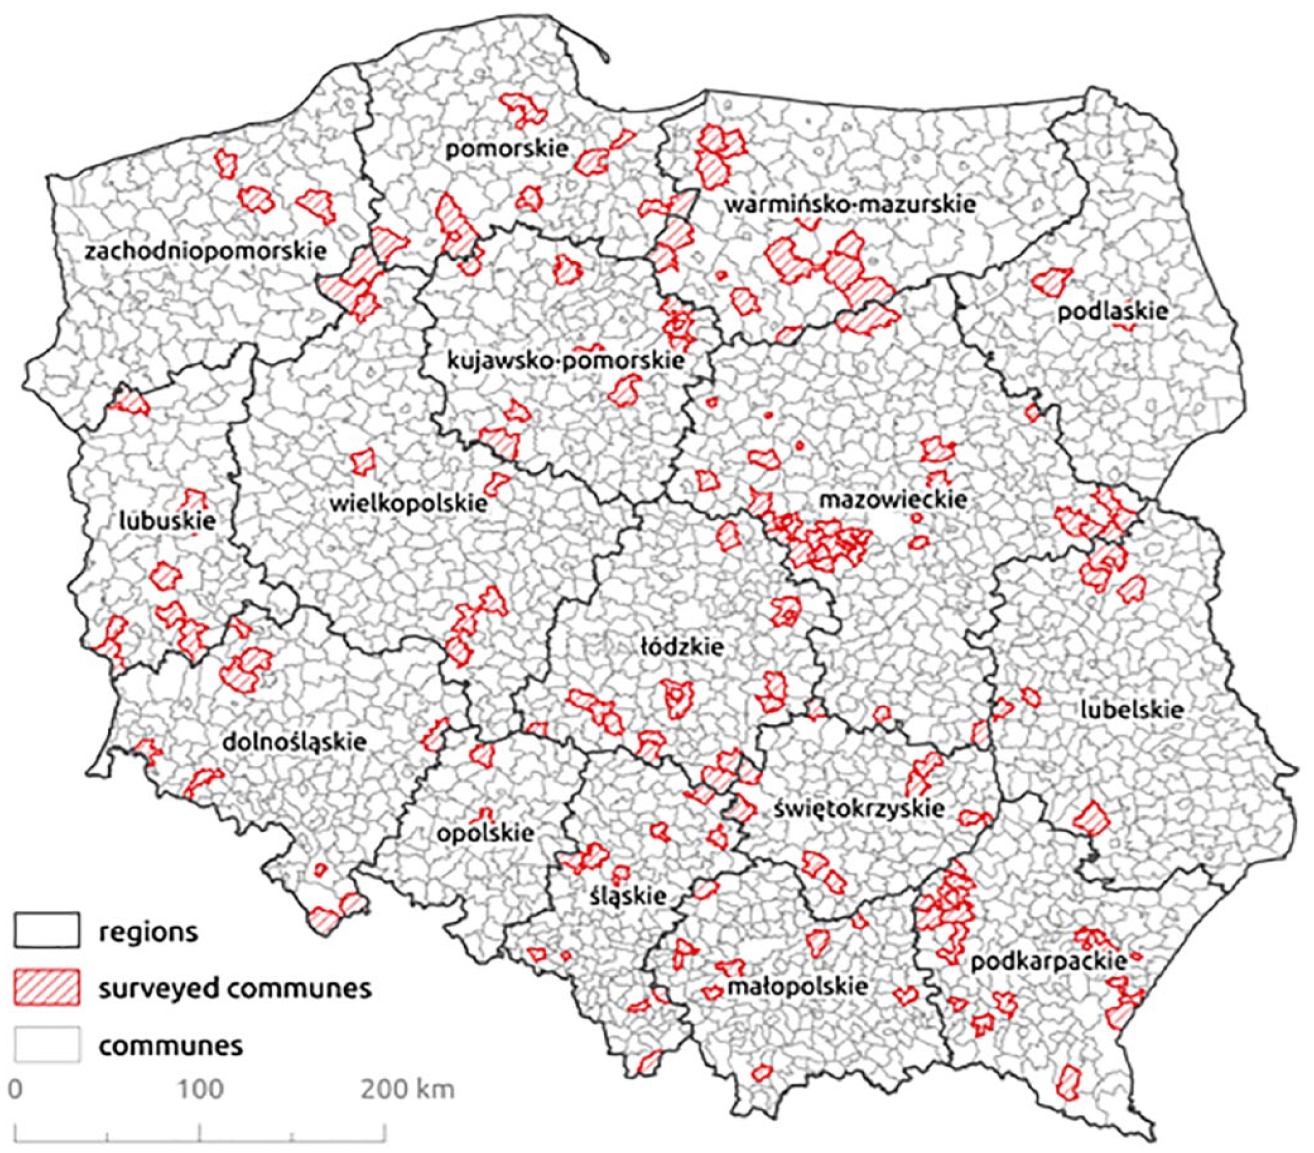
The research embraced the entire area of the territory of Poland. Poland is divided into 2477 local administrative units (communes). To obtain information on the amount of asbestos-cement roofs in communes, 160 representative administrative units were selected for the survey (Figure 1). Field inventory takings were conducted, that is, a physical count of all asbestos-cement and other roofing. During the fieldwork, each roof building was labeled as an asbestos roof and a non-asbestos roof.
The study area for the modeling of the quantity of asbestos-cement roofing in local administrative units recognition of asbestos-cement roofs.
The study area for the recognition of asbestos-cement roofs
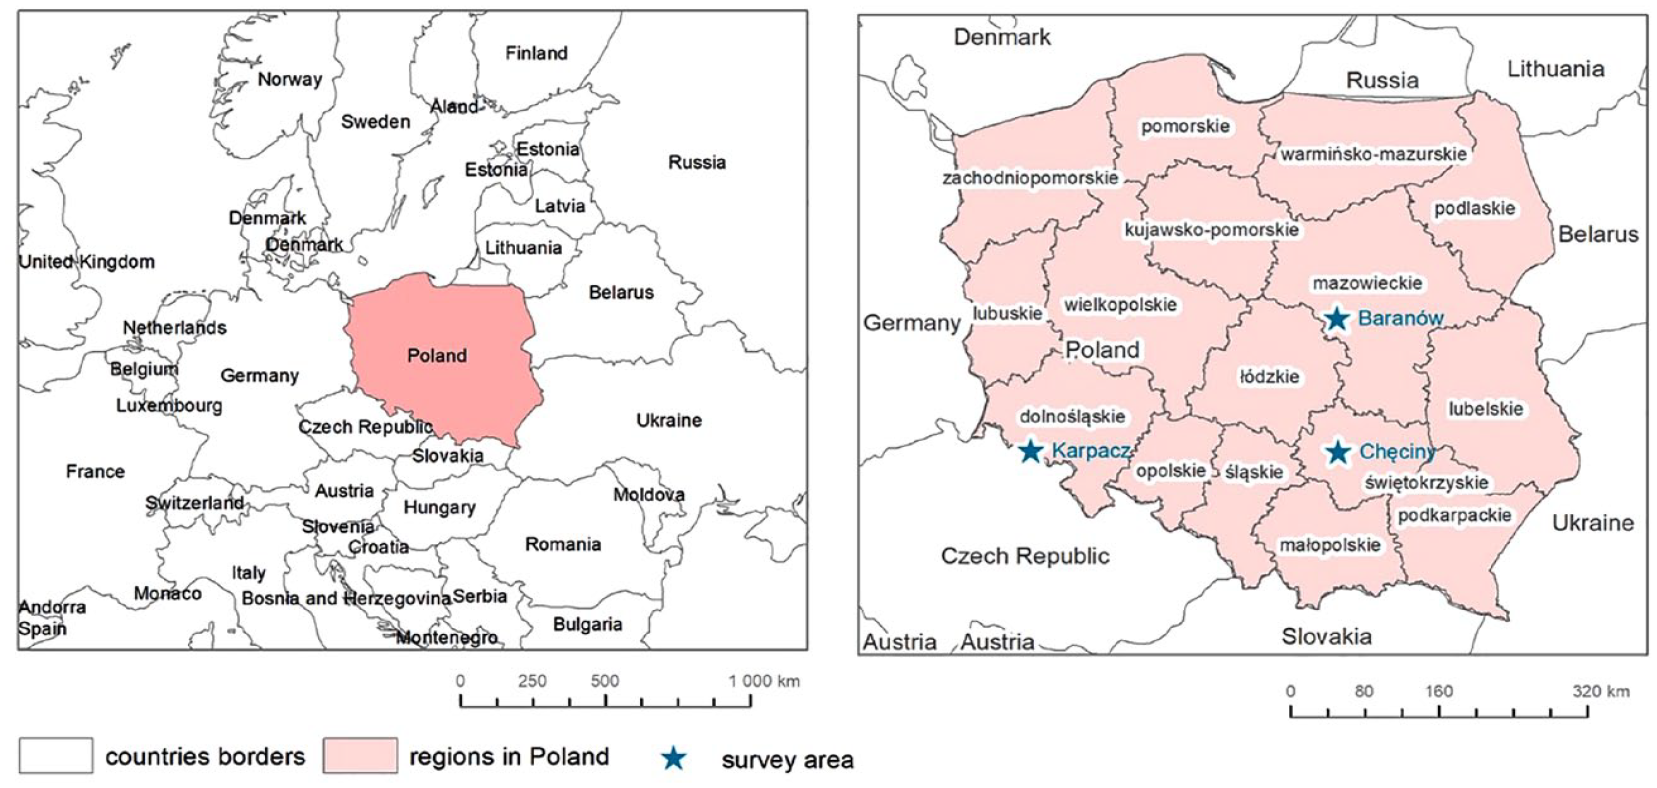
The study was conducted in Poland concerning administrative units and particular communes: Karpacz, Chęciny, and Baranów (Figure 2). The commune of Karpacz is urban and is located in dolnosląskie province in Karkonoski County. The commune of Chęciny is urban-rural and is located in Świętokrzyskie Province in Kielce County. Baranów commune is a rural commune, located in the Mazowieckie Province, in Grodzisk County.
The study area for the recognition of asbestos-cement roofs.
The area of Poland amounts to 312.7 thousand km2. Karpacz commune has an area of 37.9 km2, Chęciny—127.4 km2, and Baranów—75.4 km2 (Local Data Bank, 2021).
Data used
Landuse, statistical data, physical counting results, and historical conditions for the modeling of the quantity of asbestos-cement roofing in local administrative units
The first stage of the estimation of the amount of asbestos-cement roofing in local administrative units in Poland was to collect the following data: physical counting of asbestos-cement roofing in use, statistical data on the socio-economic situation of all communes, land use, and historical conditions referring to annexations, and information on former asbestos manufacturing plants (Wilk et al., 2019). Physical inventory counting of asbestos-cement roofing was performed in 160 communes across Poland. To investigate the socioeconomic situation of communes Central Statistical Office of Poland statistical data was used (Local Data Bank, 2021). For each commune, a total of 192 variables were collected from the following categories: population, buildings, public finance, housing economy and municipal infrastructure, wages, salaries, social security benefits, agricultural census, entities of the national economy, labor market, and environment protection.
An important element in the process of estimating the number of asbestos-cement roofs is to determine the area occupied by buildings (residential, commercial, industrial, and other buildings). Therefore data on built-up areas were acquired from the Corine Land Cover Project (CLC, 2006), the Soil Sealing Layer Project (SSL, 2009), and the Database of Topographic Objects (DTO, 2021). CLC 2006 database is the result of the European Environment Agency (EEA) project aiming at the documentation of changes in land cover/land use. Its spatial resolution is 25 ha and the accuracy reached 85%. SSL 2009 is also the EEA project result. It was set for the development of a soil sealing layer for built-up areas, with a spatial resolution of 20 m, and an accuracy of 85%. DTO is a vector database of topographic objects developed on a scale of 1:10,000 by the National Geodetic Service. The study was conducted in four scenarios. The list and number of important variables remained unchanged, and the four prepared datasets differed in the area of built-up areas:
- Corine Land Cover 2006 data (CLC),
- Soil Sealing Layer 2009 data (SSL),
- Database of Topographic Objects (DTO1 and DTO2, two sets based on different levels of detail).
Data from the Mosaic project, implemented by the Max Planck Society, and the Institute for Demographic Research in Rostock (Germany) were used for the historical census data (Szołtysek and Gruber, 2016). Data regarding asbestos manufacturing plants were obtained through surveys, individual interviews, and on-site visits (Wilk et al., 2014). The digitalization of all data with the use of ArcGIS software was performed to develop a spatially referenced geodatabase.
Hyperspectral imagery and fieldwork for the Karpacz area
APEX aerial hyperspectral images were obtained during the HyMountEcos project. The imagery was collected in September 2012 as a part of a project within the EUFAR (European Facility For Airborne Research). The flight plan included 15 transect strips over the Polish and Czech parts of the Karkonosze National Park and its buffer, which included Karpacz. Hyperspectral imagery with a wavelength ranging from 0.4134 μm to 2.4478 μm with 288 spectral channels at a spatial resolution of 2.7 m was acquired and used. Noise normalization and reduction were performed with the use of the Minimum Noise Fraction (MNF) transformation. Seventeen channels after the MNF transformation were used for the classification. Data on types of roof coverings in Karpacz were collected during the field survey (Krówczyńska et al., 2016). The digitalization was performed with the use of ArcGIS software to develop a spatially referenced geodatabase.
High-resolution orthophotomaps and fieldwork for the Chęciny and Baranów area
High-resolution aerial imagery, that is, orthophotomaps extracted from the geoportal maintained by the Central Office of Geodesy and Cartography of Poland with a spatial resolution of 25 cm was used (Geoportal, 2021). The aerial imagery was collected in April and May 2015. During the preprocessing stage, the orthophotomaps in RGB composition were merged into two mosaics, one for each commune. Data on asbestos-cement roofing was obtained during a field survey for Chęciny (Krówczyńska et al., 2020) and Baranów (Raczko et al., 2022). 4675 buildings in Chęciny and 2773 buildings in Baranów were recorded during fieldwork. Each building was given an asbestos or non-asbestos signature. There is no risk that new buildings with asbestos-cement roofs will appear, as their use has been banned in Poland since 1997. The digitalization was done with the ArcGIS software and resulted in the development of a spatially referenced geodatabase.
Methods
Random Forest algorithm for the modeling of the quantity of asbestos-cement roofing in local administrative units
The Random Forest algorithm (Liaw and Wiener, 2002) was used for the supervised machine learning, separately for four prepared datasets for all communes in Poland (CLC, SSL, DTO1, and DTO2). Each regression tree was constructed using a different dataset in a learning sample, in which two-thirds of observations from the dataset are used for the learning process, and the remaining one-third of observations to test the quality of the model. The measure of the quality of the algorithm was the pseudo-R2 parameter (Liaw and Wiener, 2002) (1):
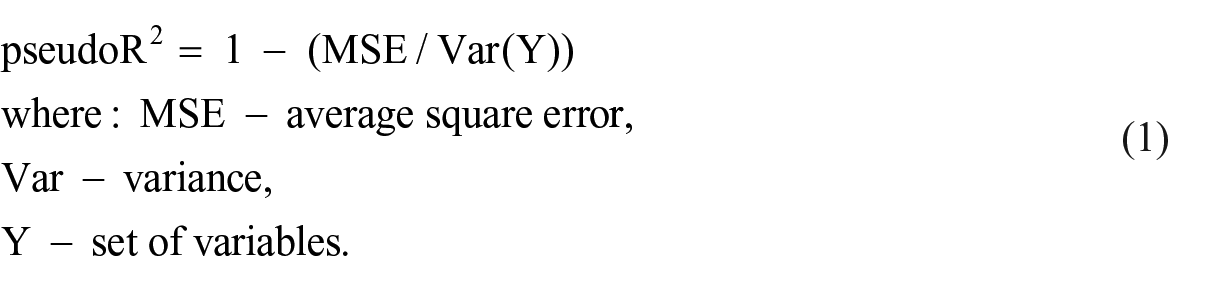
Calculations were made for ntree = 500 and the optimal number of variables for regression in each node was calculated with the tune.RF function. RandomForest package and the predict function were applied for the estimation of the amount of asbestos-cement roofing (Kuhn, 2016). The use of the response option enabled the estimation of the amount for a given class based on the majority of votes in the learning set (Kuhn, 2016). Results were obtained for each of the four datasets separately, that is, the amount of asbestos-cement roofing (m2) per unit area of the built-up surface (ha). The comparison of the value of the pseudo-R2 parameter for four tested datasets was the measure of the quality of the developed model. The model with the highest value of the pseudo-R2 parameter was then the subject of further research.
Spectral Angle Mapper algorithm for the Karpacz study area
The mapping of asbestos-cement roofing was performed using the Spectral Angle Mapper (SAM) algorithm (Krówczyńska et al., 2016). The selection of the classification parameters was adjusted using a trial and error approach based on testing samples of asbestos-cement roofing acquired during the fieldwork. SAM is a type of classification that uses an n-dimensional angle to align pixels with reference spectra. This algorithm determines the spectral similarity between two spectra by calculating the angle between the spectra treating them as vectors in a space with dimensions equal to the number of bands. SAM compares the angle between the tail spectrum vector and the vector of each pixel in n-dimensional space. Smaller angles mean a closer match to the reference spectrum. Pixels that are further than the specified maximum angle threshold in radians are not classified (Lecun et al., 1998).
Convolutional Neural Networks (CNN) for the Chęciny and Baranów study area
CNN is used to analyze image data by the application of special layers in the network. The convolution layer is designed to extract information from the image and the pooling layer is to generalize the information using local connections and shared weights between layers to maintain network training speed (Abadi et al., 2016). A simple architecture network used for Chęciny (Krówczyńska et al., 2020) consisted of two convolutional layers (96 kernels, 3 × 3 kernel, stride 1 for block 1 and stride 2 for block 2), activation layer (ReLU activation function), max-pooling laver (2 × 2 kernel, stride 1), batch normalization layer, spatial drop out layer (5%) and two blocks of fully connected layers (512 neurons, ReLU activation function), dropout layer (50%), and batch normalization layer. The last layer of the network was the classification layer using two neurons and a softmax activation function. Network training lasted 200 epochs. The learning parameter was set to 0.001. The training speed was reduced every 10th epoch by 20% of the current value of the learning parameter (Figure 3).
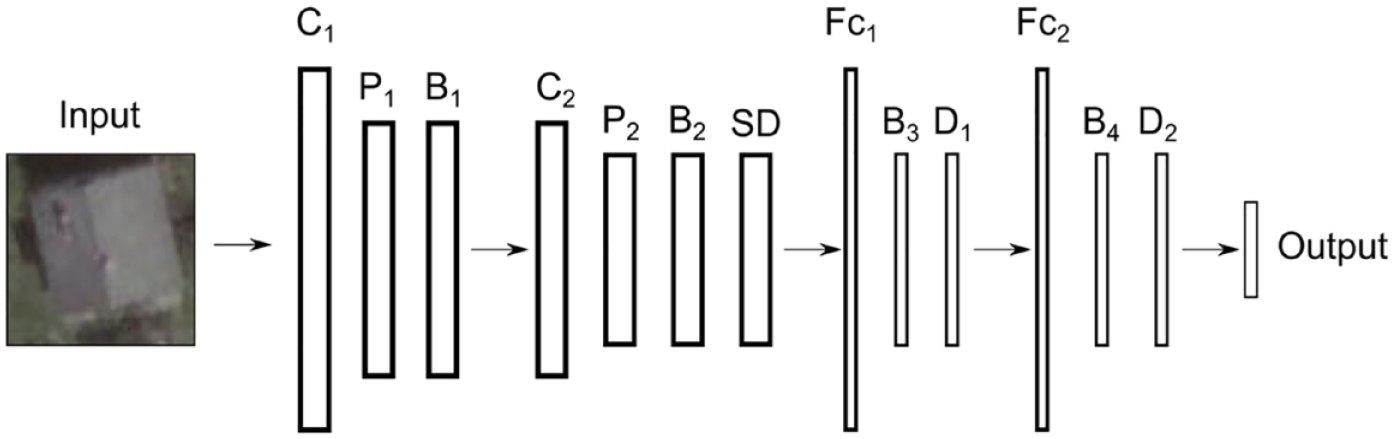
Convolutional neural network used in this study. C: convolutional layers; P: pooling layers; B: batch normalization layers; SD: spatial dropout layer; D: dropout layers (Krówczyńska et al., 2020).
A new architecture of a convolutional neural network with a feature extraction block based on inception-net was used for testing four scenarios for Chęciny and Baranów (Raczko et al., 2022). The new updated convolutional neural network architecture consisted of a convolutional block, that is, convolutional layer (64 kernels, 3 × 3 kernel, stride 1), activation layer (ReLU activation function), batch normalization layer, four feature extraction blocks, each followed by a pooling layer and spatial dropout layer (dropout rate amounted to 0.55) and two fully connected blocks, that is, fully connected layer (1024 neurons, ReLU activation function), batch normalization layer, activation layer (ReLU activation function), dropout layer (dropout rate amounted to 0.50), output layer (softmax function) (Figure 4).
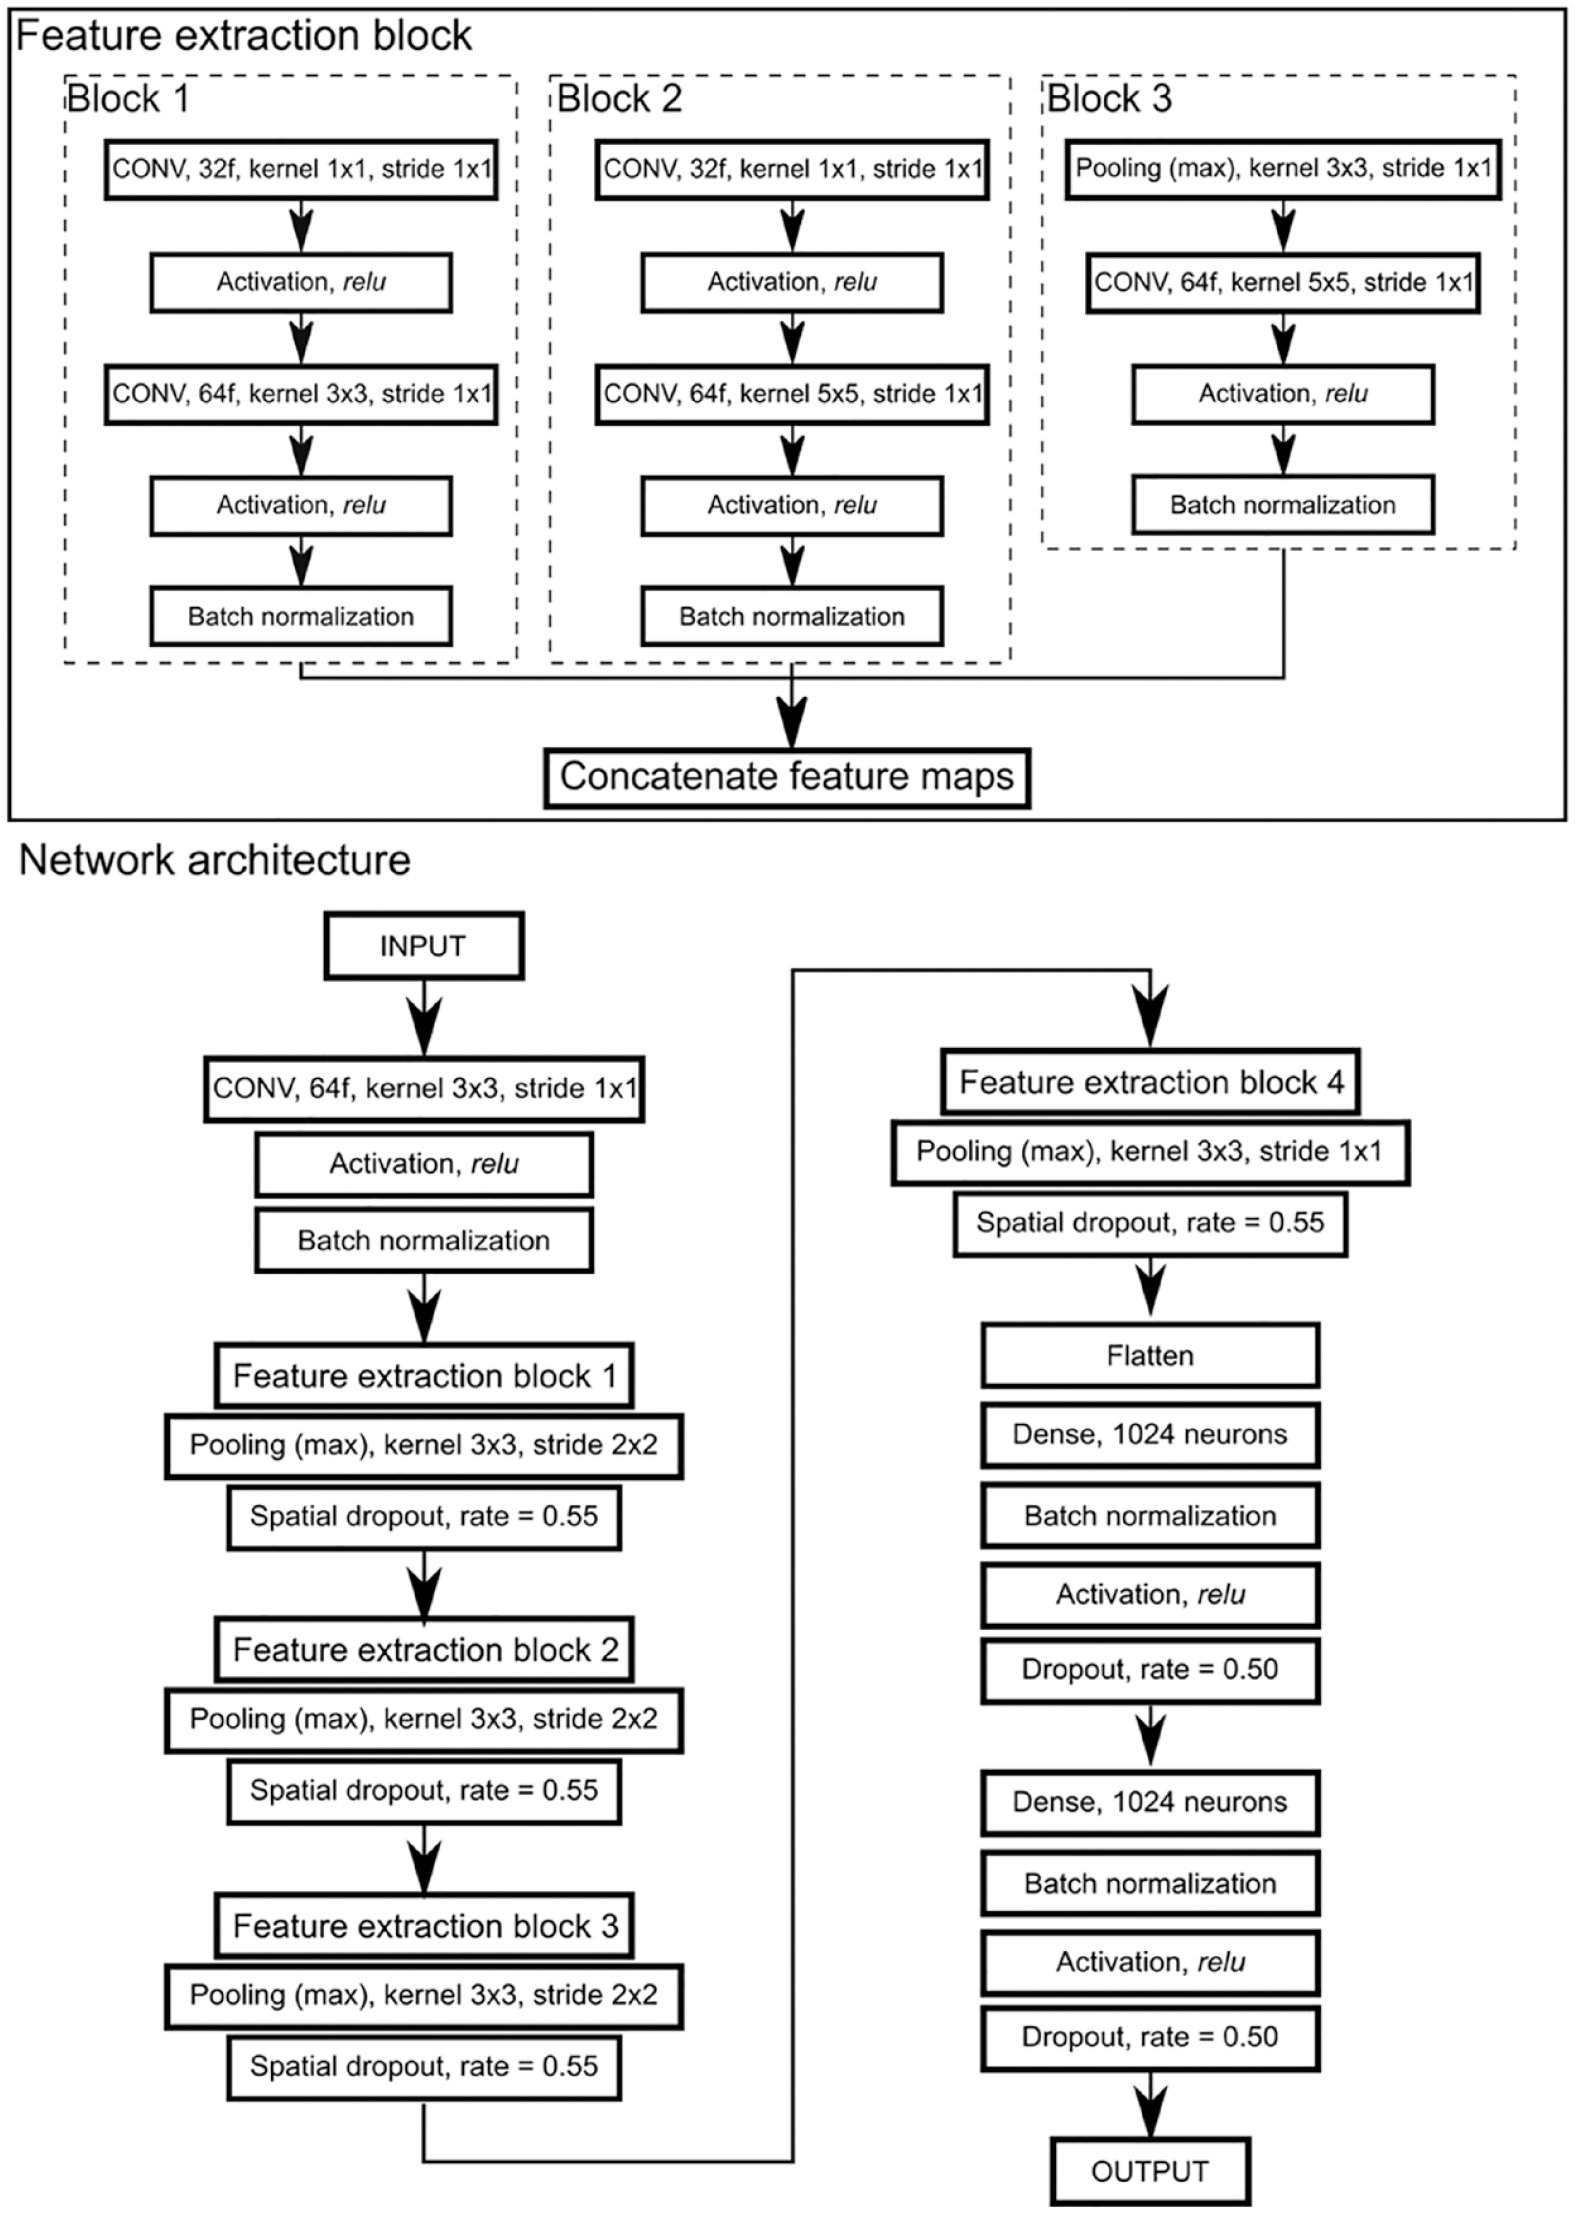
CNN architecture (Raczko et al., 2022).
The network training lasted 128 epochs, and the batch size was 64 samples. The learning rate parameter was set to 0.0015. During the training process, Adam optimizer was used. Binary cross-entropy was a loss function during network training. The learning rate was reduced every 10th epoch by 15% of the current value of the learning parameter to stabilize the network model. The final selection of the best model was based on the validation dataset loss function value assuming the lowest is the best. Network training was carried out using the TensorFlow (Falbel et al., 2021) and R-Keras libraries (Falbel et al., 2021) in the R programing environment (R Core Team, 2020).
Results
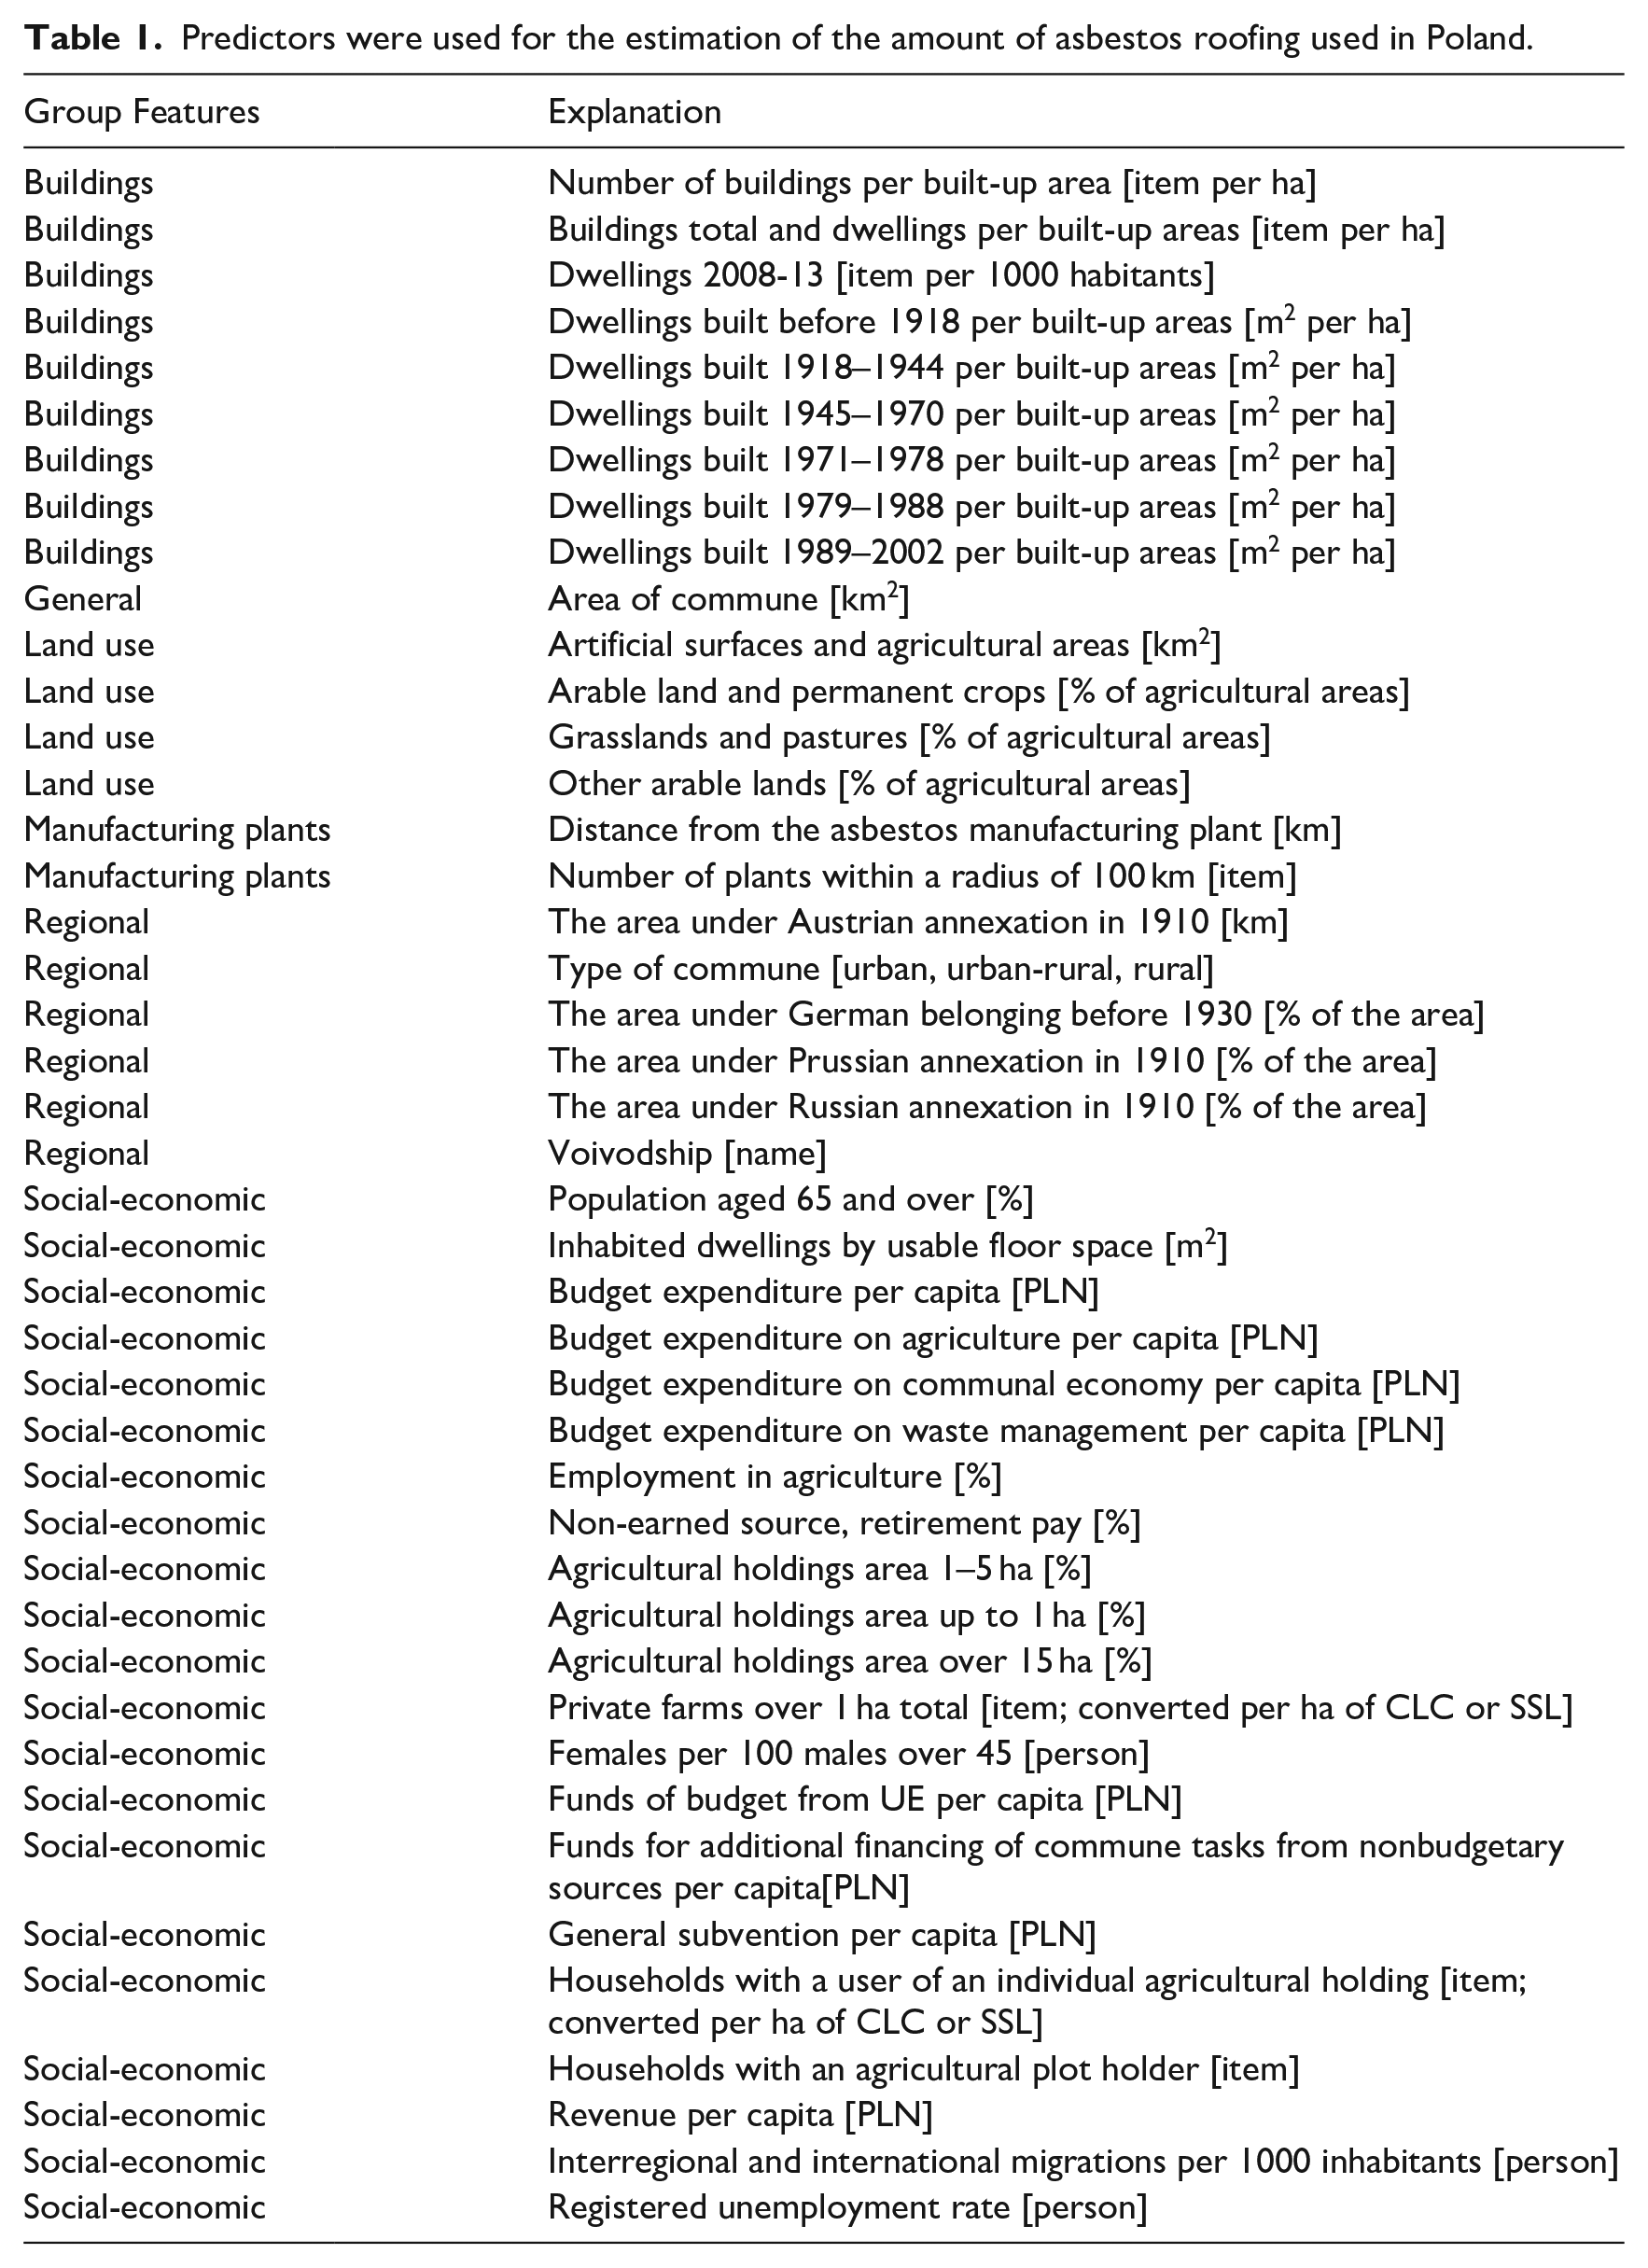
Estimation of the quantity of asbestos-cement products and its spatial distribution in all communes in Poland based on social-economic and historical conditions with the use of data on built-up areas with various spatial resolutions was performed for four different datasets. Predictors divided into group features that were used for the estimation of the amount of asbestos roofing used in Poland are presented in Table 1 (Wilk et al., 2017).
Predictors were used for the estimation of the amount of asbestos roofing used in Poland.
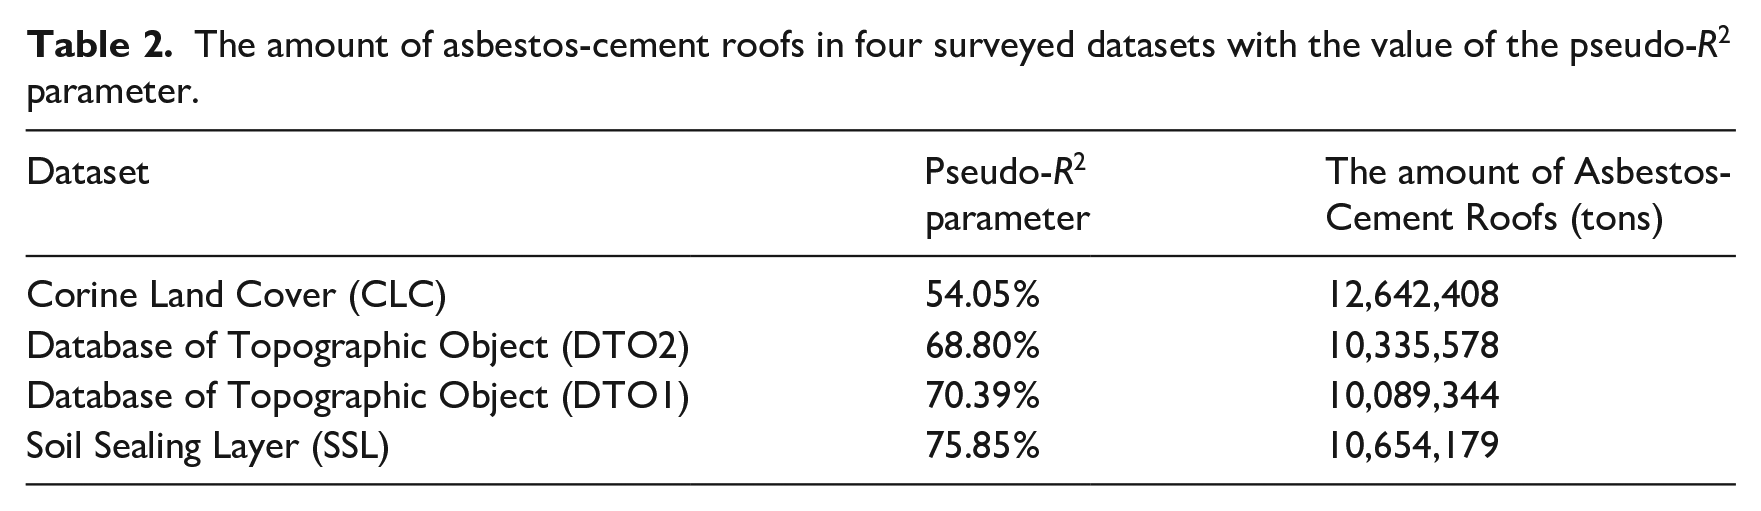
To determine the quality of the model developed with the Random Forest algorithm the pseudo-R2 parameter was calculated. It has ranged from 54.05% to 75.85%. Using the conversion rate of m2 per kg currently used in Poland, that is, 1 m2 to 15 kg of asbestos-cement roofs, the estimated number of asbestos-cement roofs in the models ranged from 10.0 to 12.6 million tons (Table 2).
The amount of asbestos-cement roofs in four surveyed datasets with the value of the pseudo-R2 parameter.
The verification of the developed model was based on the comparison of the obtained values of the pseudo-R2 parameter for four tested datasets. The highest value of the pseudo-R2 parameter (75.85%) was obtained for the SSL dataset. The SSL dataset was therefore the subject of further analysis. The largest number of asbestos-cement roofs, that is, 18% of the total estimated amount, is in the Mazowieckie region, followed by Lubelskie (12%), and then Łódzkie and Wielkopolskie (each with a 9% share). In the Małopolskie, Podlaskie, Świętokrzyskie, Podkarpackie, and Śląskie regions, the share of the estimated amount of asbestos-cement products used ranges from 6% to 7%. Five percent of the share is Kujawsko-Pomorskie, and 2-3%—Dolnośląskie, Pomorskie, Warmińsko-Mazurskie, Zachodniopomorskie and Opolskie. Lubuskie region has the lowest share (Figure 5).
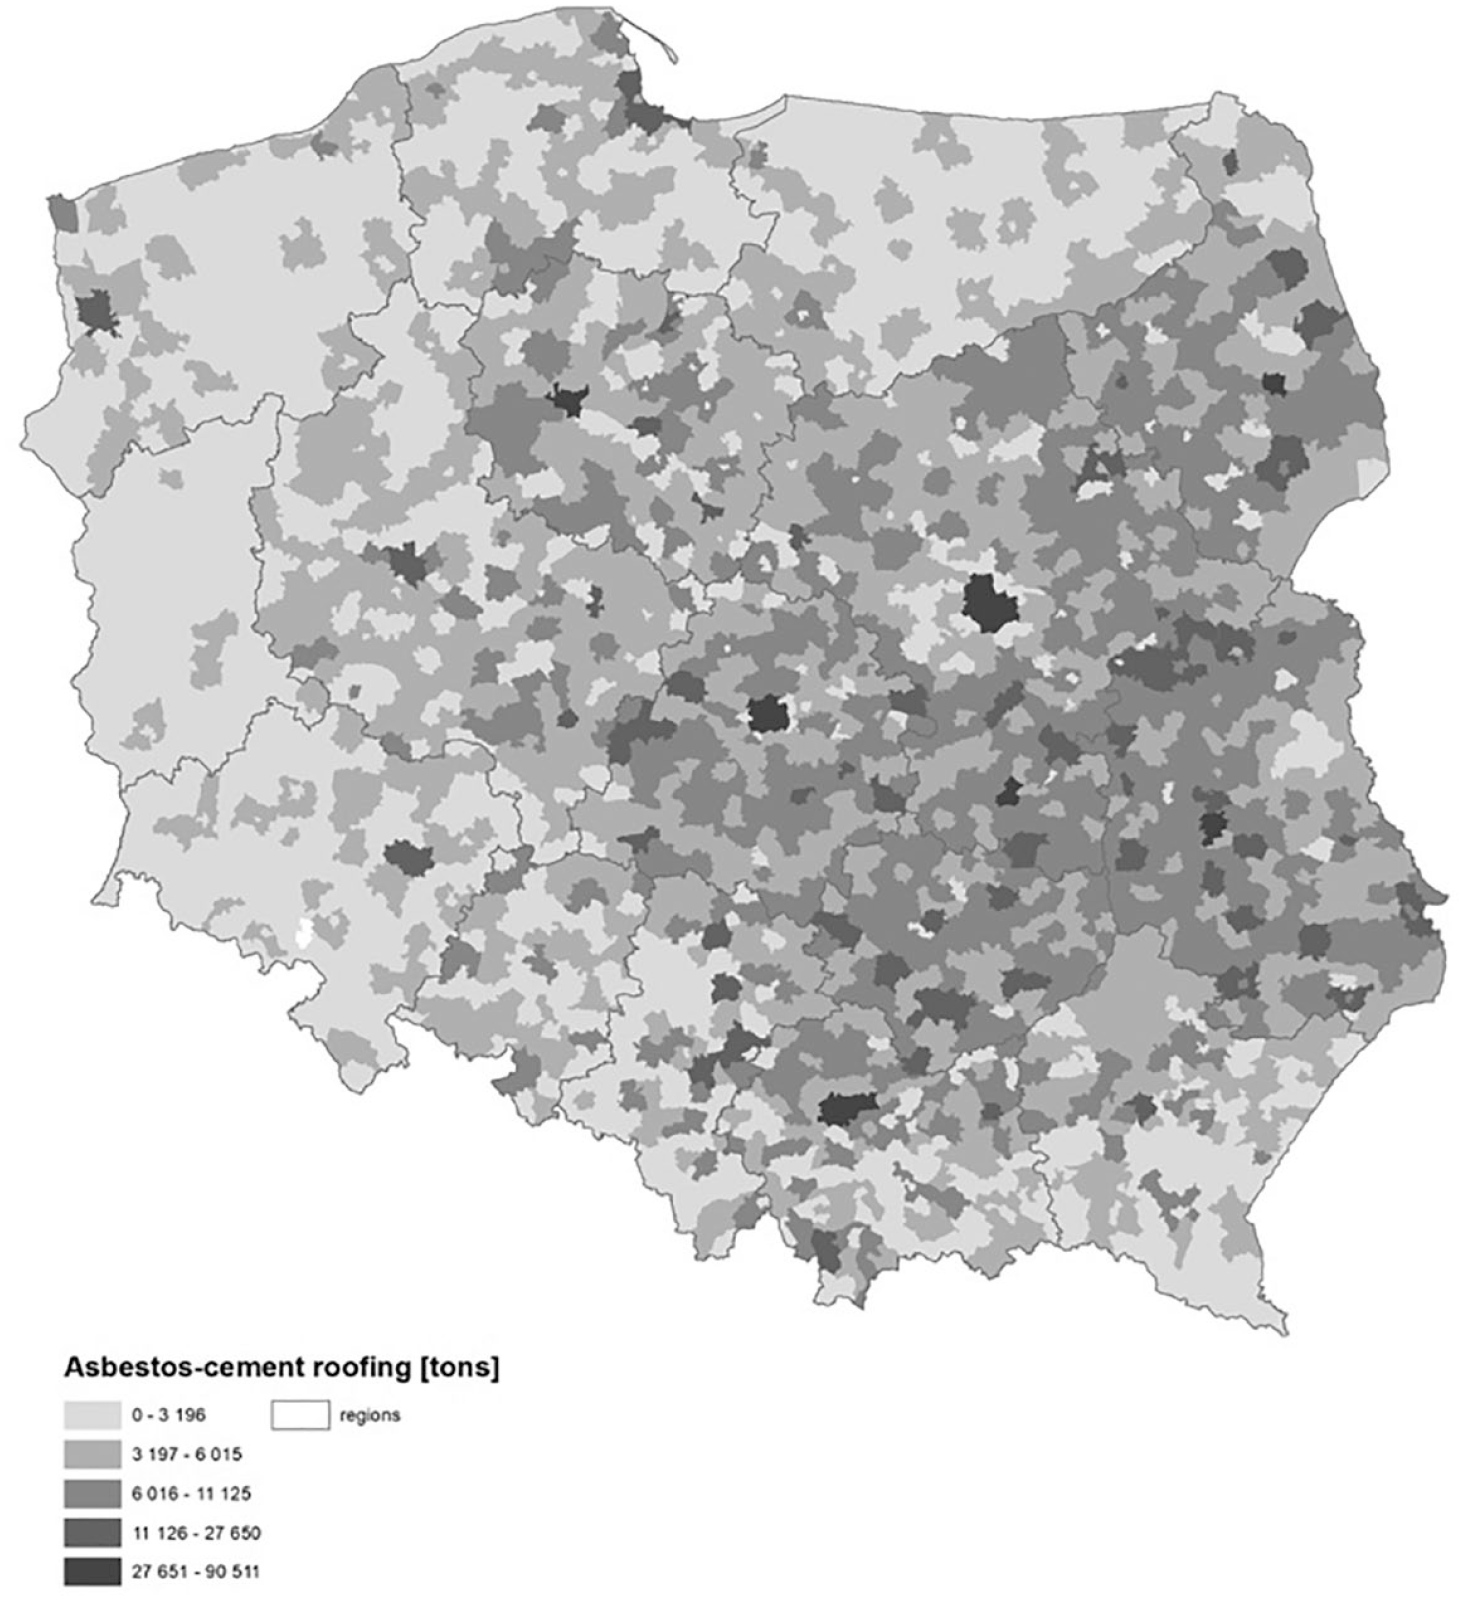
The estimated amount of asbestos-cement roofing in all communes in Poland is based on the SSL dataset.
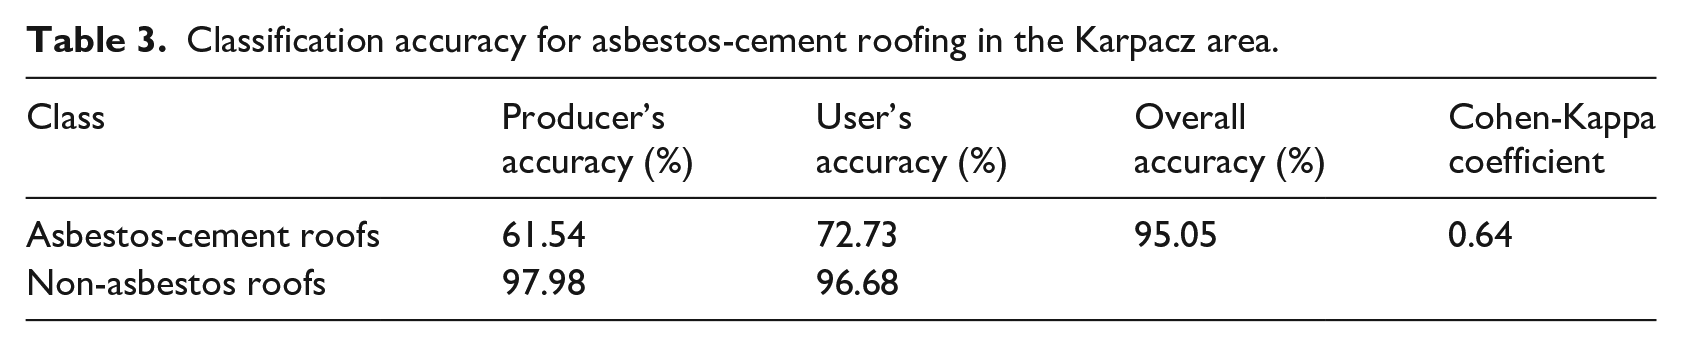
While the research on the estimation of the number of asbestos-cement roofs concerning the level of the administrative division of the country (communes) was carried out, research was undertaken related to remote sensing recognition of these roofs concerning individual buildings (Krówczyńska et al., 2016). The number of buildings surveyed included 225 buildings, of which 10% had asbestos-cement roofing. The producer’s accuracy with the use of the SAM algorithm for the classification of roofing materials on hyperspectral imagery in Karpacz was 61.5%, and the user’s accuracy was 72.7%. The overall accuracy of the classification was 95.05%, and Cohen’s Kappa coefficient was 0.64 (Table 3).
Classification accuracy for asbestos-cement roofing in the Karpacz area.
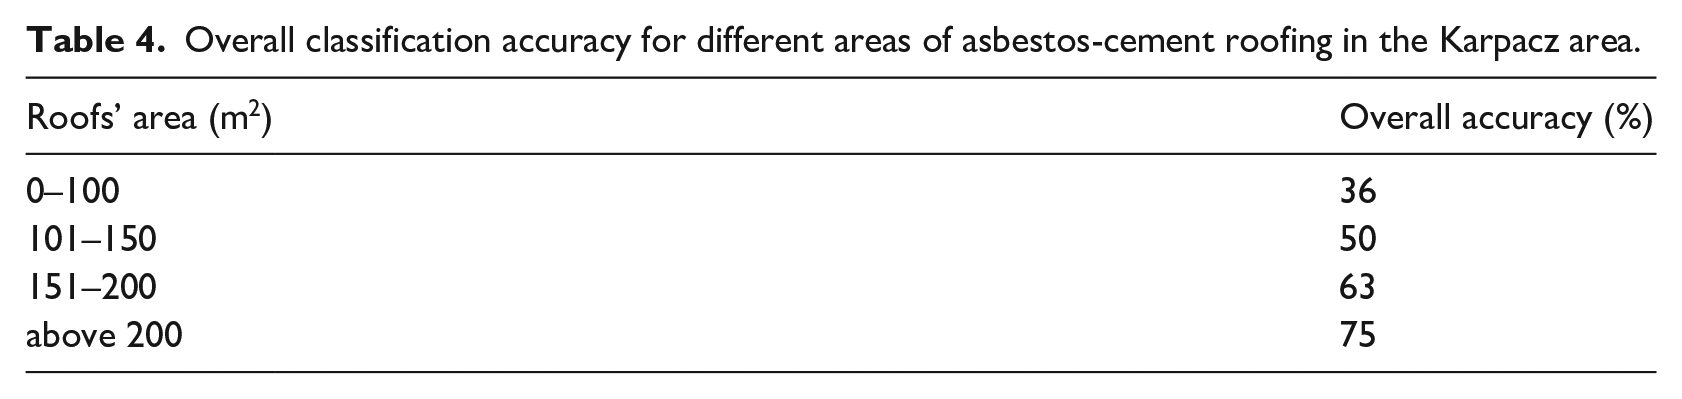
During the classification, the following groups of asbestos-cement roofing areas were surveyed: 0–100, 101–150, 151–200 m2, and above 200 m2 (Table 4).
Overall classification accuracy for different areas of asbestos-cement roofing in the Karpacz area.
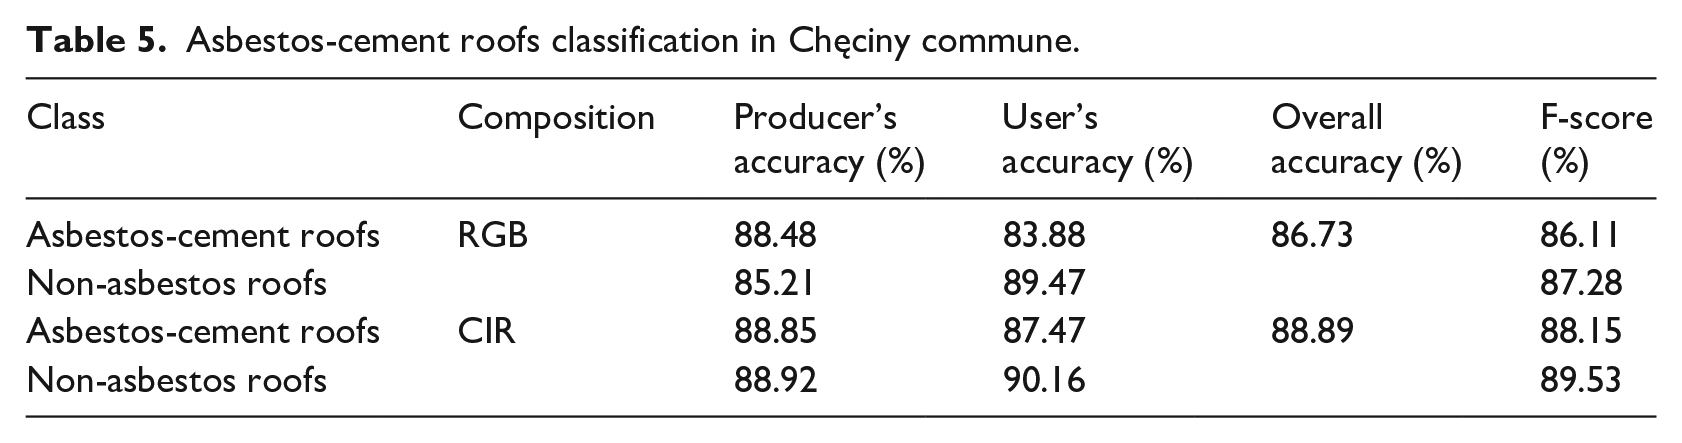
Using Convolutional Neural Networks and aerial orthophotomaps classification of asbestos-cement roofs was carried out (Krówczyńska et al., 2016). Orthophotos in RGB and CIR compositions were used. Models developed began to stabilize in the 150 epochs. The overall accuracy of the training and the validation was 93% and 86%, respectively, for the RGB image and 94% and 89% for the CIR composition (Table 5).
Asbestos-cement roofs classification in Chęciny commune.
The spatial distribution of misclassifications was at a similar level in urban and rural areas. After obtaining these results the architecture of CNN was updated in terms of convolutional blocks, and fully connected layers enhanced by the use of the inception-net-based network (Raczko et al., 2022). Different scenarios were employed to test the developed model: separate networks were trained and validated for Chęciny commune (scenario A) and Baranów commune (scenario B), signatures from both communes were combined (scenario C), the network was trained with Chęciny commune signatures and validated in Baranów commune (scenario D; Table 6).
Asbestos-cement roofs classification in Chęciny and Baranów communes.
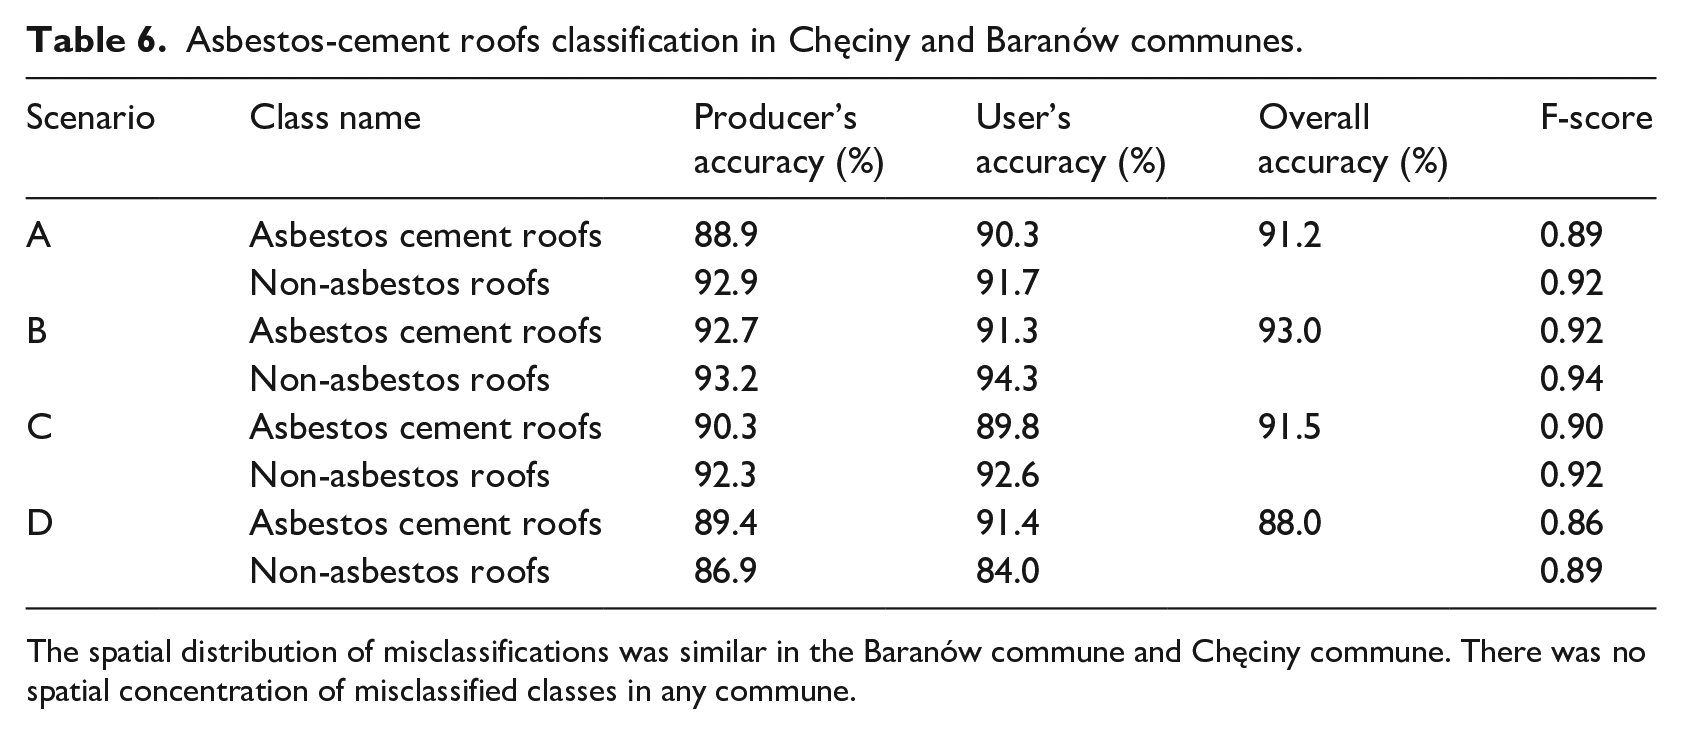
The spatial distribution of misclassifications was similar in the Baranów commune and Chęciny commune. There was no spatial concentration of misclassified classes in any commune.
The obtained results of identification of asbestos-cement roofs showed that for the total area of such buildings in the commune, the accuracy is higher than for individual buildings, which means that the model is very likely to give very good estimation results for the total number of asbestos-cement roofs in the commune, and with an accuracy of over 90%, it can classify individual asbestos-cement roofs.
Discussion
Attempts to identify asbestos-cement roofs undertaken so far by researchers focus primarily on the use of hyperspectral data (MIVIS, Aisa Eagle II, APEX) and multispectral data (QuickBird, WorldView-2) and usually use classification algorithms, i.e.: Spectral Angle Mapper, Support Vector Machine, object classification or decision trees. Classification accuracy is comparable to the results obtained in these studies concerned small areas of approximately 2–9 km2 (Fiumi et al., 2012). For larger areas, the classification accuracy decreased from 65% for 795 km2 (Fiumi et al., 2014) to 43% for 3263 km2 (Frassy et al., 2014).
The high overall accuracy of the classification of asbestos-cement roofs based on APEX hyperspectral aerial photographs for the Karpacz area (95.05%) was obtained (Krówczyńska et al., 2016). The most important conclusion is that the overall accuracy of the classification increases with the increase in the area of the asbestos-cement roof. This is related to the spatial resolution of 2.7 m APEX (a 10 × 10 m roof will roughly cover 3 × 3 pixels). A significant barrier to the use of hyperspectral data for the entire territory of Poland is the high cost of their acquisition.
The research results are the first scientific paper on the possibility of using machine learning (convolutional neural networks) and aerial imagery for remote recognition of asbestos-cement roofs (Krówczyńska et al., 2020; Raczko et al., 2022). There are attempts taken to estimate the amount of asbestos-cement products used based on the consumption rates of asbestos fibers in production. The published research results most often use data on asbestos, compiled by the American Geological Survey (USGS), where information on asbestos extraction and production of asbestos fibers is collected on an annual basis by country (Virta, 2006). The USGS database does not collect data on the amount of asbestos-containing products used. The data of the American Geological Survey are used by researchers to determine the quantity of products produced on a national scale and to convert the result obtained in this way according to the number of inhabitants. On this basis, the total amount of products produced in these countries is determined (Kameda et al., 2014; Lin et al., 2007). The same applies to the use of USGS data to develop National Asbestos Profiles based on WHO and ILO recommendations, for example, for Bulgaria (Vangelova et al., 2015), Japan (Furuya et al., 2013), or Germany (NAP Germany, 2014). The review of the results of research undertaken so far indicates that in no other country, an attempt has been made to estimate the amount of asbestos-cement roofing used or to determine its spatial distribution. However, data on the consumption of the raw material, that is, asbestos fibers in the production based on USGS are used to assess the estimated amount of products used (based on the percentage of fibers in the particular products). The development of indicators of asbestos consumption in production makes it possible to compare countries with each other, but it does not indicate the amount of asbestos-cement products currently in use, nor does it refer to the location of their use.
Estimation of the area of asbestos-cement roofs can replace field inventories. This change would be a qualitative milestone compared to the methods used so far. In addition, it would be possible to regularly update the inventory and monitor the removal of asbestos-cement products. Identification of asbestos-cement roofing for a single roof could be an alternative to time- and labor-intensive inventory for communes.
The research undertaken may fill the gap of the lack of methods for estimating the quantity and location of asbestos-cement roofs and updating data on the quantity still in use. If implemented operationally, they make it possible to update the quantity of asbestos-cement products at the level of communes and individual buildings with a frequency, for example, annually or biennially, consistently, with a specified error and at significantly lower costs.
The use of an operational method, using remote sensing data and supervised machine learning, would enable monitoring of the amount of asbestos-cement roofing materials used and remaining to be disposed of in Poland in the assumed perspective until 2032. To determine the rate of asbestos removal, necessary actions necessary to eliminate the use of products containing asbestos, the costs of their removal, ensuring the adequate capacity of asbestos-containing hazardous waste landfills, and to use these data in research to identify potential places of increased risk of asbestos-related diseases, including pleural mesothelioma, a malignant neoplasm typical of asbestos exposure. From the point of view of proper management of asbestos-containing waste, it is important to search for an optimal method to monitor the amount of used asbestos-cement roofing materials containing carcinogenic substances and to be removed by the end of 2032.
In addition, the development of a method for identifying asbestos-cement roofs with the use of high-resolution imagery and machine learning (convolutional neural networks) opens up the possibility of conducting research in the field of using the model to estimate asbestos-cement roofs in other countries and developing a model to monitor the process of removing asbestos-cement products. The combination of these two methods, that is, identification of asbestos-cement roofs using convolutional neural networks and high-resolution orthoimagery, and estimating the number based on the socio-economic situation of territorial administration units, described with statistical data, can be used to estimate the number of these roofs on a national scale. First, to obtain the dependent variable, that is, the number of asbestos-cement roofs in local government units (equivalent to Polish communes), a country-representative sample of units should be used, in which convolutional neural networks and high-resolution photos will be used to estimate the number of these roofs in units. Then, in the next stage, the results obtained will be combined with the socio-economic situation of the units (equivalents of communes) based on statistical data collected in public registers using machine learning (e.g. Random Forest).
Monitoring the number of asbestos-cement roofs should also be part of the implementation of the health policy in the field of environmental asbestos exposure, identifying places with a potential increased risk of developing asbestos-related diseases as a result of inhaling asbestos fibers in the air.
The result of the conducted research is the development of assumptions and methodology for inventorying and updating the quantity of asbestos-cement roofs using machine learning. The conditions that should be met for the developed model to become an operational solution include:
developed results of a detailed inventory of asbestos-cement roofing for a representative sample of administrative division units,
data on buildings (outlines, building centroids) in individual administrative units,
availability of spatial data on the built-up area,
statistical data for administrative units in the resources of the Central Statistical Office,
other data, such as the location of plants producing asbestos-cement roofing.
The assumptions regarding estimation as potentially used in place of field inventories conducted so far in Poland have been tested on the example of Chęciny and Baranów with a positive result (Raczko et al., 2022). The research results obtained may change the approach to the currently used inventory methods, which are time-consuming, labor-intensive, expensive, and do not provide information with the expected frequency, which makes it impossible to determine the costs of removal and determine the free capacity of landfills authorized to accept hazardous waste, estimate the impact of environmental exposure to asbestos and potential incidence of asbestos-related diseases, determining risk zones or estimating treatment costs in periods enabling modification of the adopted assumptions. They require further research and development to be used operationally. Monitoring the amount of asbestos-cement roofs still in use is desirable given the need to remove carcinogenic products inhalation of released asbestos fibers is dangerous to human health. The method of determining the number of roofs in local administrative units could also fulfill the recommendations of the World Health Organization in cooperation with the International Labor Organization (ILO), which indicates the need to develop National Asbestos Profiles, specifying, among others, the amount of asbestos and asbestos-containing products used in individual countries as factors important for the implementation of the process of determining the amount of used products for their removal from the environment, places for their storage that are safe for human health and the environment, and the costs of the entire process.
Conclusions
The way we frame social problems connected with hazardous substance use plays an important role in the determination of how well they can be addressed (Gibbons et al., 1994). The further evolution of the biosphere depends on social human activities on different scales, and on the development of technology (Williams et al., 2015). An important issue remains the elimination of negative phenomena concerning harmful substances to which man has exposed himself, as well as leaving the natural environment for future generations. The research undertaken in Poland may constitute an example of an approach to risk scale estimation to take the necessary actions to mitigate the risk. The quantification and mapping of the spatial distribution of asbestos-cement roofs may be a turning point in the estimation of the risk scale, in particular in environmental asbestos exposure leading to diseases for humans (Krówczyńska and Wilk, 2019; Wilk and Krówczyńska, 2021) and the disordered relationship between individual elements of the natural environment. Even if the globalization wave shifted environmental burdens geographically (Brolin and Kander, 2022), drawing on experience and methods developed may be beneficial in other countries in eliminating the risk of asbestos pollution of the environment.