
Abstract
Background
The utility of combined oesophageal pressure–impedance recording has been enhanced by automation of data analysis.
Objective
To understand how oesophageal function as measured by automated impedance manometry (AIM) pressure-flow analysis varies with bolus characteristics and subjective perception of bolus passage.
Methods
Oesophageal pressure–impedance recordings of 5 and 10 ml liquid or viscous swallows and 2 and 4 cm solid swallows from 20 healthy control subjects (five male; 25–73 years) were analysed. Metrics indicative of bolus pressurization (intrabolus pressure and intrabolus pressure slope) were derived. Bolus flow resistance, the relationship between bolus pressurization and flow timing, was assessed using a pressure-flow index. Bolus retention was assessed using the ratio of nadir impedance to peak pressure impedance (impedance ratio). Subjective perception of bolus passage was assessed swallow by swallow.
Results
Viscosity increased the bolus flow resistance and reduced bolus clearance. Responses to boluses of larger volume and more viscous consistency revealed a positive correlation between bolus pressurization and oesophageal peak pressure. Flow resistance was higher in subjects who perceived bolus hold up of solids.
Conclusions
Bolus volume and bolus type alter oesophageal function and impact AIM analysis metrics descriptive of oesophageal function. Perception of bolus transit was associated with heightened bolus pressurization relative to bolus flow.
Introduction
The potential utility of combined oesophageal manometry and multichannel intraluminal impedance recording has been recently enhanced by automation of data analysis. In the process of developing automated impedance manometry (AIM) pressure-flow analysis, new metrics were conceived that better describe the interactions between bolus transport and pressure generation. This new approach to integrated analysis is very different from the current application of each analysis type in isolation. AIM analysis was first applied to the assessment of pharyngeal swallowing,1–3 and the first reports of the technique in the oesophagus demonstrate potential in relation to elucidating post-fundoplication dysphagia4,5 and non-obstructive dysphagia. 6 A keystone of this novel approach is the use of impedance to track the trajectory of the bolus centre as it traverses the oesophagus. 7 The bolus trajectory pathway can therefore provide new insights into the complex interplay between pharyngeal-driven and oesophageal-driven bolus transport mechanisms. 7 Furthermore, the ability to objectively measure intraluminal pressure relative to bolus movement, and vice versa, can detect small variations and subtle abnormalities of oesophageal function that are not obvious with conventional analysis.
Given the potential clinical utility of this novel method, we undertook a pilot study to understand how oesophageal function, as measured by AIM pressure-flow analysis, varies with bolus characteristics and in relation subjective perception of bolus passage. We hypothesized that more viscous bolus consistencies would transit slower and require greater bolus pressurization and that subjective perception of bolus passage would correlate with alterations in oesophageal function as assessed by AIM pressure-flow analysis.
Methods
Subjects and protocol
The study protocol was approved by the Royal Adelaide Hospital Research Ethics Committee and performed in the University Department of Surgery, Royal Adelaide Hospital. Twenty healthy control subjects (five males, mean age 48.9 years, 25–73 yrs) underwent oesophageal high-resolution impedance-manometry. All subjects were screened for upper gastrointestinal symptoms, including an assessment of swallowing difficulty to a range of foods using a validated composite dysphagia score. 8 All reported no dysphagia symptoms (scale 0–45, 0 = none). Two solid-state manometric and impedance catheter configurations were used (10 subjects with each); a 4.0-mm diameter catheter incorporating 32 1-cm-spaced pressure sensors and 16 adjoining impedance segments, each 2 cm apart (Unisensor USA, Portsmouth, NH, USA) or a 4.0-mm diameter catheter incorporating 36 1-cm-spaced pressure sensors and 18 adjoining impedance segments, each of 2 cm (Given Imaging, Los Angeles, CA, USA). Pressure and impedance data were acquired at 50 Hz (Insight acquisition system, Sandhill Scientific, Denver, CO, USA or ManoScan acquisition system, Given Imaging). Subjects were intubated after application of topical anaesthesia (5% lignocaine spray) to the nasopharynx. The catheter was positioned with sensors straddling the region from the upper oesophageal sphincter to the stomach.
Subjects were asked to lie supine and the head of the bed was elevated by 30° to achieve a semi-upright posture. After a 10 min accommodation period, subjects were then given boluses of 5 × 5 ml and 5 × 10 ml liquid (0.9% saline), 5 × 5 ml and 5 × 10 ml viscous (viscosity 450 K cPs; Sandhill Scientific), and 5 × 2 cm2 and 5 × 4 cm2 solid. The solid bolus consisted of a square cut from a slice of white bread, onto which normal saline was applied immediately prior to placement into the mouth. Solid swallows were given at >1 min intervals and the subject was asked to chew ad libitum and then to swallow it whole. Masticating the bolus incorporates the saline into the bread bolus, improving its conductivity while reducing the consistency to that of a highly viscous semisolid.
Subjects were asked to record their perception of the bolus during each swallow using a six-point-scale to define the pattern of transit and intensity of perception (1 = none, 2 = raised awareness, 3 = slow passage, 4 = stepwise passage, 5 = obstruction, 6 = pain).
Data analysis
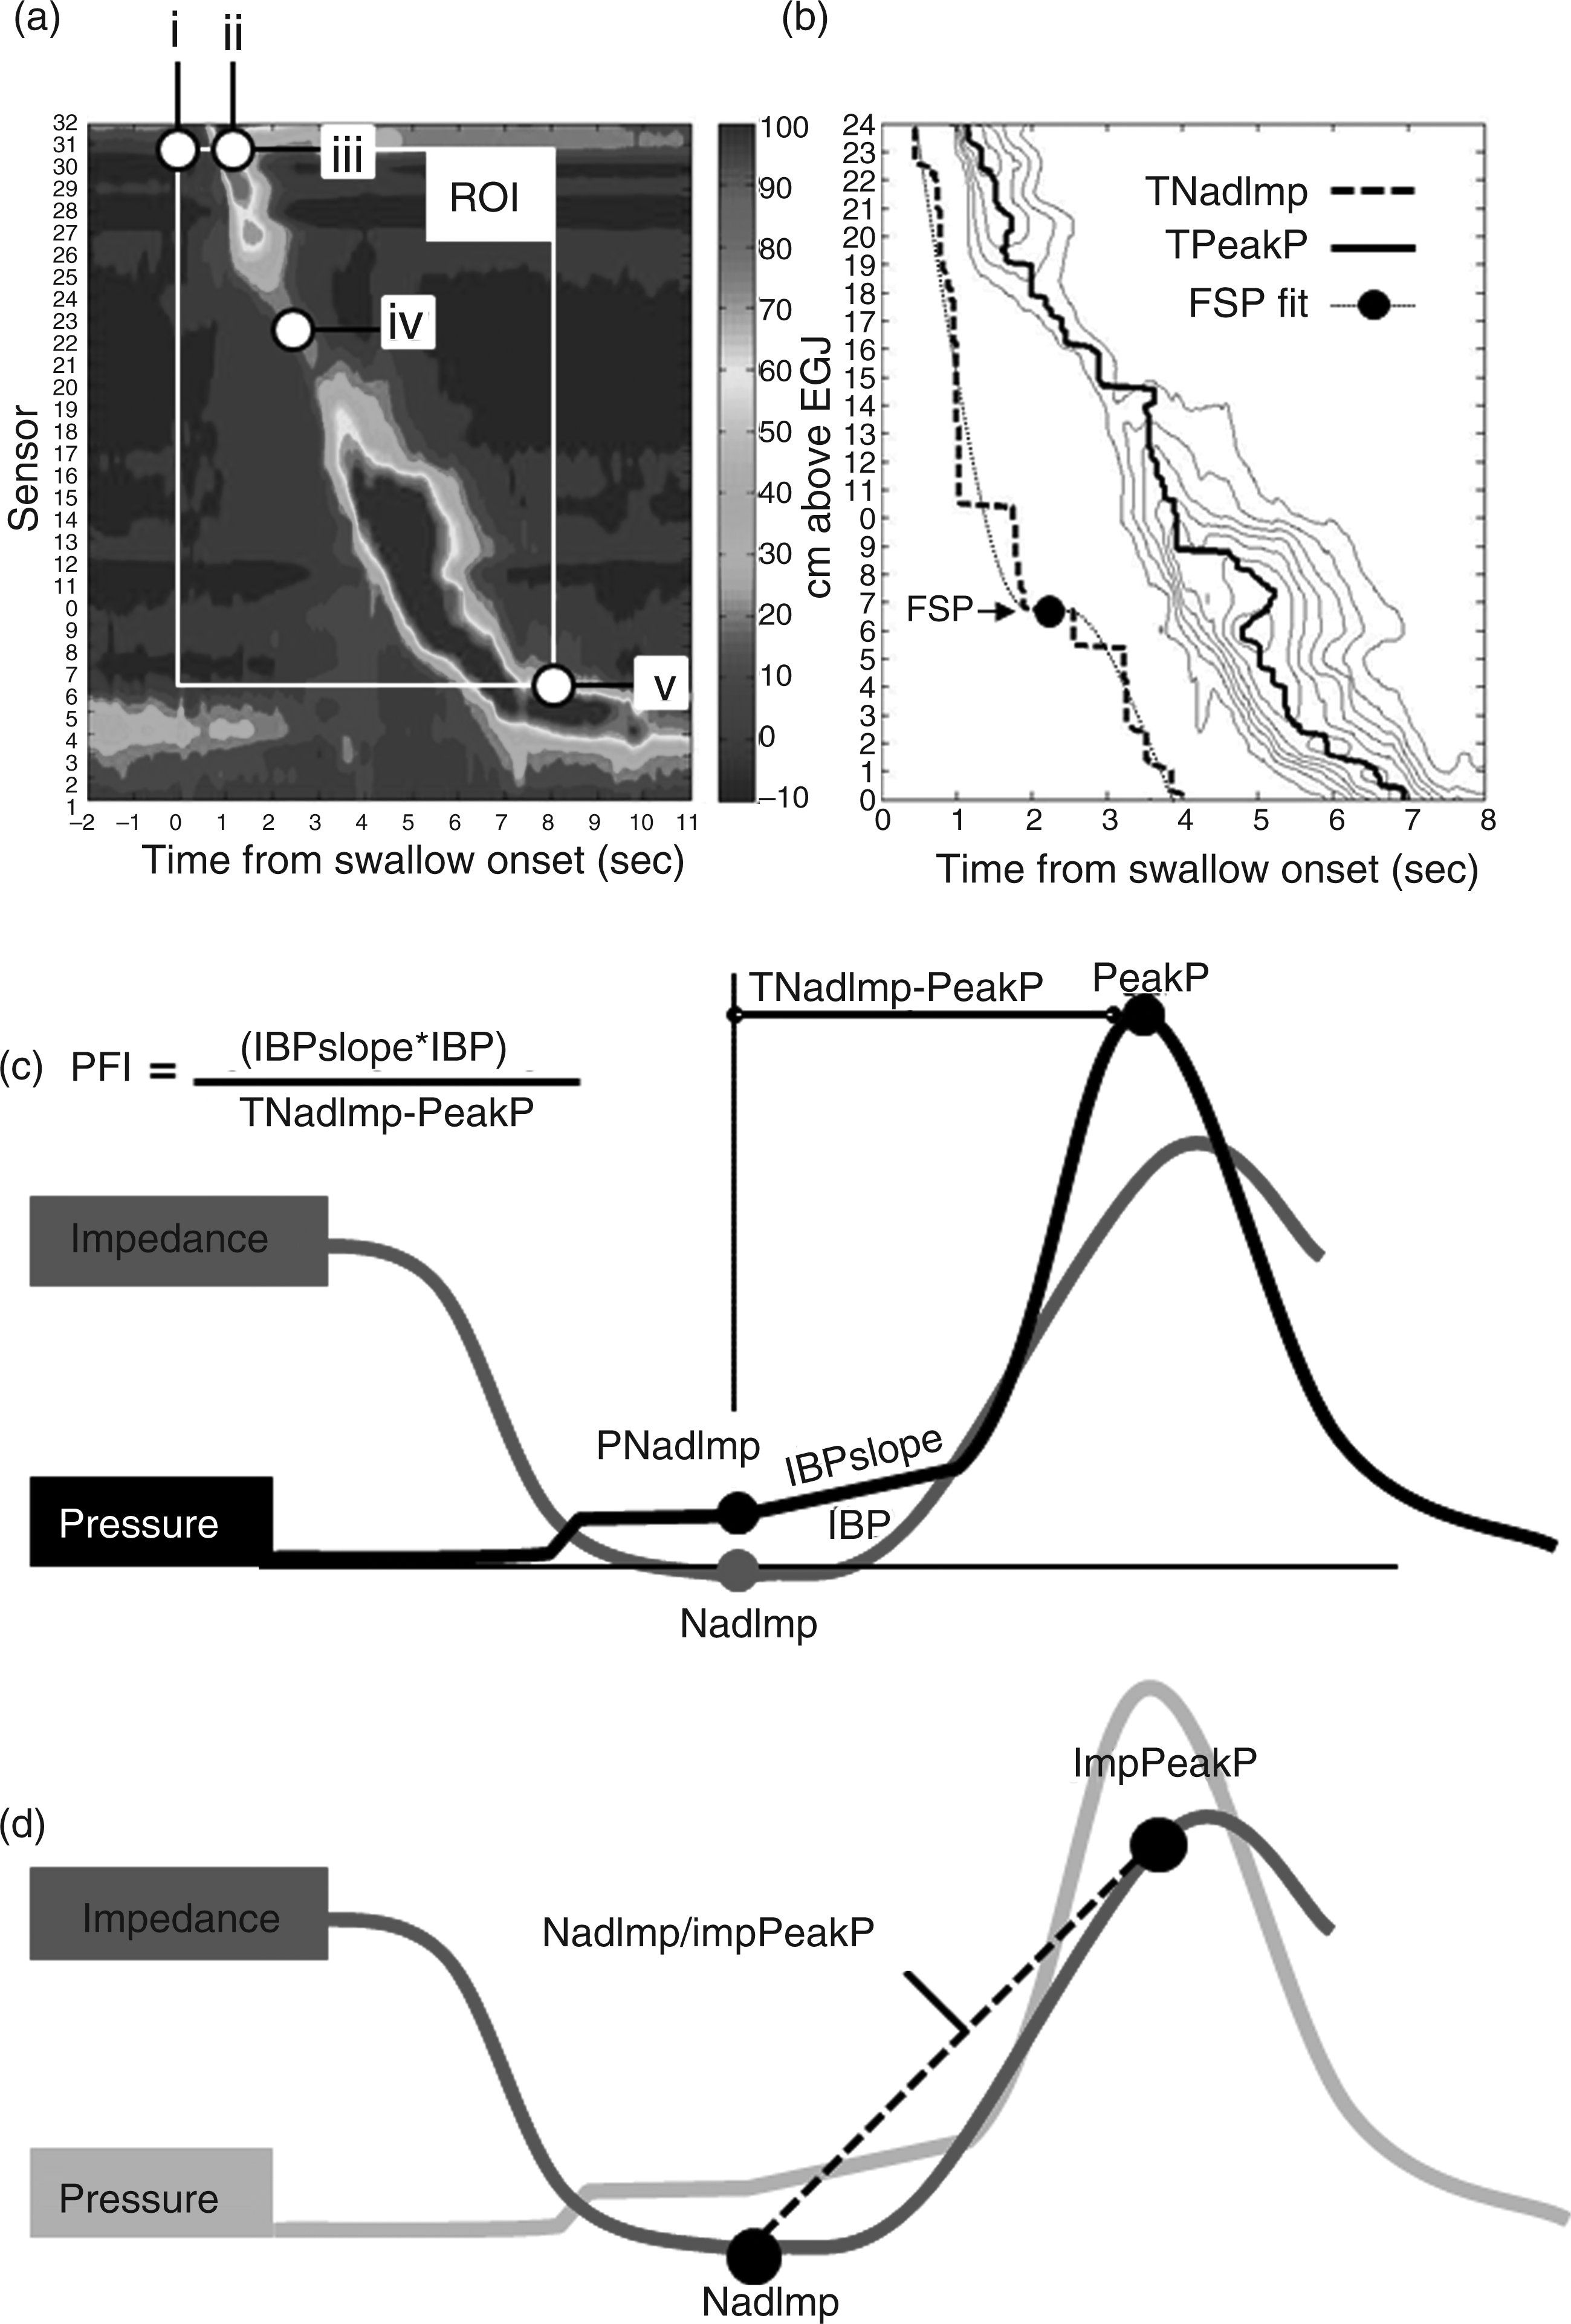
AIM analysis of the pressure–impedance text data files was performed using oesophageal AIMplot, a purpose-designed analysis program written in MATLAB (version 7.9.0.529 R2009b, The MathWorks, Natick, MA, USA). To operate Oesophageal AIMplot, the observer defined five space–time landmarks on a standard pressure iso-contour plot of the oesophageal swallow (Figure 1a). These were:
the time of swallow onset, defined by the onset of upper oesophageal sphincter relaxation, the time of peak oesophageal pressure at the orad margin of the proximal oesophagus (temporal parameter), the position of the proximal margin of the oesophageal pressure wave sequence (spatial parameter), the position of the transition zone, defined as the point of lowest pressure between proximal and distal oesophageal pressure wave sequences, or the distal margin of the proximal oesophageal contraction sequence when the distal oesophageal contraction sequence was absent or large (>6 cm), the position of the distal margin of the oesophageal pressure wave sequence (where peristalsis joins with reconstituted lower oesophageal sphincter post-relaxation pressure). Oesophageal automated impedance manometry (AIM). The pressure at nadir impedance (PNadImp, mmHg), the intrabolus pressure recorded when the oesophageal lumen is maximally full of bolus. The peak pressure (PeakP, mmHg), the pressure recorded at maximum contractile tension. The median intrabolus pressure (IBP, mmHg), the pressure recorded during the phase of transition from a full lumen to an occluded lumen, i.e. during luminal emptying. The time interval between nadir impedance (TNadImp) and PeakP (s), the time interval of transition from a maximally full lumen to maximal contractile tension. The IBP slope (mmHg/s), the rate of change in IBP recorded during the phase of transition from a full lumen to an occluded lumen. The pressure-flow index (PFI, also called the dysphagia risk index4–6), which was developed in the context of post-fundoplication dysphagia and amplifies differences in key AIM analysis metrics seen in relation to the symptom of dysphagia. The PFI is calculated using the formula PFI = (IBP × IBP slope)/(TNadImp – PeakP) and is higher in circumstances of pressure-flow abnormality. The ratio of nadir impedance to impedance at the time of peak pressure (NadImp/ImpPeakP ratio or the impedance ratio), calculated as a marker of incomplete bolus transit.
9
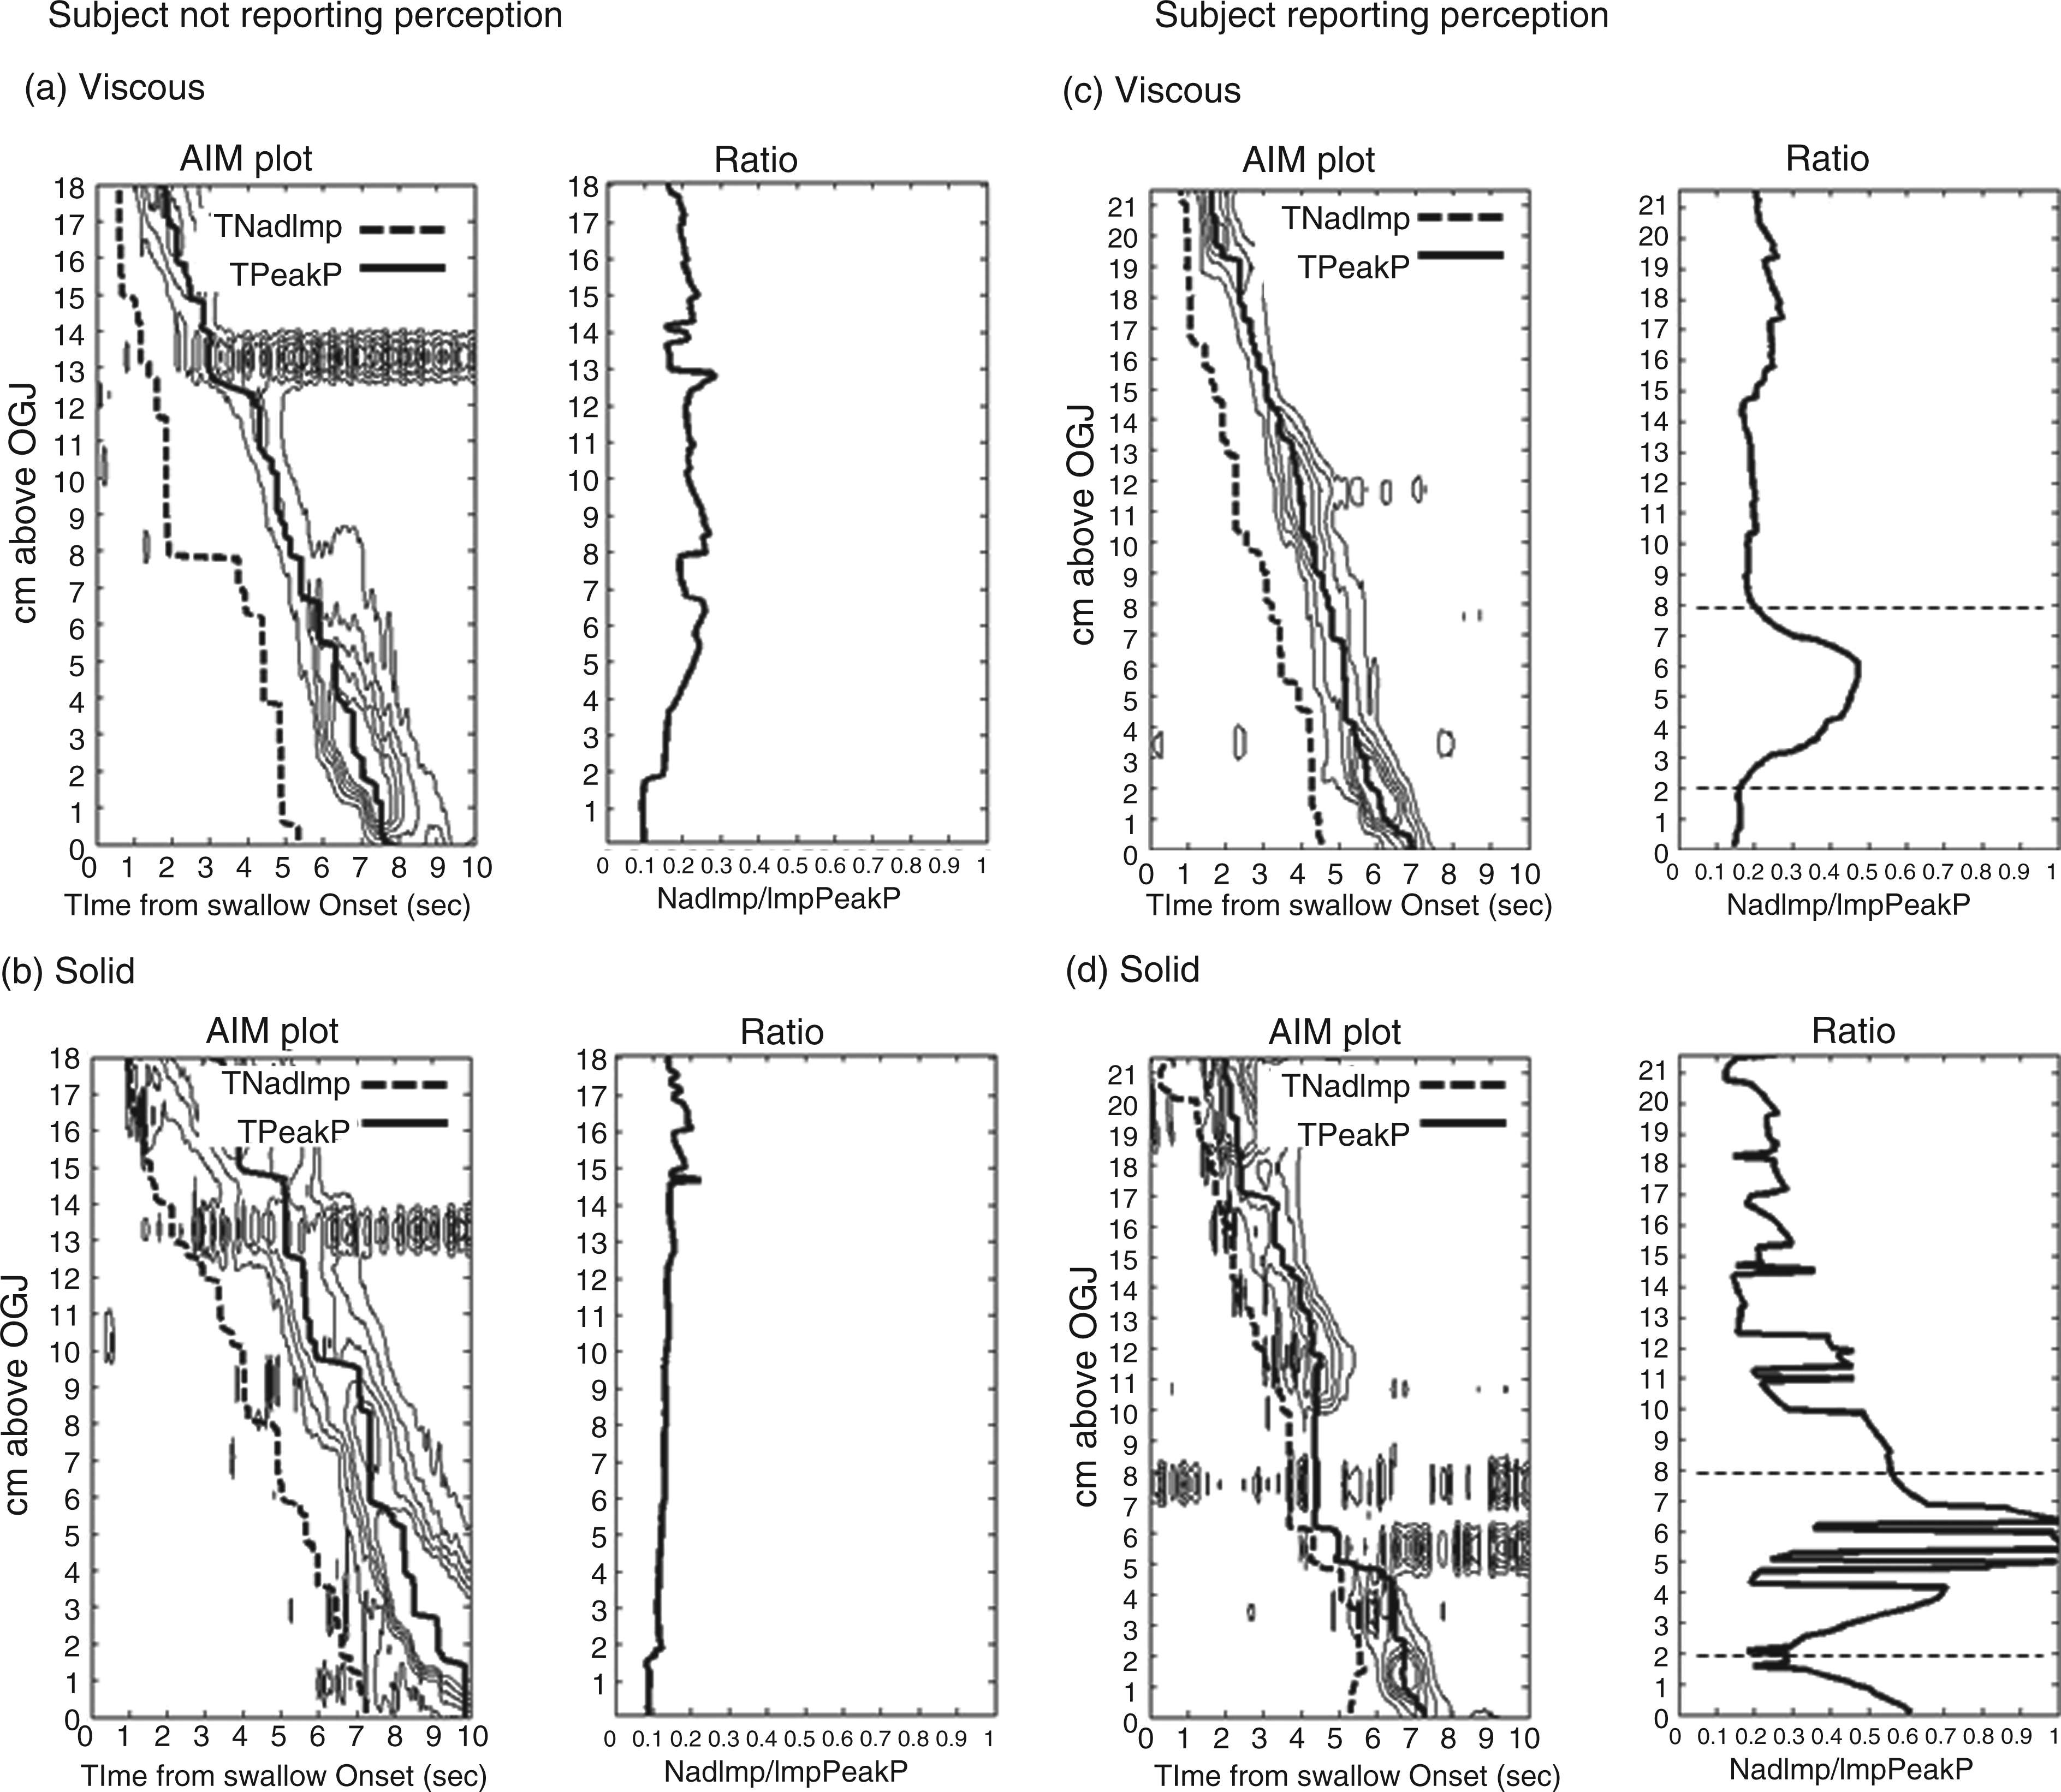
We hypothesize that the impedance ratio defines the proportion of the bolus present at the time of peak oesophageal contraction relative to the bolus present at the time when the bolus is flowing (high ratio = incomplete transit). This is illustrated in Figures 1d and 2, where the calculation of this variable along the length of the oesophagus is shown. The flow stasis point (FSP) is based on a new analysis which plots the distance a bolus is propelled into the oesophagus by a pharyngeal swallow. The FSP analysis has been previously reported
7
and uses the mean curve based on time of nadir impedance during bolus swallows to track the trajectory pathway of the bolus as it moves down the oesophagus. Typically the mean time of nadir impedance curve shows the bolus flowing rapidly, followed by deceleration, stasis, and then acceleration again before the bolus approaches the oesophago-gastric junction (OGJ) (Figure 2b). We hypothesized that the position of stasis (i.e. the position where the flow pattern changes from deceleration to acceleration) represents a switch from bolus propulsion due to pharyngeal mechanisms to bolus propulsion due to oesophageal mechanisms. The position of the FSP was objectively determined from the mean curve using the point of inflexion of a third-order polynomial best fit. The position of the FSP was estimated in cm above the OGJ and was also standardized relative to oesophageal length, which was defined as the distance from upper oesophageal sphincter distal margin to OGJ proximal margin measured during peristalsis. Calculation of the impedance ratio along the oesophagus.
Statistics
The individual swallow data determined for each subject were pooled in relation to bolus type and/or volume and then averaged for the purposes of statistical comparisons. Data are expressed as means ± standard error (SE), median ± interquartile range (IQR) or least square means ± SE. Repeated measures were compared using t-test or Mann–Whitney rank sum test and one-way repeated measures analysis of variance (Holm–Sidak method for pairwise differences) or Friedman repeated measures analysis of variance on ranks (Tukey test for pairwise differences). Non-repeated grouped measures were compared using two-way ANOVA allowing for differences related to acquisition system type and the Holm–Sidak method was used for pairwise comparisons. Relationships between continuous variables were assessed using Spearman rank order correlation. Statistical tests were performed using SigmaPlot version 11.0 (Systat Software, Chicago, IL, USA).
Results
Effect of bolus type and volume on measures of oesophageal function
Effects of bolus type and volume on analysis metrics
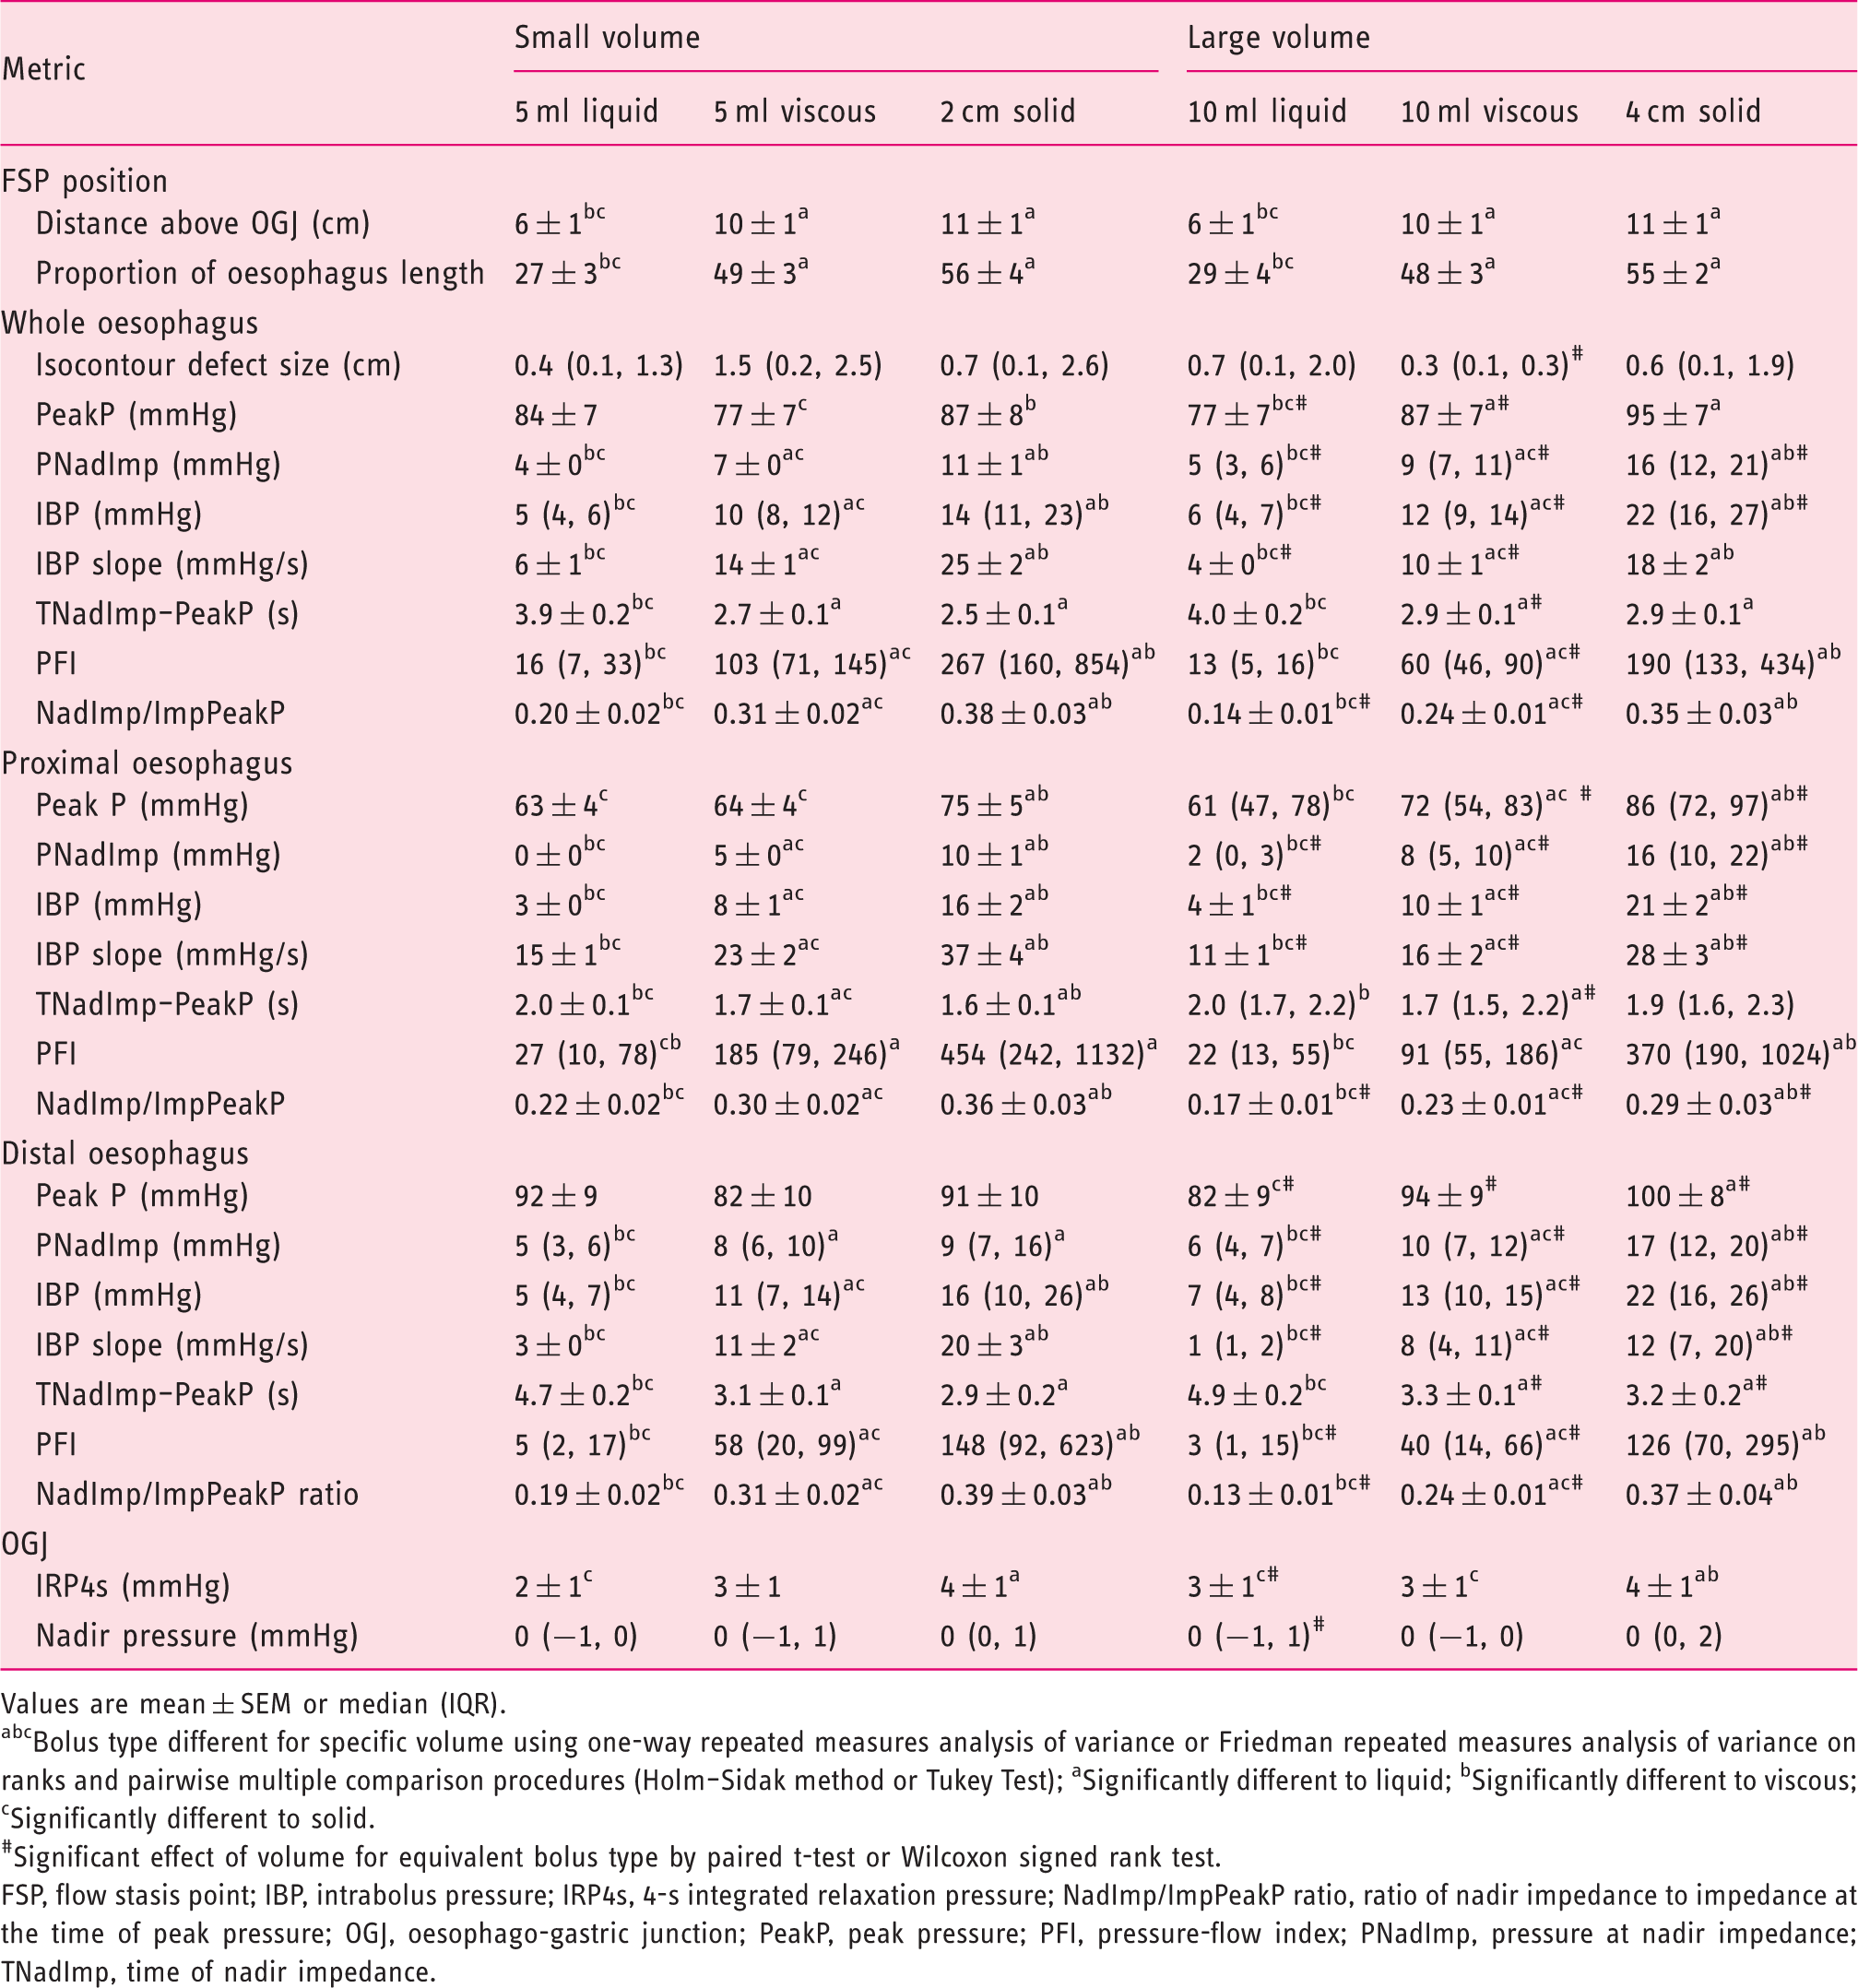
Values are mean ± SEM or median (IQR).
Bolus type different for specific volume using one-way repeated measures analysis of variance or Friedman repeated measures analysis of variance on ranks and pairwise multiple comparison procedures (Holm–Sidak method or Tukey Test); aSignificantly different to liquid; bSignificantly different to viscous; cSignificantly different to solid.
#Significant effect of volume for equivalent bolus type by paired t-test or Wilcoxon signed rank test.
FSP, flow stasis point; IBP, intrabolus pressure; IRP4s, 4-s integrated relaxation pressure; NadImp/ImpPeakP ratio, ratio of nadir impedance to impedance at the time of peak pressure; OGJ, oesophago-gastric junction; PeakP, peak pressure; PFI, pressure-flow index; PNadImp, pressure at nadir impedance; TNadImp, time of nadir impedance.
Relationship between intrabolus pressure and peak pressure amplitude
Based on a previous observation that the intrabolus pressure at nadir impedance (PNadImp) correlated with oesophageal peak pressure, 7 we investigated the impact of bolus viscosity and volume on this correlation. For measurements of the whole oesophagus, we observed that oesophageal function in response to boluses of larger volume and more viscous consistency revealed a positive correlation between PNadImp and oesophageal peak pressure (Spearman rank correlations were significant for: 5 ml viscous, r = 0.487, p < 0.05; 10 ml viscous, r = 0.669, p < 0.005; 2 cm solid, r = 0.544, p < 0.05; 4 cm solid, r = 0.618, p < 0.005). When we examined the proximal and distal oesophageal segments separately, this correlation was only present in the distal oesophagus (correlations for proximal vs. distal oesophagus respectively: 10 ml viscous, r = 0.244, p = 0.224 vs. r = 0.698, p < 0.001; 4 cm solid, r = 0.405, p = 0.07 vs. r = 0.561, p < 0.05).
Perception of solid bolus passage
The subjective perception of bolus transit was most frequently reported during swallowing of solids. Ten of our subjects reported some perception of bolus passage during at least one solid swallow. Five subjects reported a maximum perception score of 2 (i.e. awareness of normal bolus passage) whilst five reported maximum scores of 3–6 consistent with the subjective perception of bolus hold up (mean score 4). Grouping of subjects based upon levels of solid bolus perception revealed a significantly higher distal IBP slope in the subjects who reported maximum scores of 3–6 (Figure 3e). Other individual pressure-flow metrics did not achieve statistical significance for this grouped analysis, however IBP and TNadImp to PeakP, the other two metrics which are incorporated in the PFI calculation, were numerically higher (Figure 3d) and shorter (Figure 3f) respectively and this had the net effect of further amplifying the PFI overall (Figure 3g). The impedance ratio was higher in some individuals suggesting ineffective clearance on a single swallow (see example impedance ratio plots from subjects without and with perception of bolus passage in Figure 2), however the impedance ratio was not higher in relation bolus perception overall (Figure 3h). The size of peristaltic breaks (Figure 3a) and IRP4s were also not significantly different in relation to bolus perception.
Main pressure-flow metrics derived for solid boluses in subjects grouped in relation to the perception of solid bolus transit.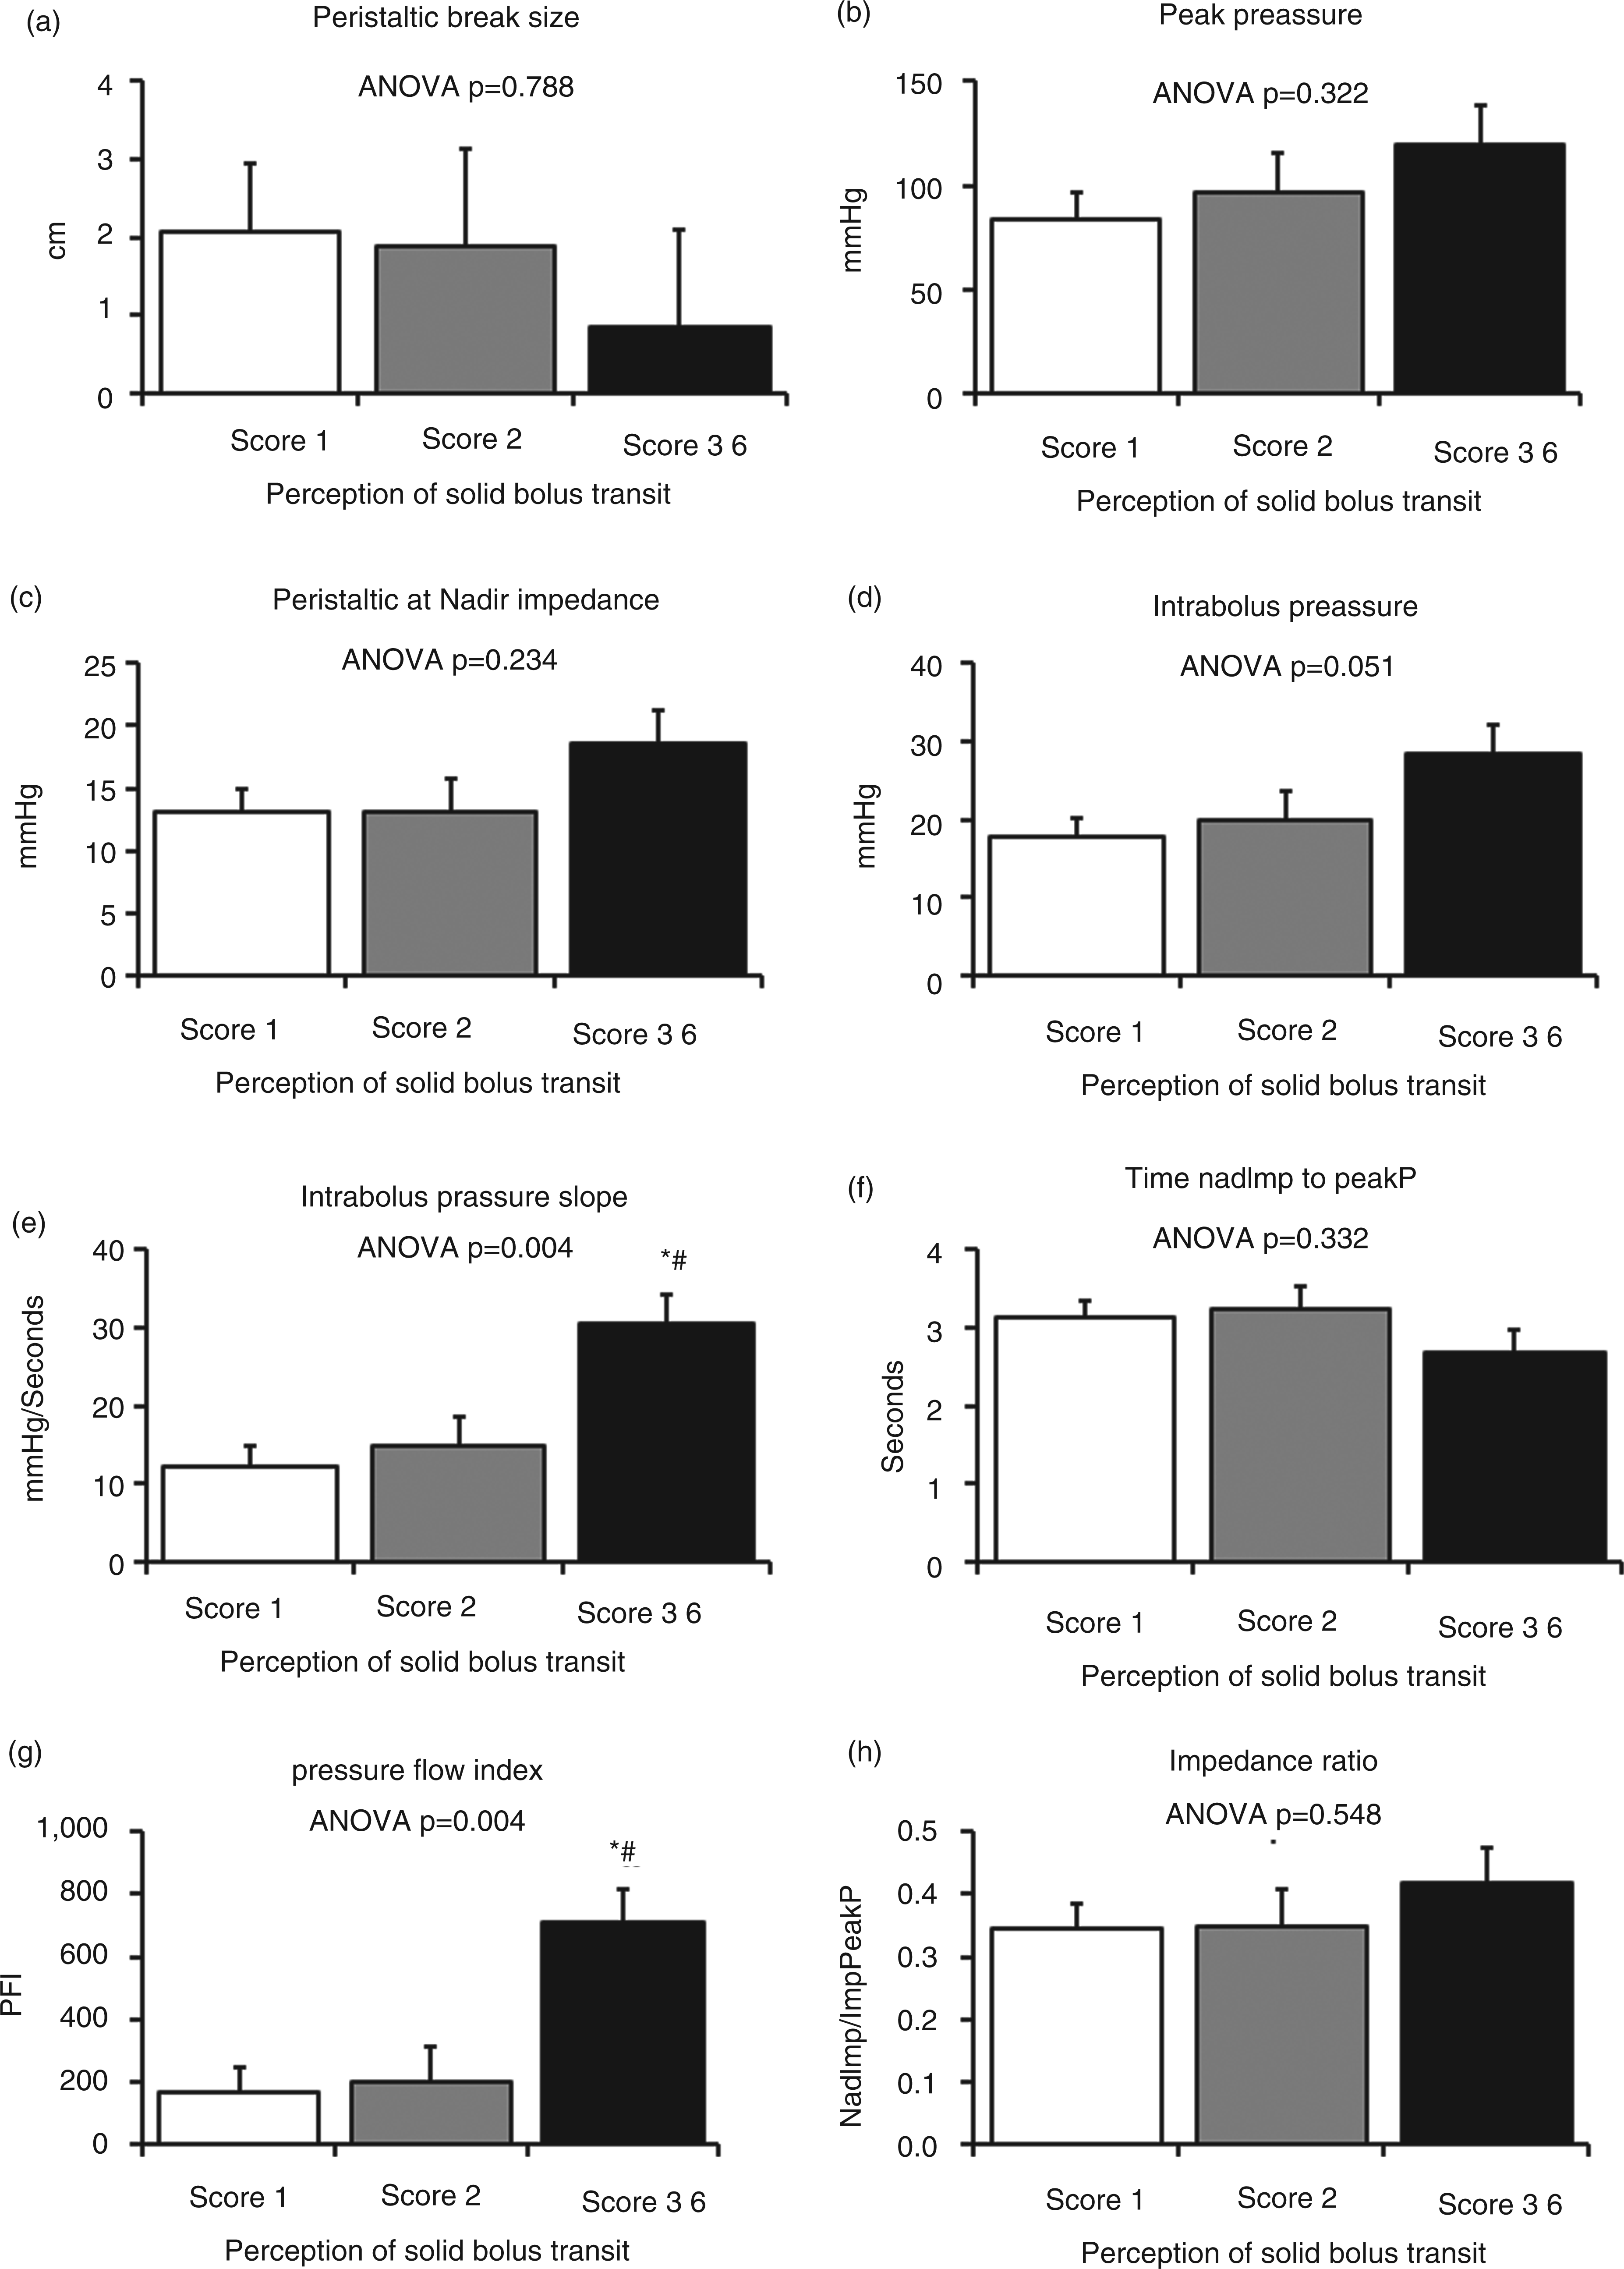
Discussion
In this study we explored the impact of bolus volume and bolus type on metrics descriptive of oesophageal function as derived by AIM pressure-flow analysis in control subjects. In addition, we observed the swallowing of high volume and/or higher viscosity boluses reveals a positive relationship between distal intrabolus pressure and oesophageal peak pressure. Finally, we report that the perception of bolus transit is associated with a higher rate of bolus pressurization.
Our first observations relate bolus characteristics to the distance a bolus is propelled by pharyngeal swallow alone. Whilst a previous study has investigated the temporal distribution and pattern of clearance for a bolus in relation to pharyngeal propulsion using scintigraphy, 11 in our assessment we utilized impedance measurements via calculation of the FSP from the bolus trajectory curve (based on the timing of nadir impedance). We put forward that the position of the FSP corresponds to the spatial location of switch from pharyngeal-driven to oesophageal-driven bolus transport. 7 Increasing bolus viscosity resulted in the FSP being located more proximally. Hence, a viscous bolus that is more resistant to movement and therefore harder to propel is not carried as far by pharyngeal propulsion. This places greater demands on oesophageal peristalsis to transport the bolus over a longer distance from the point of stasis to OGJ, increasing the likelihood of transport failure in relation to the presence of peristaltic breaks.
Another interesting finding emerging from this study was the relationship between higher intrabolus pressures recorded when the lumen is maximally full with accumulated bolus (pressure at nadir impedance) and higher oesophageal contractile pressure (peak pressure) amongst study subjects. The relationship was demonstrable with viscous and solid challenges only, and higher volumes demonstrated greater statistical confidence, therefore requiring bolus challenges not routinely used in clinical manometry testing (i.e. 5 ml liquid). A similar relationship has been previously described in response to the outlet flow resistance produced following fundoplication surgery;12,13 however, in this study no obstruction was present. In the non-obstructed OGJ setting, peak pressures should not determine intrabolus pressures because pressure peak generation is located above the intrabolus pressure domain.14,15 Hence our observation suggests that higher peak pressures may be occurring in response to higher intrabolus pressures, specifically those pressures which correspond to the lumen being maximally full.
The observation that muscle tension during peristaltic contraction is coupled to physical characteristics of the bolus being transported is not new. The exploration of such phenomena has been a major focus of past studies and it is generally accepted that there are two possible explanations for this relationship. Firstly, smooth muscle will contract more forcefully in circumstance of increased muscle length–tension prior to contraction, called pre-load (e.g. larger volumes, which fill the lumen more, increase pre-load and therefore greater contractile force is generated), as well as during contraction onset, called after-load (heavier, more solid consistencies, which are harder to empty, increase after-load and therefore greater contractile force is generated). 16 The second explanation for a correlation between intrabolus pressure and peak pressure is that the presence of a bolus may stimulate local stretch receptors, modulating peristalsis via an intrinsic reflex. As demonstrated by Dodds and colleagues, 17 bolus swallows, compared to dry swallows, produce higher peak pressures, longer contraction durations, and a slower rate of progression of the peristaltic pressure wave and these effects are more pronounced in the distal oesophagus. Similar findings were described more recently for viscous swallows in comparison to liquid swallows when using combined manometry and impedance. 18 Ren and Schulze-Delrieu 19 also made similar observations in relation to peristalsis in the isolated opossum oesophagus following the application of radial stretch by balloon distension or with weights. Whilst the initiation of primary peristalsis occurs via a central pathway and, by definition, pharyngeal swallow is essential for it to occur in vivo; normal oesophageal functioning may also rely upon secondary compensatory mechanisms which regulate peristalsis whilst in progress, compensating for the increased demands of higher volume and greater solid consistency boluses by augmenting descending inhibition (facilitating bolus passage) and in turn, ascending excitation (facilitating bolus clearance). In relation to the existence of such mechanisms, we also note the descending oesophageal peristaltic reflex in the opossum described by Paterson and Indrakrishnan 20 and the intrinsic wave of descending inhibition that precedes contraction of the distal oesophagus, recently described in human subjects by Abrahao and colleagues. 21
An interesting new finding in this study was the relationship between altered pressure-flow metrics and bolus perception. Perception of bolus passage was reported by half of the subjects and this was almost always in relation to solids. In this case we are examining subclinical levels of bolus perception that clearly are not troublesome (healthy controls with nil dysphagia). Nevertheless, in a controlled laboratory setting, the subjects were able to report levels of bolus perception which appeared to correlate with increased bolus pressurization (higher PFI).
The impedance ratio, relating nadir impedance to peak pressure impedance, is a new AIM analysis metric that may have diagnostic relevance as a single measure elevated in relation to ineffective bolus clearance. A higher ratio correlates with failed bolus clearance as determined by conventional impedance analysis (whereby each channel is individually analysed for clearance failure based on prolonged bolus clearance time at one or more sites). 9 Being a continuous measure rather than based on the categorization of complete bolus transport (or not), this new metric may also better reflect the extent of bolus clearance failure.
The pressure-flow index calculation, based on multiple AIM metrics, is an attempt to allow the multifactorial causes of dysphagia symptoms to be embodied in a single predictor. This index captures the cumulative effects of subtle differences in the individual metrics. The PFI was developed in the setting of predicting post-fundoplication dysphagia.4,5 In essence, the PFI reflects flow resistance/bolus pressurization as the bolus passes through the distal oesophagus towards and through the oesophago-gastric junction. Reduced speed of bolus movement, reduced diameter/luminal relaxation, and/or reduced OGJ opening should, in theory, increase the PFI. We have previously demonstrated that patients with non-obstructive dysphagia have an elevated PFI compared to controls; this is driven by differences in all three PFI variables (shorter TNadImp to PeakP and higher median IBP and IBP slope). 6 Of these key metrics, higher IBP slope was the only one significantly altered in relation to perception in the current study, being higher in subjects who reported more intense perception of bolus transit. IBP slope is a complex metric and was designed to quantify the rate of pressure change during transition from a full lumen to an occluded lumen. Further studies combined with fluoroscopy are needed to better understand this and the other metrics we measure with our method.
Heightened bolus perception was not associated with standard high-resolution impedance-manometry metrics, such as isocontour defect size or higher IRP4s, and neither was the impedance ratio significantly altered in relation to bolus perception. Together these observations suggest that factors such as weak peristalsis, OGJ resistance, and/or ineffective bolus clearance are not responsible for inducing bolus transit perception. This study is, however, based on normal subjects and further high-resolution impedance-manometry investigations with our new analysis approach need to be undertaken in patients with dysphagia symptoms. Nevertheless, it should be recognized that the patterns of change in the different pressure-flow metrics, seen here in relation to bolus perception, are consistent with those previously described for dysphagia patients in previous pilot studies which utilized pressure–impedance measurements of low spatial resolution in conjunction with the administration of viscous boluses.4–6,9
In conclusion, we report that bolus volume and bolus viscosity impact oesophageal function and thus alter AIM analysis metrics. More challenging high-volume/heavy-viscosity boluses, more akin to real-life scenarios, reveal relationships between intrabolus pressures and oesophageal peak pressures that suggest an active modulation of peristalsis during bolus transport. Finally, perception of bolus hold up was associated with AIM analysis pressure-flow metrics indicative of heightened bolus pressurization during the phase of transition from a full lumen to an occluded lumen. These observations warrant further validation and exploration in patient populations reporting symptoms of dysphagia.
Footnotes
Funding
This research received no specific grant from any funding agency in the public, commercial, or not-for-profit sectors.
Conflict of interest
TIO has received research funding and consultancy fees from Sandhill Scientific. Sandhill Scientific equipment was used in the study. TIO and NR hold a Patent on AIM analysis methods.