
Abstract
Background:
Despite the availability of directly observed treatment short-course, which provides free treatment to patients with tuberculosis, leading to some progress, Nigeria still faces a slow decline in tuberculosis incidence and low case detection. The delay in diagnosis of pulmonary tuberculosis, regarding access to healthcare, has made extensive efforts towards its control and elimination appear unrewarding. This study aimed to assess the relationship between family dynamics and diagnostic delay among patients with pulmonary tuberculosis receiving care in the directly observed treatment short-course centres in Ile-Ife, Nigeria.
Methods:
A descriptive cross-sectional study of 282 patients on treatment for pulmonary tuberculosis in the directly observed treatment short-course centres in Ile-Ife was conducted. The respondents were recruited using a multistage sampling technique. Data were collected using an interviewer-administered World Health Organization-validated questionnaire on case-finding in tuberculosis patients, the Perceived Social Support Family Scale, and the family adaptability, partnership, growth, affection, and resolve (APGAR) score. Multiple logistic regression was done to determine the family dynamics variables that independently predict diagnostic delay. A p < 0.05 was taken as statistically significant.
Results:
The family dynamics of the respondents showed that 68.1% of them had strong family support, with about two-thirds (69.1%) having functional families. The median diagnostic delay before diagnosis was 45 days (range 9–217 days). Having a dysfunctional family (Adjusted Odd Ratio (AOR), 3.87; 95% confidence interval, 1.704–8.777, p = 0.001), monthly family income <₦30,000 (US$56.07; AOR, 2.96; 95% confidence interval, 1.358–6.453, p = 0.006), and family size larger than 6 (AOR, 2.223; 95% confidence interval, 1.212–4.076, p = 0.010) were significant predictors of prolonged diagnostic delay.
Conclusion:
Family factors predicting diagnostic delay were large family size, low family income, and family dysfunction. There is a need to increase tuberculosis diagnostic access to families with these characteristics.
Introduction
Tuberculosis, though a preventable and treatable disease, has remained a major global health problem despite extensive control efforts. 1 Above HIV/AIDS, it is the second most common infectious agent-related cause of death worldwide. 2 The World Health Organization (WHO) estimated that in 2022, 10.6 million people fell ill with tuberculosis (TB) globally, of which 7.5 million cases were notified, with over 1.3 million deaths. 2 Nigeria ranked sixth among the 30 high-burden countries in TB, TB/HIV, and drug-resistant TB with an annual estimated incidence of 219/100,000 population (including HIV-positive people) and a death rate of 44.7/100,000 population. 2 In Osun State, Nigeria, TB was found to be 27.5% prevalent, 10.5% of which was multidrug-resistant TB. 3 The coverage of GeneXpert MTB/RIF services per local government area (LGA) in Osun State is 37%, which is far behind Lagos and Abuja, which have 100% coverage. 4
The directly observed treatment short-course (DOTS) strategy is a major intervention in controlling this situation. With the adoption of the public–private mix, DOTS coverage has increased in all the health facilities in Nigeria.5,6 This increase, however, is not matched by a concomitant increase in case detection and a satisfactory decline in TB incidence.7,8 This poor case detection is due, among other things, to delays in seeking healthcare.6,9 This fuels continuous TB transmission, making control and elimination difficult.10,11
Ukwaja et al. noted a prolonged median total delay of 11 weeks before the diagnosis and initiation of treatment among patients with pulmonary TB (PTB) in Nigeria. 6 Various published works have classified the delays in the diagnosis of PTB as being either patient or health system factors, with most of them relating the delays to the patients’ health-seeking behavior, TB stigma, and distance from the health facilities.12–14
A coordinated approach integrating family support with clinical services has been identified as a panacea to ending the TB epidemic and ensuring its elimination targets.15,16 The studies by Rosado-Quiab et al. and Putra et al. reported a direct positive effect of family system characteristics and family support on early diagnosis and treatment of PTB.15,17 The family and its dynamics are important determinants of the therapeutic success of TB treatment and control being the first to notice the symptoms of PTB in a member.18,19 Family dynamics is the pattern of interaction among members of a family concerning their individual goals and preferences. 20 Assessing family dynamics encompasses multiple dimensions, including family structure, functioning, roles, communication patterns, emotional bonding, adaptability, conflict resolution, problem-solving ability, financial capability, size, and boundaries. No single assessment tool comprehensively covers all these aspects; therefore, employing a combination of standardized instruments is often necessary for a thorough evaluation. 20 This approach is supported by the development of various tools designed to measure specific facets of family dynamics. In clinical practice, it is assessed by the family characteristics, family developmental stage, family support, and functioning.15,21,22
Given the paucity of studies that assessed the influence of family dynamics on diagnostic delay among patients with PTB, a better understanding of their family dynamics is crucial to understanding why a disease like TB, with free treatment, has not been eliminated and is still associated with significant morbidity and death. Diagnostic delay, as opposed to patient delay, provides a more comprehensive measure of the barriers to timely TB diagnosis. While patient delay focuses only on the time taken by individuals to seek medical attention after symptom onset, diagnostic delay encompasses both patient delay and doctor delay, capturing the full spectrum of factors contributing to late diagnosis. 8 Diagnostic delay assesses the combined impact of individual, social, and healthcare system-related barriers rather than isolating only patient behavior.
Both patient and doctor delay can be influenced by family dynamics. 19 Family support or interference can play a crucial role in healthcare-seeking behavior and access to timely diagnosis. 18 For example, family encouragement may facilitate faster medical visits, adherence to referrals, and persistence in seeking care if initial consultations are inconclusive. Conversely, family-related constraints, such as financial dependence, stigma, or competing household responsibilities, may delay follow-ups, influence healthcare choices, or lead to misinterpretation of symptoms, contributing to doctor-related delays. Additionally, in certain cultural contexts, family decision-making power—especially among women—may affect when and where patients seek care, thereby influencing interactions with healthcare providers.
This study was conceptualized based on the modified Anderson model of health behavior, the social network-based theory, and the three-delay model. These explained how human social network and family support influence their health-seeking behavior in the face of health challenges like PTB.23–26 The study aimed to assess the family dynamics of patients receiving treatment for PTB in the DOTS centers in Ile-Ife and to determine the relationship between family dynamics and the diagnostic delay among them.
Materials and methods
Study design and study site
The study was a descriptive cross-sectional study of patients in the DOTS centers in Ile-Ife, Osun State, Southwest Nigeria. The two LGAs in Ile-Ife are Ife Central LGA and Ife East LGA, with a population of 167,254 and 188,087, respectively. 27 The passive case-finding strategy, which only identifies TB patients who present with symptoms at medical facilities, is used to find TB cases in Osun State, as it is in other states in Nigeria and other nations with high TB burdens. 28
There are 12 major DOTS centers in Ife Central LGA and 18 in Ife East LGA. Out of the 30 centers in the 2 LGAs, 10 were selected for this study. Although there are subtle differences in the organization of the DOTS centres, their basic facilities are a room where the DOTS officers attend to the patients and consulting room(s). In most cases, these rooms have multiple windows for cross-ventilation and ceiling fans to aid airflow. The DOTS centers operate from Monday to Friday between 8:00 am and 4:00 pm, serving the patients within the catchment of the health centers or hospitals in which they are situated. Some other patients come from the neighboring villages and towns outside the two LGAs. Those situated in the hospitals have additional call-hour services for outpatients and inpatients who need to be commenced on treatment. The DOTS centers in the primary healthcare (PHC) centers are run by community health officers and community health extension workers, while those in the hospitals are run by nurses and physicians. Tuberculosis treatment involved daily attendance for 2 months in the intensive phase, which is followed by fortnightly attendance for the 4 months of the continuation phase.
Study population
The study population included patients aged 18 years and above who were on treatment for PTB in the DOTS centers in Ile-Ife, Osun State. The study duration was between 20 May 2021 and 20 August 2021.
Selection criteria: Consenting adult patients who were aged ⩾18 years in either the initiation or continuation phases of treatment were included in the study. Severely ill patients who may not provide reliable information, patients with extrapulmonary TB, and those who have been previously treated for TB were excluded.
Sample size and sampling technique
The minimum sample size was determined using the following formula 29 ;

Where z = standard deviation of 1.96, which corresponds to a 95% confidence interval (CI); p = 0.789 (published local prevalence of strong family support among TB patients 78.9%) 30 ; q = 1 − p = 0.211; d = desired level of precision (maximum error of estimate) = 0.05%; n = the minimum sample size. Therefore, p = 0.789, q = 1 − 0.789 = 0.211, z = 1.96 at 95% CI and d = 0.05 at precision level of 5%. Using the above formula, n = 255.8 ≈ 256. To adjust for nonresponse, 10% of the calculated sample size was added. This gave a minimum sample size of 282. Therefore, 282 respondents were recruited for the study.
A multistage sampling approach was used for this study. In the first stage, a simple random sampling technique was used to pick five DOTS centers in each LGA. The second stage was the selection of samples of respondents using the numbers determined by the calculated proportional allocation. This was based on the average number of patients seen in each DOTS center in the preceding 3 months as obtained from the state’s TB register. The number of eligible patients seen in the five selected DOTS centers in the Ife East LGA was OAUTHC-34, PHC Ajigbore-4, PHC Itaasin-8, State Hospital Oke-Ogbo-9, and PHC Otubu-4, making a total of 59 patients. The number of patients seen in the five selected DOTS centers in the Ife Central LGA was SDAH-4, PHC Aderemi-2, PHC Arubiewe-7, PHC Gbalefefe-7, and PHC Enuwa-43, giving 63 patients. In all, 122 patients with PTB were seen in the 10 selected DOTS centers. The proportional allocation was derived as calculated below:

This was as Ife East LGA: OAUTHC-79, PHC Ajigbore-9, PHC Itaasin-18, State Hospital Oke-Ogbo-21, and PHC Otubu-9. For Ife Central LGA, this was given as SDAH-9, PHC Aderemi-5, PHC Arubiewe-16, PHC Gbalefefe-16, and PHC Enuwa-100. A total of 282 respondents were recruited. Consecutive consenting respondents in each center were recruited until the required sample size was reached.
Data collection
Before the commencement of the study, the members of the research team were trained for a week in the conduct of interviews and data collection. Practical scenarios were created using simulated patients. After the training, each field worker administered the questionnaire to TB patients. A Cohen’s weighted kappa score analysis was performed on the results to identify intra- and inter-rater variability. Cohen’s weighted kappa scores for the trained interviewers were above 0.90.
The list of patients in the initiation and continuation phase of treatment was retrieved from the DOTS register in each of the selected clinics. Eligible patients who were already on treatment in each of the DOTS centers were called on the phone and given appointments to come to their DOTS centers on the days chosen for each DOTS center. Each consecutive eligible patient was informed of the study. Written consent was obtained. Consecutive consenting respondents were subsequently interviewed by the researchers and their trained field workers until the allocated sample was obtained. Other patients who were newly diagnosed during the study period were seen in the DOTS centers at enrolment or on their drug pick-up days.
Data were collected using a pretested interviewer-administered questionnaire with three sections: sociodemographic characteristics, assessment of diagnostic delay, and assessment of the respondent’s family dynamics. Section A assessed the sociodemographic data, which include age, gender, religion, ethnicity, occupation, level of education, distance to the nearest TB treatment centre, and place of residence. Section B assessed diagnostic delays with a WHO-validated questionnaire on case-finding in TB patients. 8 It assessed the length of the different types of delay, HIV status, sputum smear result at diagnosis, first action taken when seeking care, satisfaction with care, TB knowledge, and stigma. Section C assessed the respondents’ family dynamics through the family characteristics, perception of family support using the Perceived Social Support Family (PSS-Fa) Scale, and perception of family functioning using the Family APGAR score.
The PSS-Fa is a measure of perceived family support consisting of 20 questions that have been validated to assess the feelings and experiences of the respondents with their families. 31 The Cronbach’s Alpha coefficient of the instrument is 0.88–0.91, indicating good reliability and validity. 32 The response may be “yes,” “no,” or “don’t know.” Each “yes” response is scored 1. Any other response was scored 0. Items 3, 4, 16, 19, and 20 in the questionnaire were reverse-scored (a “no” response was scored as 1). The family support of each respondent was determined by the summated scores. These could be up to 20. Scores ⩾11 denote strong family support, scores 7–10 denote weak family support, while scores ⩽6 mean no family support. 31
Family APGAR means adaptability, partnership, growth, affection, and resolve. A recent analysis of the validity of the Family APGAR questionnaire rated its Cronbach’s alpha coefficient to be 0.819, which is indicative of good validity and reliability. 33 It is a validated measure of family functioning that has five items to which participant answers “hardly ever,” “sometimes,” or “almost always” based on their frequency of feeling satisfied. 34 “Hardly ever,” “some of the times,” and “almost always” were scored as 0, 1, and 2, respectively. The total score ranged from 0 to 10. For the present study, scores of <6 were taken as family dysfunction, while 6–10 indicated a functional family. 31
The study instrument was available in English, but it was translated into the Yoruba language for non-English speaking respondents. The questionnaire was translated from English to the Yoruba language by a linguistics expert and back-translated from the Yoruba language to the English language by another independent linguistics expert for comparison. For the Hausa-speaking respondents, their accompanying family members served as translators. The majority of them could speak either Yoruba or English.
Data collection was done in a separate well-ventilated consulting room, on an individual basis, to respect respondents’ privacy. During the interview, the windows and doors were left open to facilitate good air exchange. This was aided by fans when available to help redistribute the air. The interviewers sat near the fresh air source, while the respondents were made to sit near the exhaust location. The interviewers and the respondents wore facemasks during the interview. Besides, cough etiquette and respiratory hygiene were encouraged during the interview. The respondents were assisted in their recall efforts to avoid bias by using a calendar of locally important events and other probing techniques.
Operational definition of terms
Patients’ delay: The time in days from the onset of TB symptoms (cough) to the first presentation to a formal health provider. 8
Doctor delay: This is the time interval between the first presentation to a formal healthcare provider and the confirmation of TB diagnosis. 8
Diagnostic delay: The time interval in days between the first onset of TB symptoms and the first confirmation of TB. It includes both patient delay and doctor delay. 8
Formal healthcare providers: Modern healthcare facilities such as clinics, health centers, and hospitals that are owned by the government or private health facilities. 8
Data analysis
Data were coded, entered, and subsequently analyzed using the Statistical Product and Service Solution (SPSS) software version 25 (SPSS, Chicago, IL, USA). The dependent variable was the diagnostic delay. The independent variables were family characteristics, PSS-Fa score, and family APGAR score. Descriptive statistics were calculated for all variables. Categorical variables were expressed in proportions and percentages, while continuous variables were expressed in means and standard deviations.
The diagnostic delay was analyzed using the median and interquartile range because its length was not normally distributed. The median of the sample scores was used as a cut-off value for diagnostic delay, as described by the WHO. 8 The participants whose diagnostic delay was below the median diagnostic delay were regarded as having “no prolonged diagnostic delay,” while those whose diagnostic delay was up to or above the median diagnostic delay were regarded as having “prolonged diagnostic delay.”
The family support of each respondent was categorized using the summated scores of the PSS-Fa. The maximum obtainable score was 20. Scores ⩾11 denoted strong family support, scores 7–10 denoted weak family support, while scores ⩽6 meant no family support. 31 Family APGAR was categorized using the total score that ranges from 0 to 10, with scores of <6 taken as family dysfunction, while 6–10 indicated a functional family. 31
The factors related to diagnostic delay were assessed by conducting a bivariate analysis using the chi-square test to examine the association between the independent variables (sociodemographic characteristics, patient factors, health system factors, PSS-Fa score, family APGAR score, and other family characteristics) and the dependent variable (diagnostic delay). Multiple logistic regressions were conducted to investigate independent variables that were significantly associated with the diagnostic delay on bivariate analysis. For all statistical analyses, p < 0.05 were considered statistically significant.
Ethical considerations
Ethical approval was obtained from the OAUTHC, Ile-Ife Ethical Review Committee. Administrative approval was obtained from the Osun State Ministry of Health, Osogbo, and the Medical Directors for the use of the PHC centres and the participating hospitals, respectively. Informed consent was obtained from the eligible respondents before recruitment into the study. Confidentiality of all information was assured by maintaining the anonymity of questionnaires, names, and other means of identification having been coded. Each participant retained the right to withdraw from the study at any point in time without any prejudice or penalty. Each study participant was given a token of ₦1000 (~$2.00) to cover their cost of transportation to the DOTS centers
Results
Sociodemographic characteristics of the respondents
Of the 294 patients screened for eligibility (Figure 1), three were unreachable by phone, and one declined consent. Eight of the remaining 290 patients were excluded from the study because three of them were on admission for severe disease and another five were being retreated. A total of 282 patients were recruited as respondents for the study. Of this number, 187 respondents were on treatment before the commencement of the study and 95 respondents were diagnosed during the study period.

A flow chart showing the study protocol.
The mean age of the respondents was 40.32 ± 14.86 years, with more than half of them (55.7%) being <40 years old (Table 1). About three-quarters of the respondents (74.0%) were of the Yoruba tribe. A larger proportion (33%) of the respondents were artisans or laborers. Literacy level was very high, as the majority (83.3%) of the respondents had at least a primary school education. Most of the respondents (63.8%) lived in the urban areas, covering ⩾10 km to reach the TB treatment centers.
Sociodemographic characteristics of the respondents.

TB: tuberculosis.
Others are Igala, Igede, Fulani, zabarma, Idoma, and Ijaw.
Family dynamics of the respondents with pulmonary tuberculosis
Most participants were married, 162 (57.4%; Table 2). Of those who were married, the majority (80.2%) were in monogamous unions. A family size of two to six persons was more commonly found (72.0%) among the respondents. The mean family income was ₦87,556.74 ± ₦72,594.95 or US$163.66 ± US$135.69. A larger percentage, 223 (79.1%) of the respondents earned up to or above the minimum wage of ₦30,000 or US$56.07. The perceived family support of the respondents was assessed to be strong (68.1%), weak (28%), and none (3.9%). About two-thirds (69.1%) of the respondents came from functional families.
Family dynamics of the respondents with pulmonary tuberculosis.
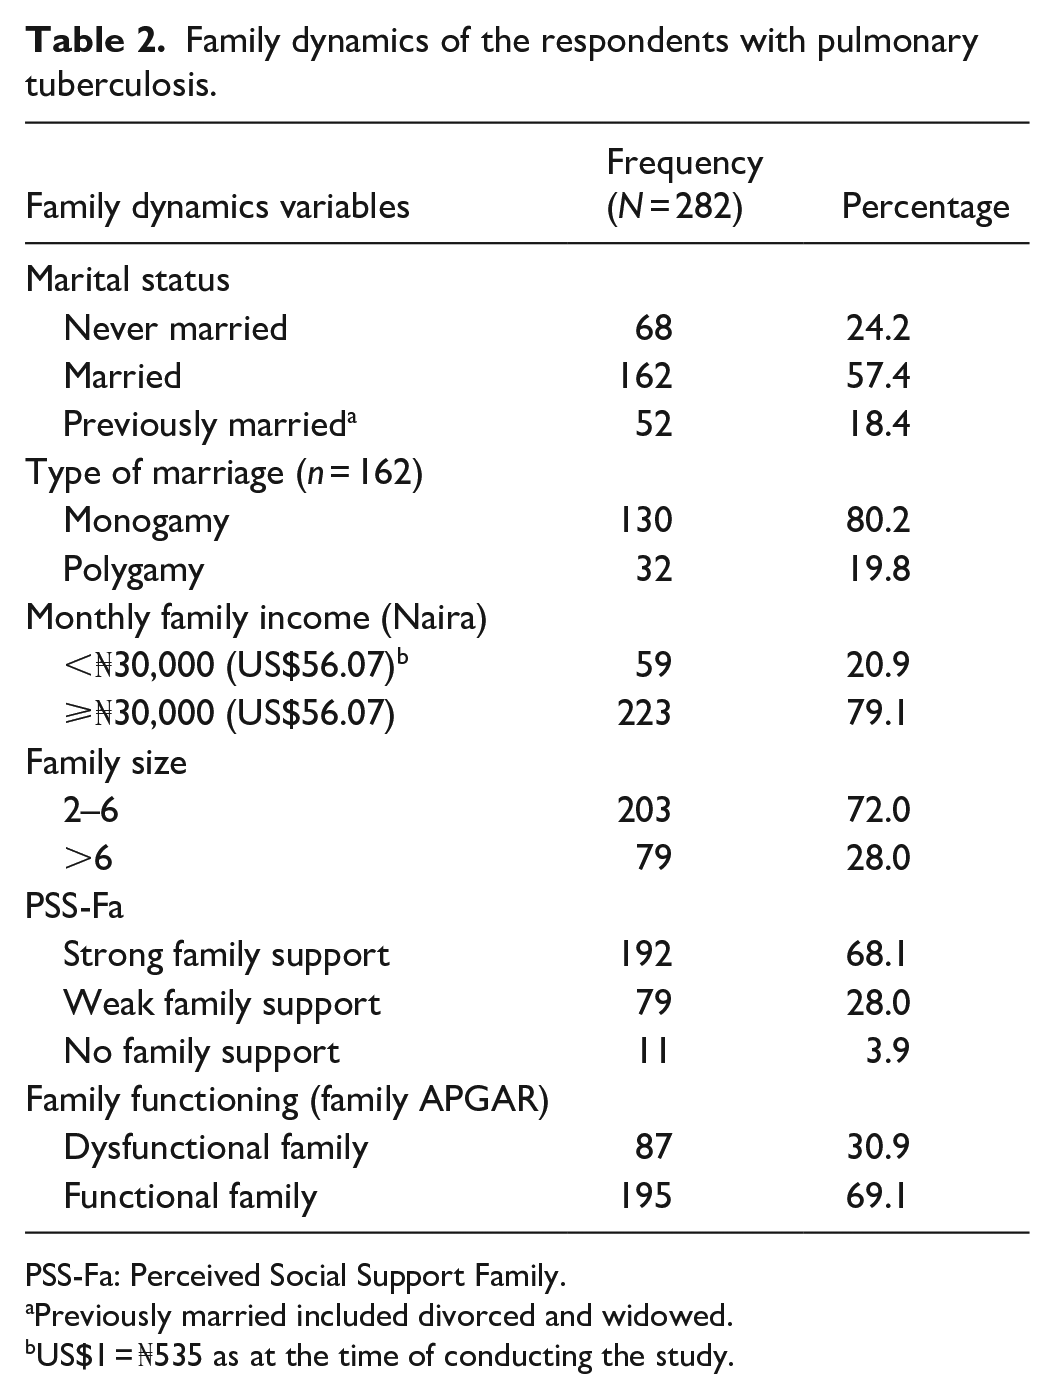
PSS-Fa: Perceived Social Support Family.
Previously married included divorced and widowed.
US$1 = ₦535 as at the time of conducting the study.
Length of the types of delay among respondents with pulmonary tuberculosis
The median diagnostic delay between the onset of symptoms of PTB and its diagnosis was 45 days (range 9–217; Table 3). In particular, the median delay attributable to the patients was 32 days (range 3–187), while the median doctor-related delay was 11 days (range 0–94).
Length of the different types of delay among the respondents with pulmonary tuberculosis.

Using the median diagnostic delay of 45 days as a cut-off, 49.6% had a prolonged diagnostic delay (Figure 2).
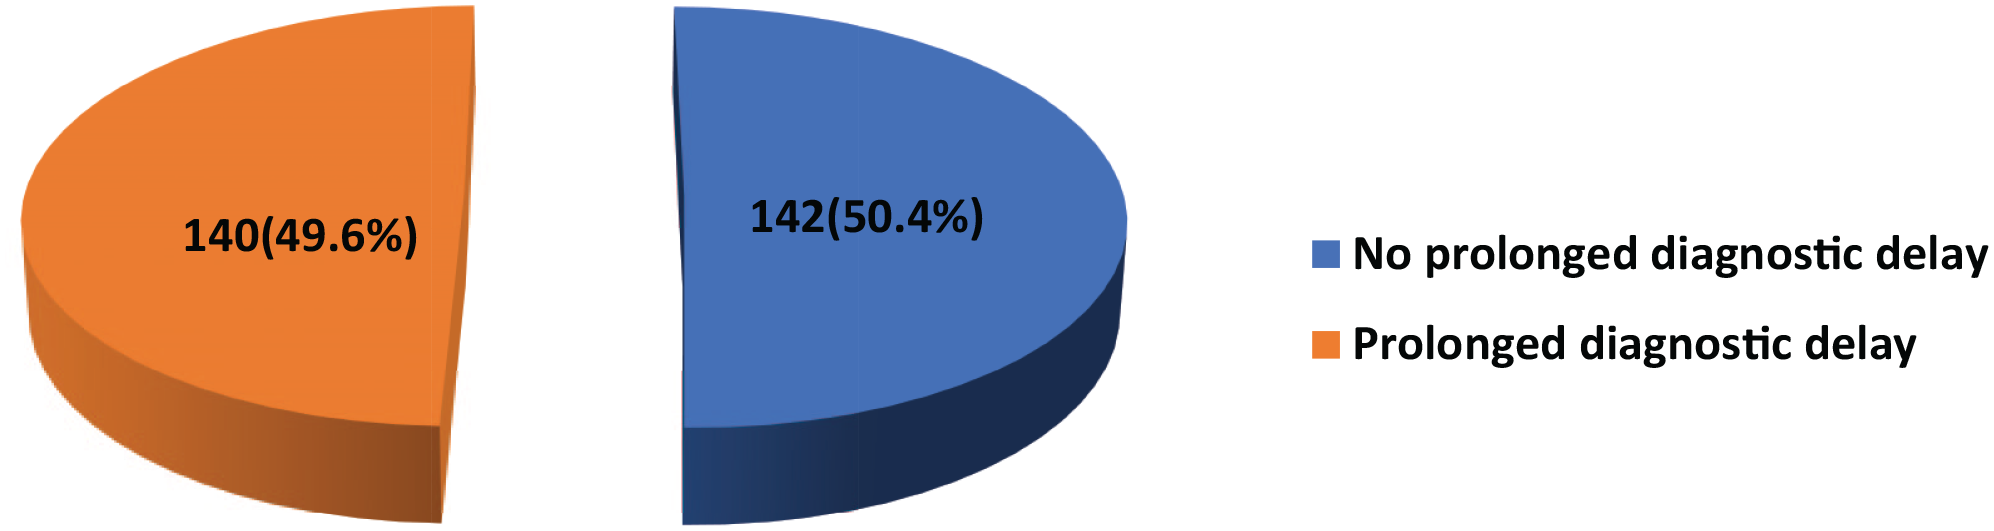
Distribution of diagnostic delay among the study respondents.
Relationship between family dynamics and the diagnostic delay among respondents receiving treatment for pulmonary tuberculosis
As seen in Table 4, the prolonged diagnostic delay was significantly more prevalent among the respondents with no family support (n = 11, 100%) and its prevalence reduced with increasing strength of family support as it was (n = 60, 75.9%) and (n = 69, 35.9%) among those with weak and strong family support, respectively (p = 0.001). More respondents from dysfunctional families (n = 72, 82.8%) experienced diagnostic delay than those from functional families (n = 68, 34.9%), with a p = 0.001.
Relationship between family dynamics and diagnostic delay among the respondents.

Likelihood-ratio.
Significant at 95% confidence interval.
US$1 = ₦535 as at the time of conducting the study.
More respondents with a family size >6 (n = 49, 62.0%) experienced prolonged diagnostic delay compared to those with smaller family sizes (n = 91, 44.8%), with a p = 0.009. Having a low monthly family income of <₦30,000 or US$56.07 was significantly associated with a higher tendency to experience prolonged diagnostic delay compared to those who earned ⩾₦30,000 or US$56.07, 47(79.7%) versus 93(41.7%) with a p = 0.001. Prolonged diagnostic delay was more likely in those previously married compared to those married and never married. However, this was not statistically significant.
The respondents with dysfunctional families, as assessed by their family APGAR, were about four times more likely to have prolonged diagnostic delays compared to their counterparts with functional families (AOR, 3.868; 95% CI, 1.704–8.777, p = 0.001; Table 5). The respondents with a monthly family income of <₦30,000 were about three times more likely to have prolonged diagnostic delays compared to their counterparts who earn ⩾₦30,000 (AOR, 2.961; 95% CI, 1.358–6.453, p = 0.006). The respondents with a family size >6 were twice as likely to have prolonged diagnostic delay compared to those with smaller family sizes (AOR, 2.223; 95% CI, 1.212–4.076, p = 0.010).
Multiple logistic regression of the relationship between family dynamics and diagnostic delay among the respondents.

PSS-Fa: Perceived Social Support Family; ref: ref: reference.
Significant at 95% confidence interval.
US$1 = ₦535 as at the time of conducting the study.
Discussion
The findings from the study indicate that a considerable delay of up to 45 days existed before the diagnosis of PTB. This was predominantly from the patients. In addition, the family dynamics of the respondents showed that 68.1% of them had strong family support, with 69.1% of them having functional families. Diagnostic delay was significantly related to weak or no family support, a dysfunctional family, a larger family size, and a low monthly family income. Also, prolonged diagnostic delay was more likely among those who were previously married compared to those who were married. Above all, having a dysfunctional family, low monthly family income, and larger family size were independent predictors of prolonged diagnostic delay.
This is the first study to examine the connection between delayed PTB diagnosis and family dynamics in Nigeria. The study’s high sample size is one of its strengths. Additionally, the study’s findings applied to the study setting and might be extrapolated to other locations with comparable demographic characteristics, thanks to the multistage sampling approach used for sample recruitment. The majority of the Yoruba population of the study locality is noted for having a strong family, which is desirable. The family APGAR and PSS-Fa tools used to assess family dynamics had been used among adults in the same study community.
The study found that the median diagnostic delay between the onset of symptoms of PTB and its diagnosis was 45 days (range 9–217). This is too long and is, hence, unacceptable considering the continuous disease transmission that will be taking place during this period and its implications for the control and elimination of TB. Comparable lengths of median diagnostic delay were reported by Paramasivam et al. in Kerala, India (37 days), Asefa and Teshome in Ethiopia, and Mahato et al. in Nepal (39.5 days).35,36 The median diagnostic delay observed in this study was longer than what was reported by Noora et al. in Ghana (14 days) and Said et al. in Dar es Salaam, Tanzania (3 weeks).37,38 The difference may be due to the patient’s family dynamics, health-seeking behavior, and health system factors that determine when and where patients seek care and healthcare accessibility.
This study also showed that family dynamics (low family income, large family size, inadequate family support, and family dysfunction) were significantly related to diagnostic delay. More of the respondents with a large family size >6 (62.0%) experienced prolonged diagnostic delay compared to those with smaller family sizes (44.8%). They were twice as likely to have prolonged diagnostic delays compared to those with smaller family sizes. These findings are consistent with reports of other studies.34,39 This is because people with larger family sizes have more financial responsibility for their family, which translates to more economic hardship that makes a timely presentation for care difficult. In a country where most patients finance their healthcare through out-of-pocket payments, access to good, and qualitative health might not be possible because of a shortage of family financial resources. It has been shown that the health outcomes of members of a family increase with decreasing family size. 40
Having a low family income of <₦30,000 or US$56.07 was significantly associated with a higher tendency to experience prolonged diagnostic delay compared to those who earned ⩾₦30,000 or US$56.07 (79.7%) versus (41.7%). Those with lower monthly family income were about three times more likely to have prolonged diagnostic delays compared to their counterparts who earned more. This tendency to have prolonged diagnostic delay was similarly observed in other studies.10,41 In a Pakistani study, the major reason why 42% of the respondents had patient delay was low family income. 13 A Nigerian study on the determinants of delay among TB patients in Lagos reported that patients who earned. 42 This is because they may not seek healthcare early, as they are sourcing funds to finance their care.
Prolonged diagnostic delay was significantly more prevalent among the respondents with no family support, and its prevalence reduced with increasing strength of family support. This is because a patient with poor or no family support is less likely to receive all the necessary financial, emotional, and instrumental support that is necessary to expedite presentation for diagnosis and treatment. Yin et al. found that Chinese TB patients with low family support have higher TB-related stigma, which makes them delay presentation for care. 43
More respondents from dysfunctional families significantly experienced diagnostic delays than those from functional families. Those from dysfunctional families were about four times more likely to have prolonged diagnostic delays compared to their counterparts from functional families. This is because a patient from a dysfunctional family is less likely to be able to turn to family members or have all the necessary financial, emotional, and instrumental support to present promptly for diagnosis and treatment. Similarly, Palmieri et al. found that treatment adherence among TB patients in Peru increased with increasing family support. 44 The influence of family functioning on chronic medical conditions has also been demonstrated in Nigeria by Afolabi et al. and Gabriel et al.31,45
Limitations
This study has limitations. First, the study is only able to propose a relationship and not a cause-and-effect link due to its cross-sectional nature. Second, a biased opinion in a sampled DOTS center may be inferred to be possessed by the entire population. This was, however, corrected by the introduction of a design effect. Furthermore, social desirability and recall bias may exist for the self-reported items, which could result in an overestimation of variables like the monthly family income and an underestimation of others, like family characteristics, dates of onset of symptoms, and the date of their first visit to the health facility which may affect the extent of the delays. The respondents were, however, assisted in their recall efforts by using a calendar of locally important events and other probing techniques. Some information was also retrieved from their treatment cards.
Conclusion
The study showed that considerable delay existed in diagnosis among patients with PTB. About two-thirds of the respondents had strong family support and were from functional families. The family factors that independently predicted prolonged diagnostic delay were having a dysfunctional family, low monthly family income, and large family size.
Based on these findings, we recommend the need for public education and the creation of awareness on the symptoms of PTB and appropriate health-seeking behavior using appropriate channels; improvement of the health system to deliver efficient patient-centered care to patients when they report for care; regular refresher training courses for community health extension workers, community health officers, nurses, and physicians on recognizing the symptoms of TB will help to reduce the health system component of diagnostic delay; and strengthening the family and involvement of family members in trajectory of care of patients with PTB.
Footnotes
Acknowledgements
The authors would like to thank the Osun State Tuberculosis Control Programme, Nurses, DOTS officers, and the patients at the DOTS centers where the research was conducted.
ORCID iDs
Ethical Considerations
Ethical approval for this study was obtained from OAUTHC Ethics and Research Committee/ID: ERC/IEC/2020/06/14.
Consent to Participate
Written informed consent was obtained from all subjects before the study.
Author Contributions
A.A.A., O.O.O., F.A.O., O.O.S., and S.B.I. contributed substantially to the study’s conception and design, while A.O.S., O.O.T., O.I.W., M.G., A.O.I., and K.A.M. made vital contributions to the implementation. All authors were involved in data collection, analysis, and interpretation. All authors read, approved, and contributed critically to the final article.
Funding
The author(s) received no financial support for the research, authorship, and/or publication of this article.
Declaration of Conflicting Interests
The author(s) declared no potential conflicts of interest with respect to the research, authorship, and/or publication of this article.