
Abstract
Background:
Nonsmall cell lung cancer is a leading cause of cancer-related death worldwide. The long noncoding RNA MIR4435-2HG has been shown to play a carcinogenic role in various cancers. The purpose of this study was to explore the role and regulatory mechanism of MIR4435-2HG in non-small cell lung cancer.
Methods:
Quantitative real-time polymerase chain reaction was used to detect MIR4435-2HG and SRY-box transcription factor 2 in nonsmall cell lung cancer cells. Gain- or loss-of-function assays of MIR4435-2HG and SRY-box transcription factor 2 were subsequently conducted. Cell proliferation, apoptosis, migration, glycolysis, and invasion were tested. A nude mouse tumor model was constructed to determine the role of MIR4435-2HG and SRY-box transcription factor 2 in the growth of tumor cells in vivo. Furthermore, the interactions between MIR4435-2HG, miR-371a-5p and SRY-box transcription factor 2 were analyzed via a dual-luciferase reporter gene assay.
Results:
Quantitative real-time polymerase chain reaction revealed that MIR4435-2HG and SRY-box transcription factor 2 were upregulated in nonsmall cell lung cancer cells. Forced MIR4435-2HG overexpression led to increased cell proliferation, migration, invasion, and glycolysis and repressed cell apoptosis. Overexpressing MIR4435-2HG promoted SRY-box transcription factor 2 expression and PI3K/Akt/mTOR pathway activation. Downregulating MIR4435-2HG had antitumor effects both in vitro and in vivo. SRY-box transcription factor 2 overexpression mostly reversed the suppressive effects of MIR4435-2HG downregulation. Mechanistic studies revealed that MIR4435-2HG, a competitive endogenous RNA, directly targeted and inhibited miR-371a-5p. Rescue assays revealed that miR-371a-5p overexpression or SRY-box transcription factor 2 downregulation significantly inhibited MIR4435-2HG-mediated oncogenic effects.
Conclusion:
MIR4435-2HG promotes nonsmall cell lung cancer cell malignant behaviors and glycolysis by regulating the miR-371a-5p/SOX2 axis.
Introduction
Nonsmall cell lung cancer (NSCLC) accounts for 85% of all cases of lung cancer, and the incidence rate is increasing annually. 1 Owing to the absence of early sexual symptoms or typical symptoms, as well as the lack of biomarkers for early diagnosis and screening, approximately 80% of patients are diagnosed in the late stage. 2 Although existing molecular targeted therapies and immune checkpoint inhibitors have improved the cure rate of advanced NSCLC patients, the overall 5-year survival rate of stage IV NSCLC patients is still not ideal, at only 4%–6%. 3 Therefore, exploring novel biomarkers is highly important for the early diagnosis of NSCLC and the development of new therapeutic targets.
Long noncoding RNAs (lncRNAs) are a class of noncoding RNAs (ncRNAs) with lengths exceeding 200 nucleotides that can affect gene expression at the transcriptional, translational, and protein modification levels. 4 LncRNAs play a carcinogenic or anticancer role in cancer by influencing cell apoptosis, migration, invasion, proliferation, and glycolysis.5 –7 The lncRNA MIR4435-2 host gene (MIR4435-2HG) plays a role in cancer development and is a predictive biomarker of the chemotherapy response.8,9 For example, the expression of BCL2L1 is altered in pancreatic adenocarcinoma and is correlated with the levels of immune checkpoint inhibitors. MIR4435-2HG aggravates cancer cell proliferation through promoting BCL2L1 expression and inhibiting miR-513a-5p as a ceRNA. 10 In addition, studies have shown that MIR4435-2HG is upregulated in lung cancer tissue and that the overexpression of MIR4435-2HG is activated by β-catenin signaling. The proliferation and invasion of lung cancer cells were promoted after MIR4435-2HG overexpression. 11 Hence, further exploration of the mechanisms of MIR4435-2HG in NSCLC development is warranted.
SRY-box transcription factor 2 (SOX2) is a transcription factor that plays a critical role in embryonic development and the maintenance of stem cell pluripotency.12,13 SOX2 has emerged as a key player in cancer progression and tumorigenesis. High levels of SOX2 have been associated with tumor initiation, progression, and metastasis. 14 SOX2 helps maintain the stemness of cancer stem cells. 15 In addition, in the presence of therapeutic agents, SOX2 can protect cancer cells from apoptosis, promote DNA repair, and increase cell survival. 16 The SOX2−SLC7A11 regulatory axis has been shown to mediate ferroptosis resistance in lung cancer. 17 As a result, targeting SOX2 expression or activity may help overcome resistance to conventional cancer treatments. 18
Glycolysis is a well-known hallmark of cancer metabolism. The metabolic reorganization of tumor cells can be affected by the tumor microenvironment and hypoxia. 19 Unlike normal cells, which obtain energy through oxidative phosphorylation (OXPHOS), tumor cells satisfy their energy needs through glycolysis even under normoxic conditions, which is known as the Warburg effect. Elevated glycolysis in tumor cells contributes to immune escape, cell proliferation, and tumor cell invasion.20,21 Inhibiting cellular glycolysis is considered a potential strategy for treating NSCLC and can contribute to ROS generation, apoptosis, and cell cycle arrest. 22
In this study, we analyzed the expression of MIR4435-2HG and SOX2 in NSCLC tissues and cells. Next, functional assays were carried out to verify the roles of MIR4435-2HG and SOX2 in NSCLC cell proliferation, migration, invasion, and glycolysis. Further mechanistic studies were performed to investigate the potential role of the miR-371a-5p/PI3K/Akt/mTOR axis in MIR4435-2HG-mediated NSCLC progression. Overall, our study suggested that MIR4435-2HG plays an essential role in NSCLC by targeting miR-371a-5p/SOX2 and mediating the PI3K/Akt/mTOR pathway. This discovery not only provides insights into lung cancer development but also suggests that the MIR4435-2HG/miR-371a-5p/SOX2/PI3K/Akt/mTOR axis is a promising candidate for molecular diagnosis and therapeutic intervention in NSCLC.
Materials and methods
Cell culture
BEAS-2B cells (normal human lung epithelial cells) (Cat.No. GNHu27), A549 (Cat.No. SCSP-503), H1299 (Cat.No. SCSP-589), HCC827 (Cat.No. SCSP-538), PC9 (Cat.No. SCSP-5085), and NCI-H460 (Cat.No. SCSP-584), and HEK-239T (Cat.No. SCSP-5209) cells were purchased from the Shanghai Cell Bank, Chinese Academy of Sciences (Shanghai, China). All the cells were subjected to mycoplasma contamination testing before use to ensure that they were free of mycoplasma. BEAS-2B and HEK-239T cells were maintained in DMEM (Gibco). A549 cells were maintained in DMEM-F12 (Gibco), and HCC827, PC9, H1299 and NCI-H460 cells were maintained in RPMI-1640 medium (Gibco). All culture media were supplemented with 10% FBS (Thermo Fisher Scientific), 1% streptomycin, and 1% penicillin (Beyotime).
Cell transfection
si-MIR4435-2HG, si-SOX2, and PCDNA-MIR4435-2HG plasmids and the corresponding negative controls sh-NC and pcDNA-NC were designed and synthesized by Sangon Biotech (Shanghai, China). The miR-371a-5p mimics were designed and synthesized by RiboBio (Guangzhou, China). NSCLC cells (5 × 10⁵ cells) were inoculated into a 6-well plate, and when the cells reached 80% confluence, Lipofectamine™ 3000 transfection reagent (Takara, Kusatsu, Japan) was used for transfection. Twenty-four hours after cell transfection, the medium was removed, and the medium was exchanged for fresh complete medium. The cells were cultured for 48 h, and RT‒PCR or western blotting was conducted to verify the cell transfection efficiency. 23
Cell counting kit-8 assay
NSCLC cells were seeded into 96-well plates at a density of 5 × 10³ cells/well. After 24, 48, and 72 h of culture, 10 μL of CCK8 reagent (Beyotime) was added to each well. The cells were cultured at 37°C and 5% CO2 for 2 h before the culture was terminated. A microplate reader (Bio-Rad, Hercules, CA, USA) was used to measure the absorbance at 450 nm. 23
Transwell experiment
Twenty-four hours before the start of the experiment, 50 μL of matrix (BD Biosciences) was added to the upper chamber of a preembedded Transwell chamber (8 μM pore size, Millipore, USA). The cells were prepared as single-cell suspensions, and the density was adjusted to 5 × 10⁴. Then, 200 μl of the cell suspension (serum-free) was added to the upper chamber, and 600 μL was added to the lower chamber. The cells were cultured in culture medium supplemented with 10% FBS. After 24 h of cultivation, the Transwell membrane was gently wiped with a cotton swab to remove noninvasive cells. The cells on the lower surface were fixed with 4% paraformaldehyde for 20 min and stained with 0.5% crystal violet (Solarbio, China). The cells were observed and imaged under an inverted microscope (Olympus, Tokyo, Japan). 24
Wound healing assay
A549, NCL-H460, and H1299 cells were inoculated into a six-well plate. When the cells reached 80%–90% confluence, a single-layer cell center was scratched with the tip of a sterile 10-μm thick pipette. The cells were washed with phosphate buffer saline (PBS) three times to remove scraped cells and ensure that there were no cells at the center of the scratch. Then, serum-free culture medium was added to the cells to avoid the impact of cell proliferation on wound closure. The scratches were observed and photographed at 0 h. The serum-free culture medium was replaced, and the cells were incubated at 37°C in a 5% CO2 incubator for 24 h. The cells were observed and photographed under an inverted microscope for 24 h. The wound healing rate (%) = (0 h width-24 width)/0 h width × 100%. 25
Cell cycle analysis
The cell cycle distribution of A549, NCL-H460, and H1299 cells was determined by flow cytometry (FCM) analysis. These three cell lines were seeded in 6-well plates, and each well contained 5 × 10⁵ cells. After 48 h, the cells were digested with 0.25% trypsin and collected via centrifugation. Ice-cold medium was used to wash the cells twice, which were then stained with propidium iodide (PI) from the Cell Cycle and Apoptosis Analysis Kit (Cat.No. 40301ES50, Yeasen, Shanghai, China) at 37°C in the dark for 30 min. Finally, FCM (Beckman Coulter, USA) was used to examine alterations in the cell cycle. 26
Immunofluorescence
A total of 5 × 10⁴ cells were inoculated onto a 24-well plate and incubated overnight. The cells were fixed with 4% paraformaldehyde at room temperature for 15 min and then permeated with 0.2% Triton X-100 for 10 min. The cells were incubated with 5% bovine serum albumin (BSA) for protein blocking at room temperature for 1 h, after which they were incubated with 200 μL of anti-cleaved Caspase3 (1:500, ab32042, Abcam). The cells were placed in an incubator at 37°C for 1 h. After the cells were washed with phosphate buffered solution-Tween (PBST) five times, they were incubated with goat anti-rabbit IgG H&L (Alexa Fluor® 488) (1:500, ab150077, Abcam). After the cells were washed with PBST five times, the nuclei were stained with 4’,6-Diamidino-2-phenylindole (DAPI; Beyotime, China). Finally, the fluorescence signals were observed under a fluorescence microscope (Olympus, Japan). 23
Quantitative real-time polymerase chain reaction
Total RNA was extracted from tissues and cells via TRIzol reagent (Invitrogen, Carlsbad, CA, USA). A NanoDrop spectrophotometer (Thermo Scientific, USA) was used to determine the purity and concentration of the RNA. The RNA was reverse transcribed into cDNA via the PrimeScript RT reagent (Takara, Japan). A TaqMan MicroRNA reverse transcription kit (Applied Biosystems, Foster City, CA, USA) was used to synthesize miR-371a-5p. Quantitative real-time polymerase chain reaction (qRT-PCR) was performed using SYBR Green Mixture (Takara) and an ABI 7500 Real-Time PCR System (Applied Biosystems). The PCR thermal cycling conditions were as follows: initial denaturation at 95°C for 2 min, 95°C for 15 s, and 60°C for 32 s for a total of 40 cycles. glyceraldehyde-3-phosphate dehydrogenase (GAPDH) and U6 served as internal controls for mRNA and miRNA, respectively. The 2−ΔΔct method was used to calculate the relative expression of genes. 23 The specific primers used are listed in Table 1.
Primers used to detect genes.

Western blot
The processed cells were collected, and total protein was extracted from the cells via RIPA lysis buffer supplemented with protein inhibitors (Beyotime Biotechnology). SDS-PAGE (12%) was used to separate total proteins. The separated proteins were subsequently transferred to polyvinylidene fluoride (PVDF) membranes (EMD Millipore). The membrane was blocked with 5% nonfat milk at room temperature for 1 h and then incubated with primary antibodies, including anti-SOX2 (ab92494, Abcam, 1:1000), anti-CDK2 (Cat No. 10122-1-AP, Proteintech, 1:1000), anti-CDK4 (Cat No. 11026-1-AP, Proteintech, 1:1000), anti-CyclinD1 (Cat No. 26939-1-AP, Proteintech, 1:1000), anti-CyclinE1 (Cat No. 11554-1-AP, Proteintech, 1:1000), anti-Bax (Cat No. 50599-2-Ig, Proteintech, 1:1000), anti-Bcl2 (Cat No. 68103-1-Ig, Proteintech, 1:1000), anti-Bad (Cat No. 10435-1-AP, Proteintech, 1:1000), anti-LDHA (ab52488, Abcam, 1:1000), anti-GLUT1 (ab115730, Abcam, 1:1000), anti-HK-1 (Cat No. 19662-1-AP, Proteintech, 1:1000), anti-HK-2 (Cat No. 22029-1-AP, Proteintech, 1:1000), anti-PKM1 (Cat No. 15821-1-AP, Proteintech, 1:1000), anti-PKM2 (Cat No. 15822-1-AP, Proteintech, 1:1000), anti-E-cadherin (Cat No. 20874-1-AP, Proteintech, 1:1000), anti-Vimentin (Cat No. 10366-1-AP, Proteintech, 1:1000), anti-N-cadherin (Cat No. 22018-1-AP, Proteintech, 1:1000), anti-p-PI3K p85(ab138364, Abcam, 1:1000), anti-PI3K p85 (ab191606, Abcam, 1:1500), anti-p-Akt (ab38449, Abcam, 1:1000), anti-Akt (ab8805, Abcam, 1:2000), anti-p-mTOR (ab109268, Abcam, 1:1000), anti-mTOR (ab32028, Abcam, 1:2000), anti-GAPDH (ab8245, Abcam, 1:3000) overnight at 4°C. After washing with PBS, the membrane was incubated with horseradish peroxidase (HRP)-labeled goat anti-rabbit IgG secondary antibody (ab6721, Abcam, 1:1000) at room temperature for 2 h. Finally, enhanced chemiluminescence (P0018S, Beyond Biotechnology) was used for color imaging. The signals were exposed on the X-films. GAPDH served as an internal reference. 15
Detection of glucose uptake and lactate release
NSCLC cells were seeded in a 6-well plate with 5 × 10³ cells, and the cell culture supernatant was collected. Glucose uptake and lactate production were detected via a glucose content assay kit (Solarbio) and a lactate assay kit (JianCheng Bioengineering Institute, Nanjing), respectively. In accordance with previous research, 27 the glucose uptake and lactate production levels were calculated.
Dual-luciferase reporter gene assay
The starBase database (ttps://starbase.sysu.EdU.cn) predicted the binding sites of MIR4435-2HG and miR-371a-5p, as well as those of miR-371a-5p and SOX2. The activity of luciferase was detected in HEK-239T cells according to the instructions of the Dual Luciferase Reporter Assay System purchased from Promega. A luciferase reporter gene vector was constructed via the pGL3 vector, and wild-type MIR4435-2HG (MIR4435-2HG-WT) and mutant MIR4435-2HG Mut, as well as wild-type (SOX2-WT) and mutant SOX2 (SOX2 Mut), were cloned and inserted into the pGL3 vector. The above vectors were cotransfected with the miR-371a-5p mimics or miR-NC along with Lipofectamine 2000 (Invitrogen). After 48 h of transfection, luciferase activity was detected. Firefly luciferase activity was normalized to Renilla luciferase activity. 28
Nude mouse tumor model
Six-week-old female BALB/c nude mice were raised in a pathogen-free (SPF) environment. H460 cells (2 × 10⁶) stably transfected with si-MIR4435-2HG and/or SOX2 overexpression plasmids were inoculated subcutaneously into the right forearm axilla of mice to establish a mouse xenograft tumor model. The volume of the subcutaneous tumors in the mice was measured every 5 days, where tumor volume (mm3) = length × width 2 /2. 27 On the 30th day after vaccination, all the mice were euthanized by inhaling excessive CO2. The tumors were separated, weighed, and photographed. Tumor tissue was collected for subsequent experiments. This study was approved by the Ethics Committee of Hebei General Hospital.
Immunohistochemistry and tissue immunofluorescence
The tumor tissue was embedded in paraffin, sliced, incubated with 3% H2O2 to block endogenous peroxidase activity, and washed with PBS, after which antigen retrieval was performed according to the type of primary antibody. Five percent of Thermo Fisher Scientific blocking solution was used for blocking at room temperature for 30 min. The sections were incubated overnight with primary antibodies, including Ki67 (ab15580, Abcam, 1:1000), TUNEL (Yeasen), SOX2 (ab92494, Abcam, 1:1000), p-PI3K p85 (ab235266, Abcam, 1:1000), anti-p-Akt (ab38449, Abcam, 1:1000), and anti-p-mTOR (ab109268, Abcam, 1:1000), at 4°C, and then, an HRP-labeled sheep anti-rabbit IgG secondary antibody (ab6721, Abcam, 1:500) was added and incubated at 37°C for 60 min. The sections were observed and photographed under a light microscope (Olympus, Japan). To detect LDHA expression in the tumor tissues, the sections were incubated overnight with anti-LDHA (ab52488, Abcam, 1:1000) at 4°C. After the sections were washed, they were incubated with goat anti-rabbit IgG H&L (Alexa Fluor® 488) (ab150077, Abcam, 1:500) at 37°C for 60 min. The slices were washed three times with PBS and subjected to restaining with DAPI to label the nucleus. The sections were observed and photographed under a fluorescence microscope (Olympus, Japan).
The evaluation criteria for the immunohistochemistry (IHC) experiment were as follows: after the staining results were located on the chip point by point, the cell staining intensity was determined as follows: no staining was considered negative (−), light brown staining was considered weakly positive (+), brown staining was considered positive (++), and dark brown staining was considered strongly positive (+++). The number of positive cells was determined as the ratio of target cells expressing the target protein to all target cells. 27
Statistics and analysis
GraphPad Prism 8.0 (GraphPad Software, Inc., La Jolla, CA, USA) was used for data analysis. The data are presented as the means ± standard deviations (SDs). The data were compared via one-way analysis of variance and post hoc Dunnett’s t-test to analyze the statistical significance of differences between two groups. p < 0.05 was considered to indicate statistical significance.
Results
Analysis of MIR4435-2HG and SOX2 in NSCLC tissues and cells
We used the online tool UALCAN (https://ualcan.path.uab.edu/) to analyze the expression of MIR4435-2HG and SOX2 in human cancers. 29 MIR4435-2HG expression is elevated in multiple tumors, including two NSCLC types, namely, lung adenocarcinoma (LUAD) and lung squamous cell carcinoma (LUSC) (Figure 1(a)–(c)). In addition, the SOX2 level was found to be increased in multiple human cancers, including LUAD and LUSC (Figure 1(d)–(f)). Prognostic analysis revealed that upregulated MIR4435-2HG and SOX2 can predict poorer overall survival in patients with LUAD and LUSC (Figure 1(g) and (h)). qRT-PCR or western blotting was used to detect the expression of MIR4435-2HG and SOX2 in NSCLC cells (A549, H1299, HCC827, PC9, and NCI-H460) and normal human lung epithelial cells (BEAS-2B). We found that the expression of MIR4435-2HG and SOX2 in A549, H1299, HCC827, and PC9 cells was significantly greater than that in BEAS-2B cells (Figure 1(i)–(k)). Next, we analyzed the protein expression of SOX2 in lung cancer through the Human Protein Atlas (https://www.proteinatlas.org/). SOX2 was positively expressed in lung cancer tissues but not in normal lung tissues (Figure 1(l)).
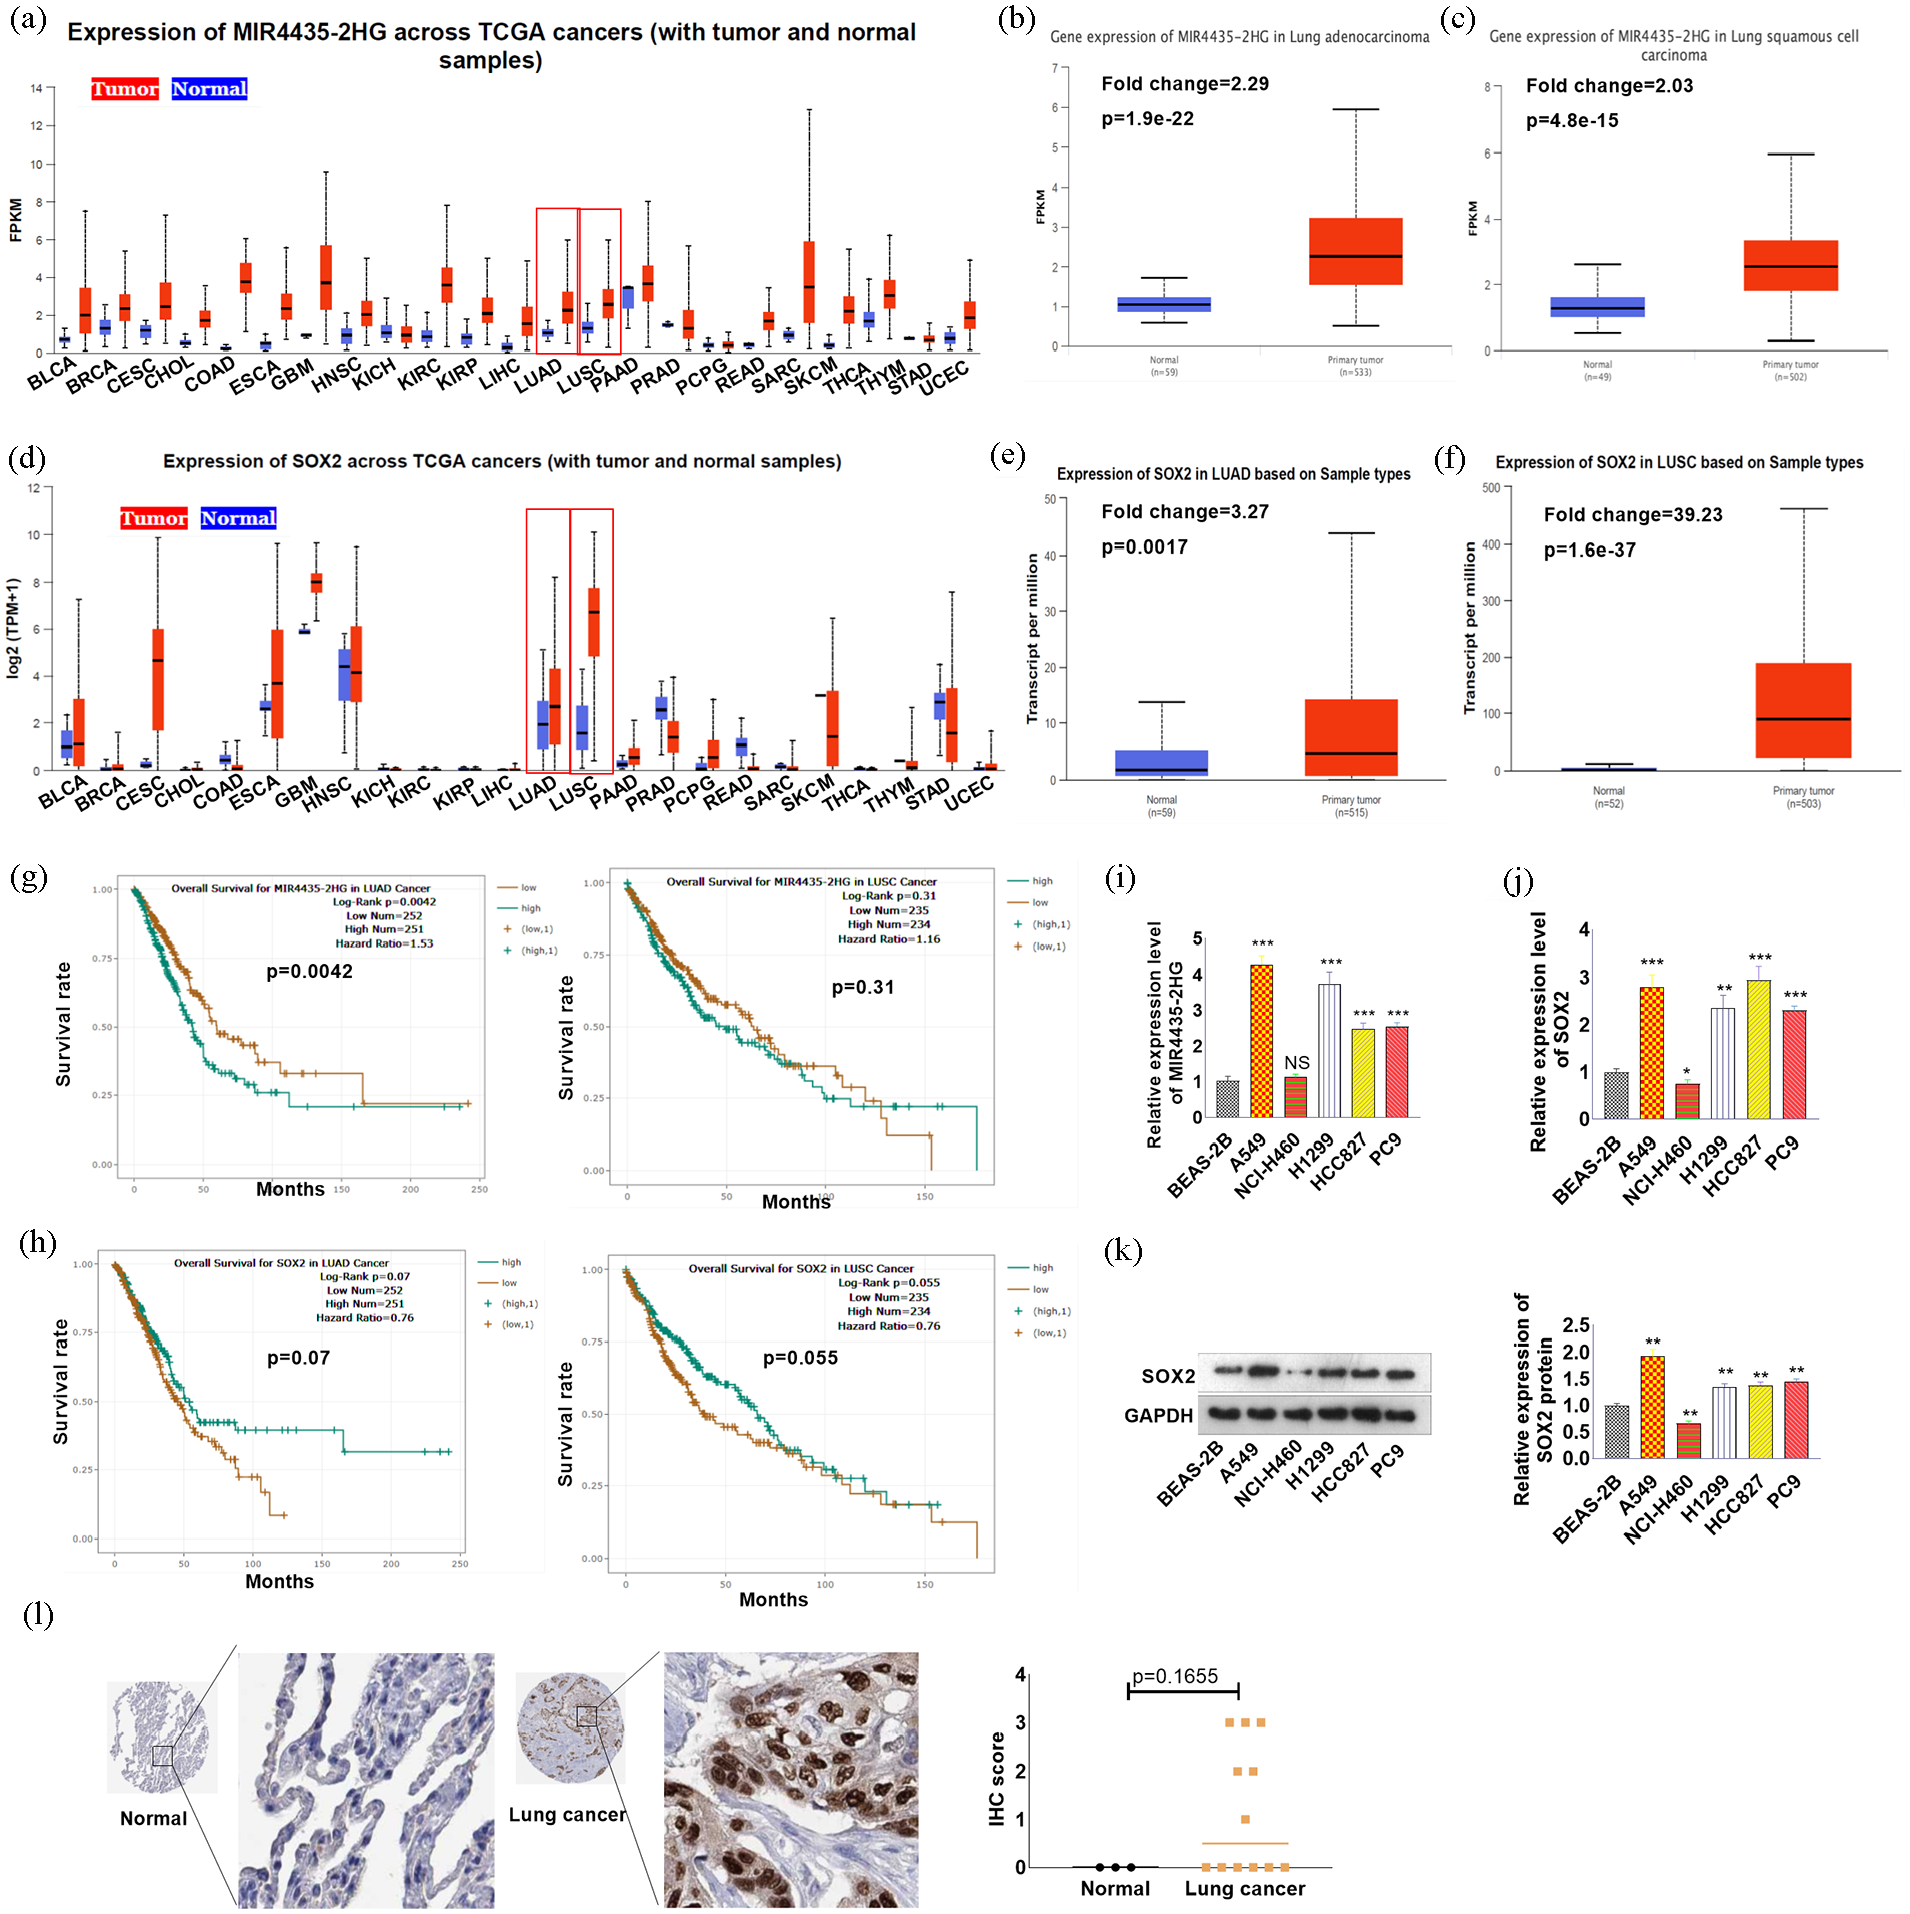
Expression of MIR4435-2HG, miR-371a-5p, and SOX2 in NSCLC tissues and cells. (a–f) The online tool UALCAN (https://ualcan.path.uab.edu/) was used to analyze the expression of MIR4435-2HG (a–c) and SOX2 (e–f) in human cancers. (g and h) Prognostic analysis was conducted via UALCAN to analyze the relationships between MIR4435-2HG and SOX2 and overall survival in LUAD and LUSC patients. (i‒k) qRT-PCR or western blotting was used to detect the expression of MIR4435-2HG (i) and SOX2 (j and k) in NSCLC cells (A549, H1299, HCC827, PC9, and NCI-H460) and normal human lung epithelial cells (BEAS-2B). (l) The protein expression of SOX2 in lung cancer was analyzed via the Human Protein Atlas (https://www.proteinatlas.org/).
MIR4435-2HG upregulation enhances NSCLC cell proliferation and glycolysis and inhibits apoptosis
The MIR4435-2HG overexpression plasmids were transfected into three NSCLC lines, A549, NCI-H460, and H1299, and qRT-PCR was used to determine the transfection efficiency, as shown in Figure 2(a). si-MIR4435-2HG and miR-371a-5p were successfully transfected into H1299 cells. The results of the CCK8 assay revealed that, compared with the vector group, the MIR4435-2HG group exhibited increased cell proliferation (Figure 2(b)–(d)). Cell cycle analysis was conducted via FCM. The data revealed that following MIR4435-2HG overexpression, there was a significant increase in the proportion of S phase cells and a significant decrease in the proportion of G0/G1 phase cells among the cells (compared with those in the vector group) (Figure 2(e)). Western blotting was used to detect the expression of cell cycle-related proteins (CDK2, CDK4, CyclinD1, and CyclinE1). Compared with the vector group, MIR4435-2HG markedly promoted the expression of CDK2, CDK4, CyclinD1, and CyclinE1 (Figure 2(f)). Cell apoptosis was induced by cisplatin (20 μM), after which cell apoptosis was detected via IF and western blotting. MIR4435-2HG upregulation attenuated cleaved caspase-3 expression (Figure 2(g)). Western blot analysis revealed that the MIR4435-2HG group presented reduced Bax and Bad levels, whereas the Bcl2 level was increased (Figure 2(h)). Glucose uptake and lactate production were detected. Compared with the vector group, MIR4435-2HG promoted glucose uptake and the production of lactate (Figure 2(i) and (j)). Next, the expression of key glycolysis-related enzymes, including LDHA, GLUT-1, HK1, HK2, PKM1, and PKM2, in three NSCLC cell lines was determined by western blotting. The data revealed that LDHA, GLUT-1, HK1, HK2, PKM1, and PKM2 levels were all increased in the MIR4435-2HG group (Figure 2(k)). These results indicate that MIR4435-2HG overexpression enhances NSCLC cell proliferation, cell cycle progression, and glycolysis and inhibits cell apoptosis.
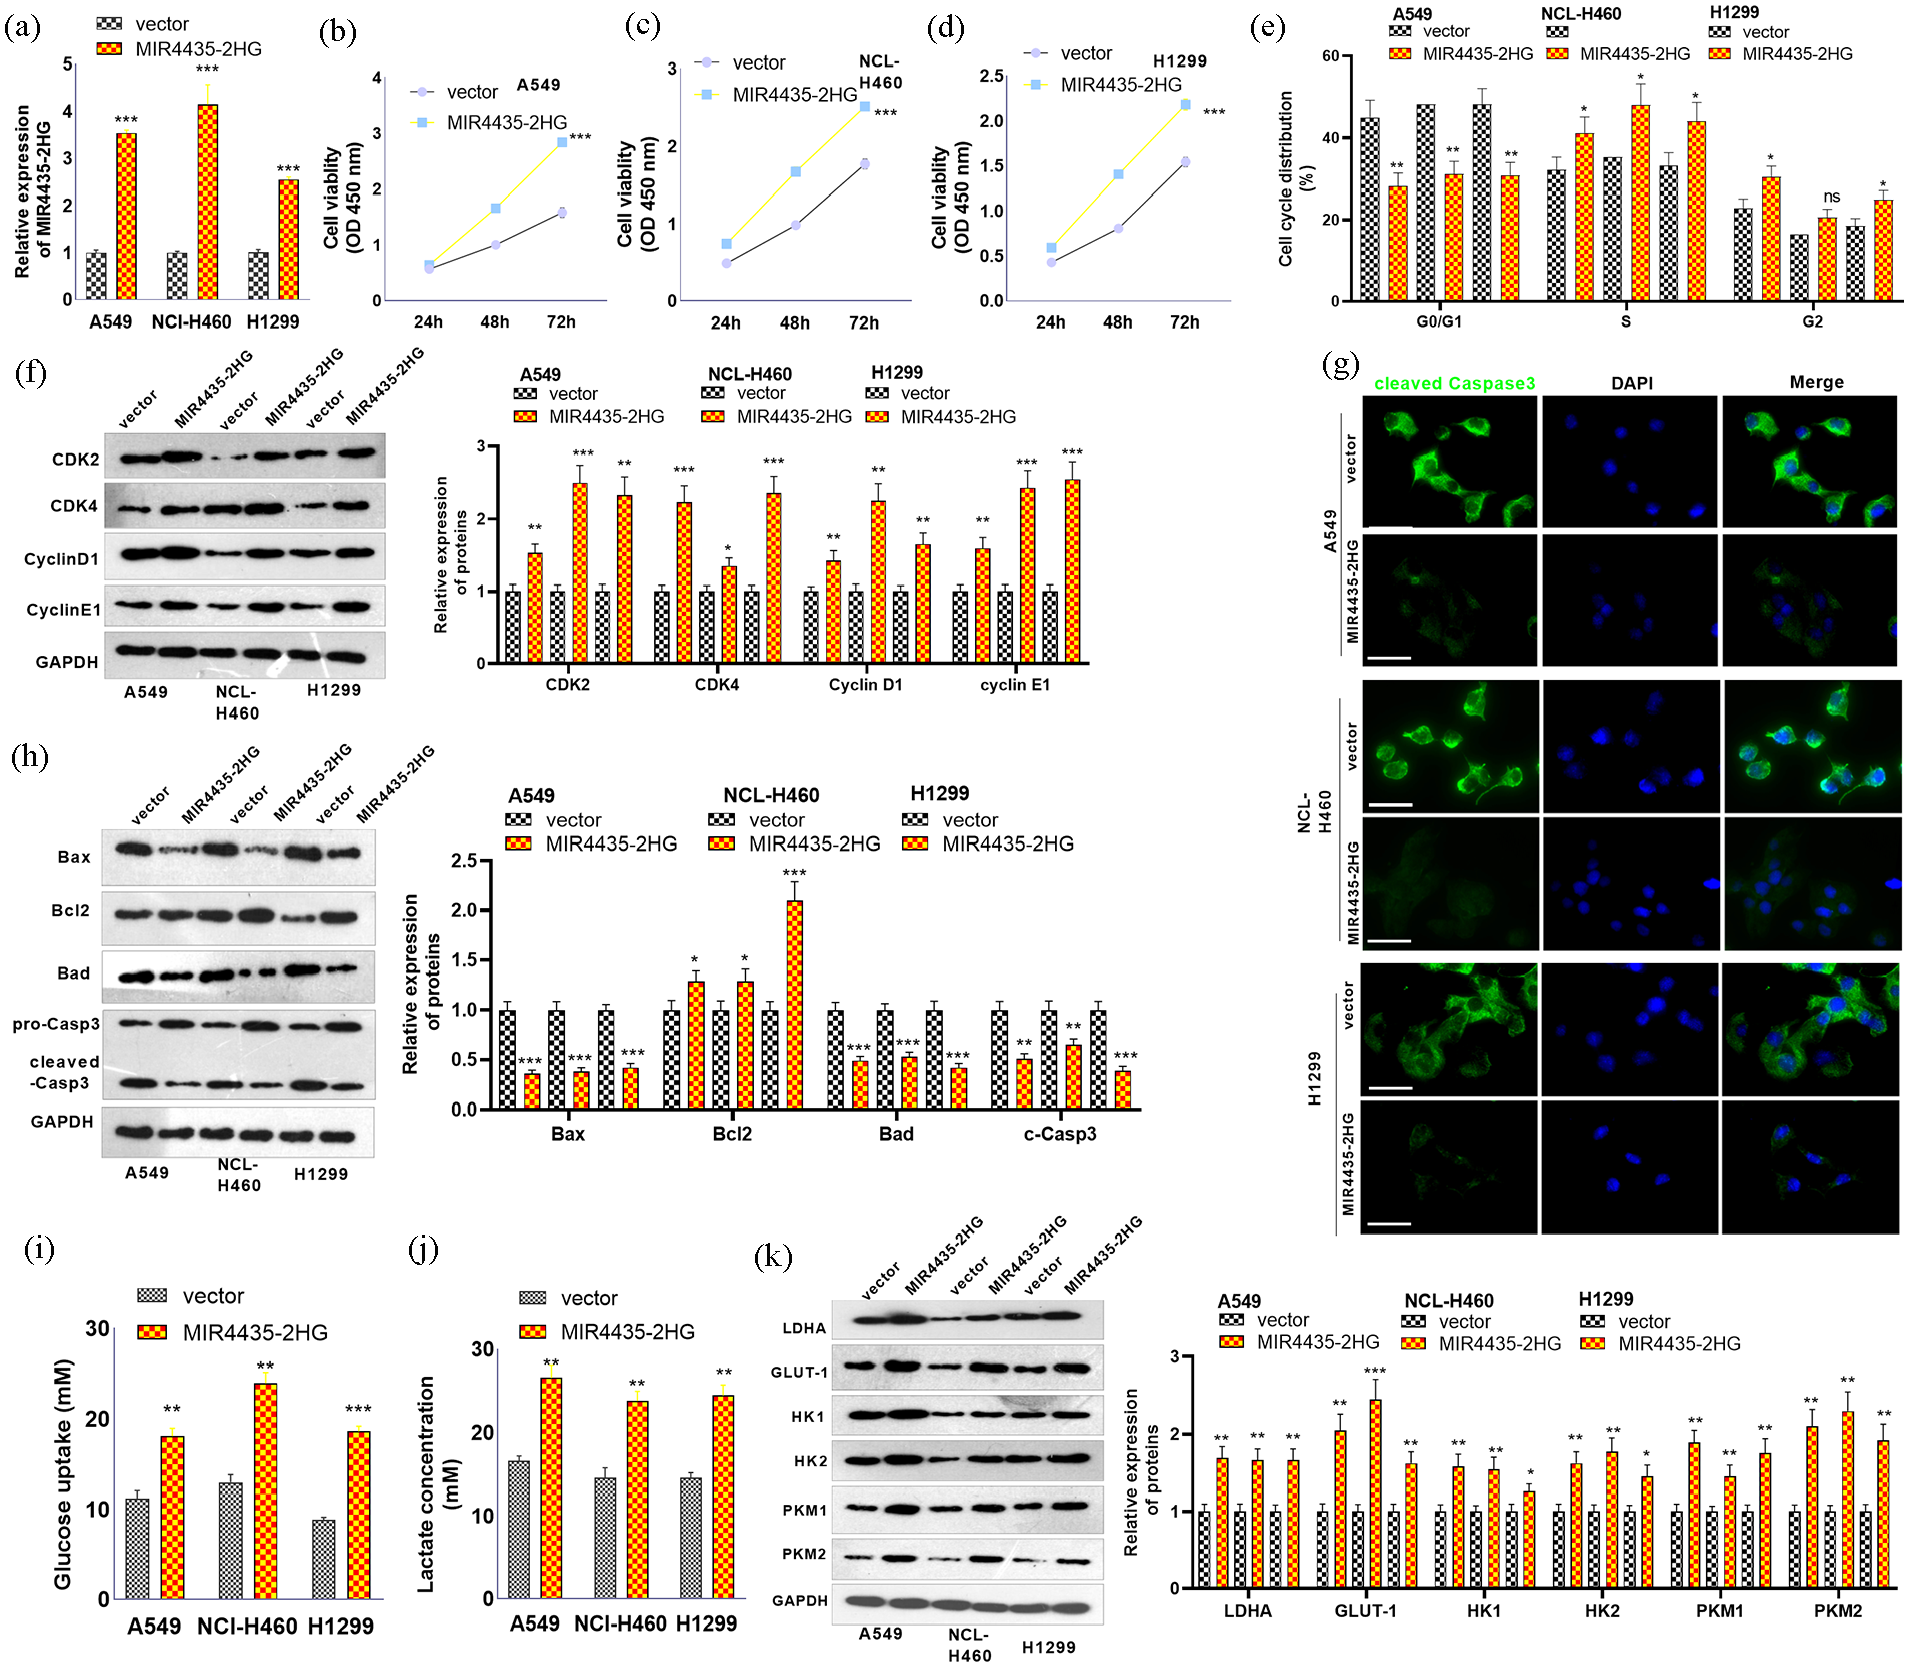
Effects of MIR4435-2HG overexpression on the proliferation, apoptosis, cell cycle, and glycolysis of NSCLC cells. MIR4435-2HG overexpression plasmids were transfected into A549, H1299, and NCI-H460 cells. (a) qRT-PCR was used to determine the transfection efficiency. (b–d) CCK-8 assay for detection of proliferation. (e) The cell cycle of NSCLC cells were determined by FCM. (f) Western blot analysis of CDK2, CDK4, CyclinD1, and CyclinE1 expression. (g) Cell apoptosis was induced by cisplatin (20 μM). Then, cell apoptosis was detected via IF and western blotting. (h) Western blotting was conducted to test the Bax, Bcl2, Caspase3, and Bad levels. (i and j) Glucose uptake and lactate production were detected. (k) The levels of LDHA, GLUT-1, HK1, HK2, PKM1, and PKM2 in three NSCLC cell lines were determined by western blotting.
MIR4435-2HG upregulation enhances NSCLC cell migration and invasion
Next, the metastasis of NSCLC cells was determined via a wound healing assay and a transwell assay. Compared with those of the vector group, the migratory and invasive abilities of A549, NCL-H460, and H1299 cells were promoted by MIR4435-2HG upregulation (Figure 3(a)–(d)). Next, we performed western blotting to test the profiles of four proteins involved in epithelial−mesenchymal transition (EMT). The results revealed that MIR4435-2HG upregulation led to reduced E-cadherin expression and elevated N-cadherin and vimentin levels (Figure 3(e)).

Overexpression of MIR4435-2HG promoted cell migration and invasion. MIR4435-2HG overexpression plasmids were transfected into A549, H1299, and NCI-H460 cells. (a and b) A wound healing assay was used to detect migration. (c and d) Transwell assays were used to detect invasion. (e) EMT-related proteins were detected via western blotting.
Overexpression of MIR4435-2HG promoted SOX2 and PI3K/Akt/mTOR pathway activation
We conducted RT-PCR to test SOX2 mRNA levels in three NSCLC lines. Compared with that in the vector group, the SOX2 mRNA level was increased by MIR4435-2HG (Figure 4(a)). We then transfected si-MIR4435-2HG into the above three NSCLC lines, and RT-PCR confirmed the transfection efficiency (Figure 4(b)). RT-PCR revealed that the SOX2 mRNA level was markedly decreased following MIR4435-2HG knockdown (Figure 4(c)). Western blotting was performed to test alterations in SOX2 and the PI3K/Akt/mTOR pathway. The upregulation of MIR4435-2HG contributed to SOX2 overexpression as well as increased levels of phosphorylated PI3K, Akt, and mTOR (Figure 4(d)). In contrast, MIR4435-2HG knockdown inhibited SOX2 levels and attenuated the phosphorylation of PI3K, Akt, and mTOR (Figure 4(e)).
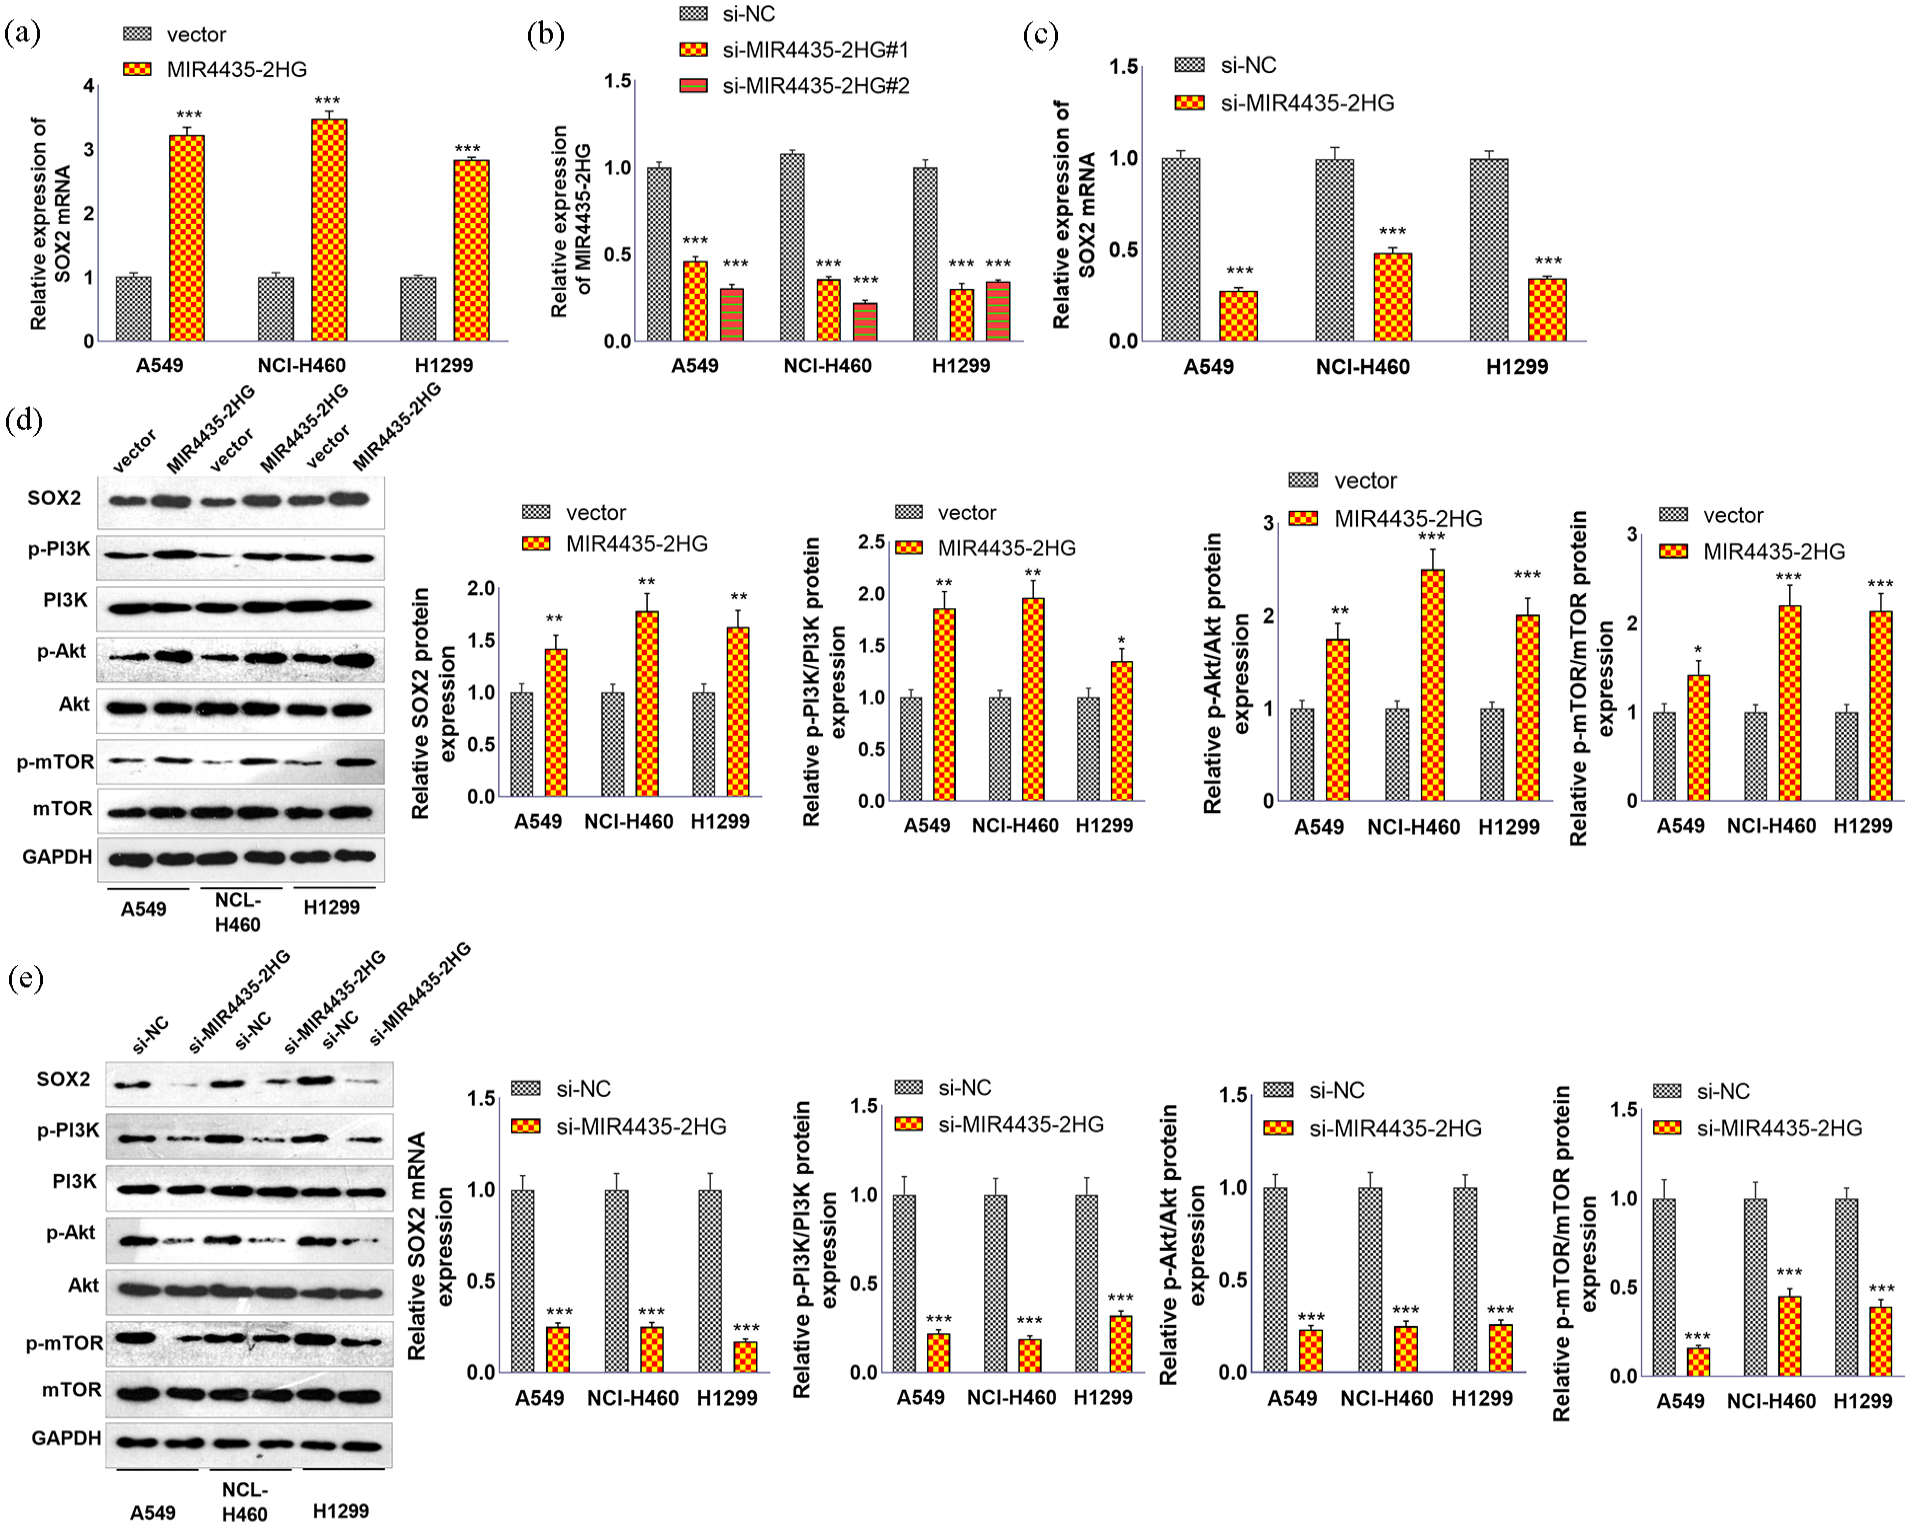
The effects of MIR4435-2HG on SOX2 and the PI3K/Akt/mTOR axis. MIR4435-2HG overexpression plasmids were transfected into A549, H1299, and NCI-H460 cells. (a) RT−PCR was conducted to test SOX2 mRNA levels in three NSCLC lines. (b and c) si-MIR4435-2HG was transfected into NSCLC lines, and RT-PCR was used to confirm the transfection efficiency and SOX2 mRNA level. (d and e) Western blotting was performed to test alterations in SOX2 and the PI3K/Akt/mTOR pathway.
Upregulating SOX2 weakens the inhibitory effects of si-MIR4435-2HG on lung cancer cells
To confirm the role of MIR4435-2HG and SOX2 in NSCLC, SOX2 overexpression plasmids were transfected into H460 cells. RT-PCR and western blotting confirmed that SOX2 expression was promoted by the SOX2 overexpression plasmid (Figure 5(a) and (b)). RT‒PCR also revealed that, compared with those in the si-MIR4435-2HG+vec group, SOX2 upregulation increased MIR4435-2HG and SOX2 levels (Figure 5(c)‒(e)). A CCK8 assay was conducted to test cell proliferation. MIR4435-2HG knockdown inhibited cell proliferation, whereas SOX2 upregulation promoted cell proliferation (Figure 5(f)). The levels of cell cycle-related proteins and apoptosis-related proteins were determined. MIR4435-2HG knockdown attenuated the levels of CDK2, CDK4, CyclinD1, and CyclinE1 (Figure 5(g)), increased cleaved Caspase3 expression (Figure 5(h)), increased Bax and Bad levels and decreased Bcl2 levels (Figure 5(i)). In contrast, SOX2 upregulation significantly increased CDK2, CDK4, CyclinD1, CyclinE1, and Bcl2 levels and decreased cleaved Caspase3, Bax, and Bad levels (Figure 5(g)–(i)). In addition, si-MIR4435-2HG inhibited glucose uptake and lactate production (Figure 5(j) and (k)) and suppressed LDHA, GLUT-1, HK1, HK2, PKM1, and PKM2 levels in H460 cells. Interestingly, SOX2 upregulation markedly recovered the profiles of glycolysis-related enzymes (Figure 5(l)). The migration and invasion of H460 cells were tested. si-MIR4435-2HG inhibited the migration and invasion of H460 cells. However, SOX2 upregulation enhanced cell migration and invasion (Figure 6(a)–(d)). EMT-related proteins were also examined. si-MIR4435-2HG enhanced E-cadherin and inhibited N-cadherin and vimentin. In contrast, SOX2 upregulation enhanced the EMT process (Figure 6(e)). The P3IK/Akt/mTOR pathway was also detected, and the data revealed that downregulation of MIR4435-2HG led to reduced levels of phosphorylated PI3K, Akt, and mTOR. SOX2 upregulation increased their levels (Figure 6(f)).

Effects of the MIR4435-2HG/SOX2 axis on the proliferation, apoptosis, cell cycle, and glycolysis of NSCLC cells. SOX2 overexpression plasmids were transfected into NCI-H460 cells. (a) qRT-PCR was used to determine the transfection efficiency. (b) Western blotting was used to test SOX2 expression. si-MIR4435-2HG and/or SOX2 overexpression plasmids were transfected into NCI-H460 cells. (c–e) RT-PCR was used to determine the transfection efficiency. Western blotting was used to test SOX2 expression. (f) CCK-8 assay for detection of proliferation. (g) Western blot analysis of CDK2, CDK4, CyclinD1, and CyclinE1 expression. (h) Cell apoptosis was detected via IF staining of cleaved Caspase3 in the cells. (i) Western blotting was conducted to test the Bax, Bcl2, Caspase3, and Bad levels. (j) Glucose uptake and lactate production were detected. (l) The expression of LDHA, GLUT-1, HK1, HK2, PKM1, and PKM2 in three NSCLC cell lines was determined by western blotting.
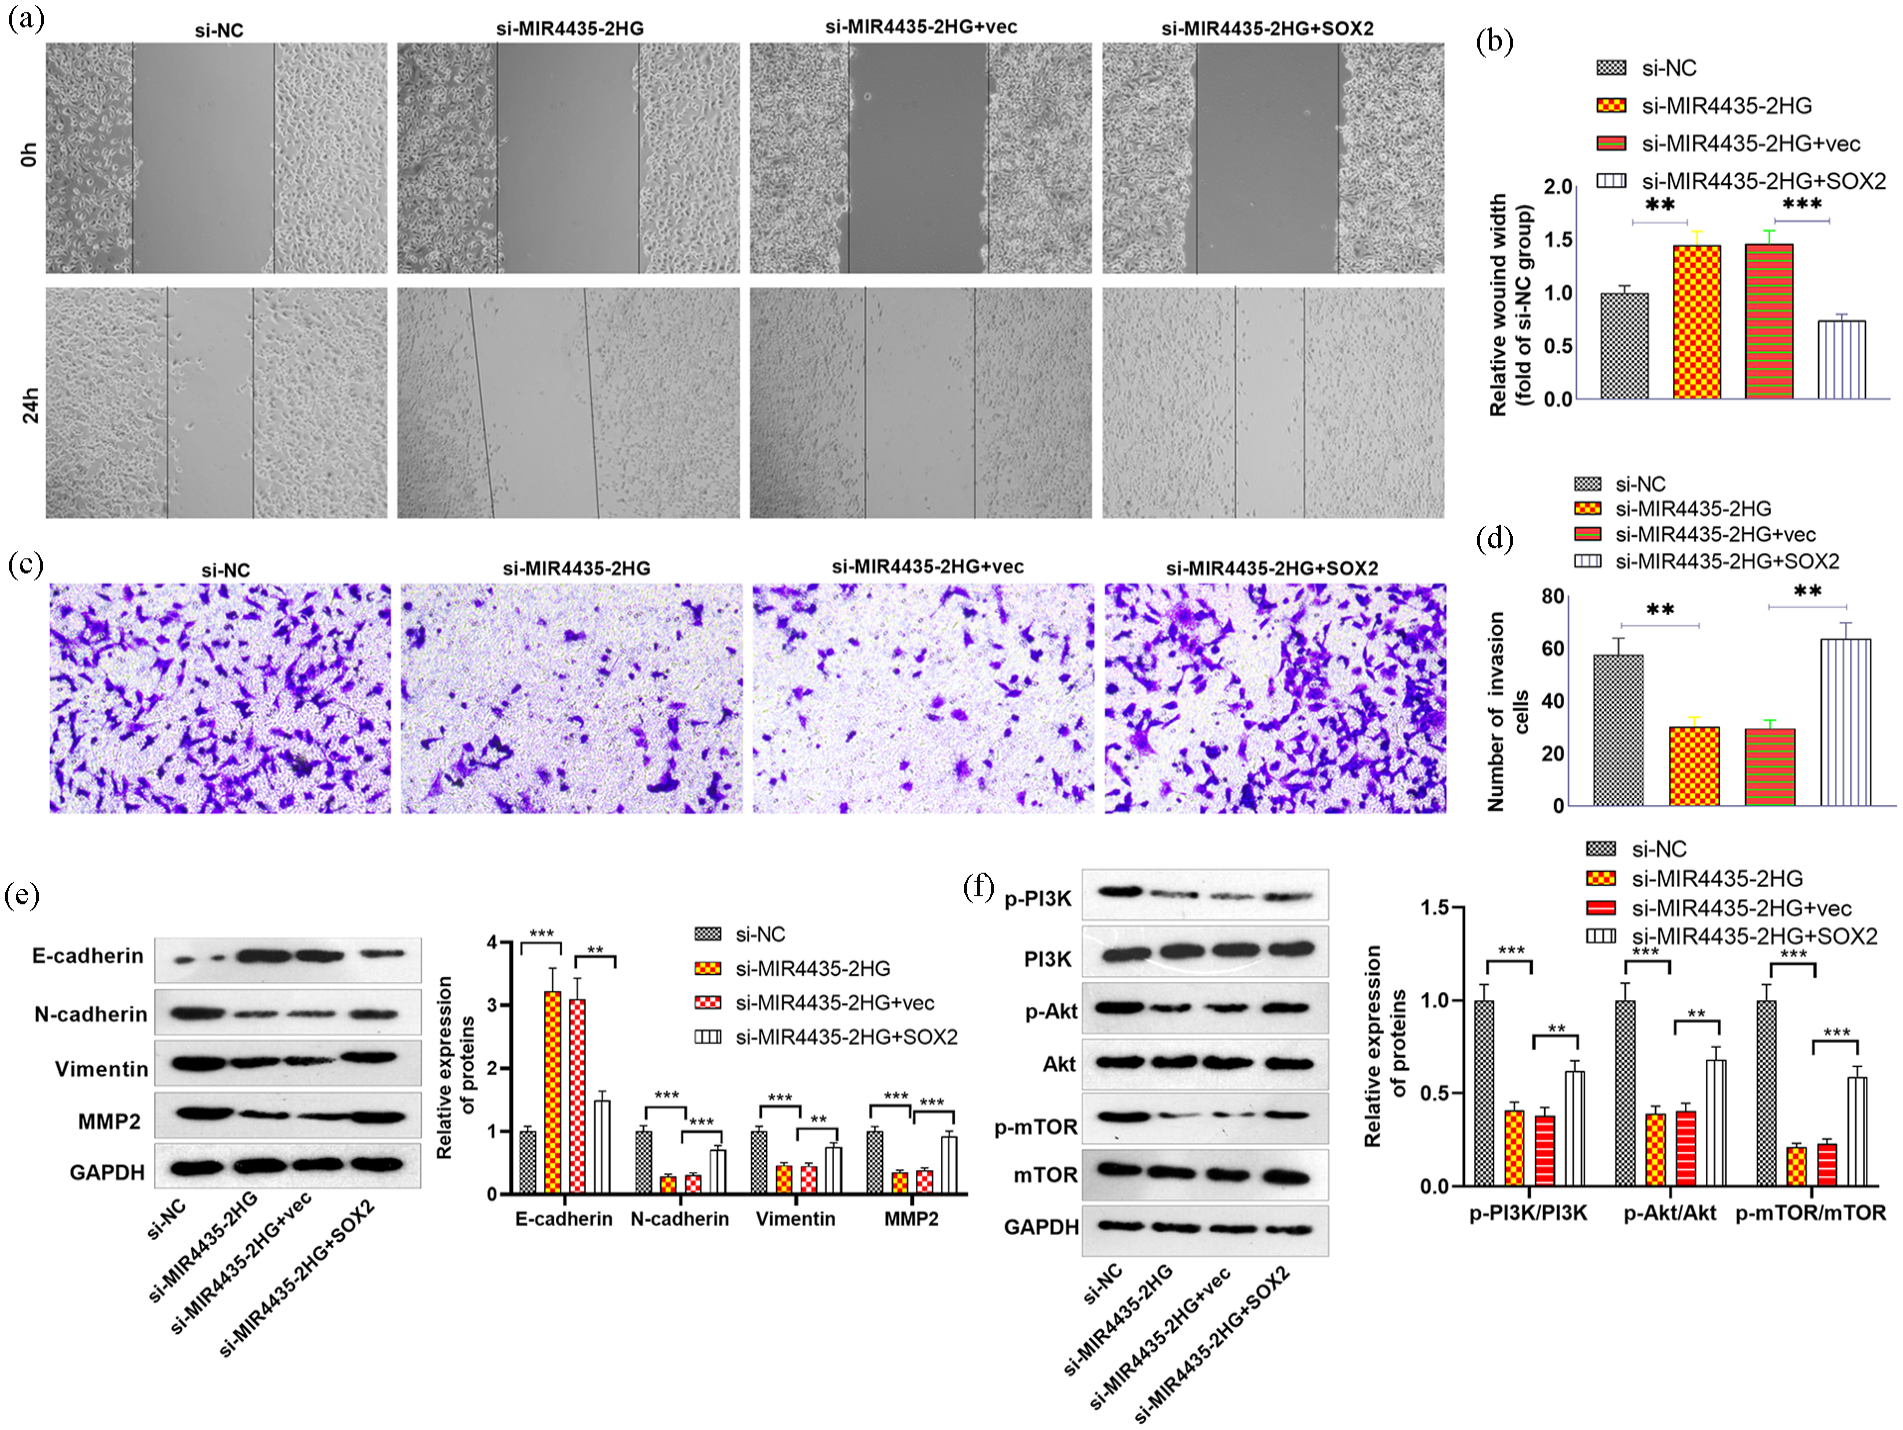
Overexpression of MIR4435-2HG promoted cell migration and invasion. si-MIR4435-2HG and/or SOX2 overexpression plasmids were transfected into NCI-H460 cells. (a) A wound healing assay was used to detect migration. (b) Transwell assays were used to detect invasion. (c and d) The relative wound width and number of invasive cells were calculated. (e and f) EMT-related proteins and the PI3K/Akt/mTOR pathway were detected via western blotting.
Upregulating SOX2 enhanced tumor cell growth in vivo
H460 cells transfected with si-MIR4435-2HG or si-MIR4435-2HG + SOX2 were utilized for in vivo experiments. Tumor volume was markedly attenuated following MIR4435-2HG downregulation, whereas SOX2 upregulation enhanced tumor growth (Figure 7(a)–(c)). We conducted histopathological examinations. The data revealed that MIR4435-2HG downregulation inhibited the number of KI-67-positive cells and increased the number of TUNEL-positive cells. However, SOX2 upregulation increased the number of Ki-67-positive cells and inhibited the number of TUNEL-positive cells (Figure 7(d)). Western blot analysis revealed that the expression of CDK2, CDK4, CyclinD1, CyclinE1, and Bcl2 was inhibited after MIR4435-2HG downregulation, whereas Bad and Bax expression was increased. In contrast, SOX2 overexpression promoted CDK2, CDK4, CyclinD1, CyclinE1, and Bcl2 expression and inhibited Bad and Bax expression (Figure 7(e) and (f)). Tissue IF was conducted to test LDHA expression in the tumor tissues. The data revealed that LDHA was downregulated in the si-MIR4435-2HG group and increased after SOX2 upregulation (Figure 7(g)). IHC was used to test SOX2 and PI3K/Akt/mTOR expression. SOX2, p-PI3K, p-Akt, and p-mTOR were downregulated after MIR4435-2HG downregulation. SOX2 upregulation increased SOX2, p-PI3K, p-Akt, and p-mTOR levels (Figure 7(h) and (i)).

Effects of the MIR4435-2HG-SOX2 axis on tumor growth. A nude mouse tumor model was constructed in which H460 cells downregulated MIR4435-2HG or upregulated SOX2. (a) Tumor images. (b) Tumor volume. (c) Tumor weight. (d) HE staining and IHC were used to detect the expression of Ki67 and TUNEL in the tumor tissues. Scale bar = 50 μm. (e and f) Western blot analysis of CDK2, CDK4, CyclinD1, CyclinE1, Bax, Bad, and Bcl2 in tumor tissues. (g) Tissue IF was conducted to test LDHA expression in the tumor tissues. Scale bar = 50 μm. (h and i) IHC was used to test SOX2 and PI3K/Akt/mTOR expression.
MIR4435-2HG directly targets miR-371a-5p, and SOX2 is the target of miR-371a-5p
We used starBase and TargetScan to predict the miRNA targets of MIR4435-2HG and SOX2. Three miRNAs were identified as sharing miRNA targets of MIR4435-2HG and SOX2 (Figure 8(a)). We subsequently conducted RT-PCR to examine these effects in H460 cells with MIR4435-2HG upregulation. The results revealed that miR-371a-3p was obviously repressed by MIR4435-2HG upregulation (Figure 8(b)). The base binding relationships of MIR4435-2HG with miR-371a-3p, SOX2 and miR-371a-3p are shown in Figure 8(c). Dual luciferase reporter gene analysis was performed to validate the binding of MIR4435-2HG to miR-371a-5p. HEK-239T cells were cotransfected with miR-NC and miR-371a-5p. The results revealed that the miR-371a-5p mimic inhibited the luciferase activity of MIR4435-2HG-WT and SOX2-WT but had no significant effect on the luciferase activity of MIR4435-2HG-Mut SOX2-Mut (Figure 8(d) and (e)). To further validate the interaction between MIR4435-2HG and SOX2, as well as between miR-371a-5p and SOX2 in NSCLC, we used qRT-PCR to detect the expression of SOX2 mRNA and Western blotting to detect the expression of the SOX2 protein. Compared with the vector group, the overexpression of MIR4435-2HG promoted the expression of SOX2 mRNA and protein, whereas the overexpression of miR-371a-5p inhibited the expression of SOX2 mRNA and protein (Figure 8(f) and (g)). Compared with si-NC, MIR4435-2HG inhibited the expression of SOX2 mRNA and protein. After transfection with miR-371a-5p, the expression of SOX2 mRNA and protein was upregulated (Figure 8(h) and (i)).
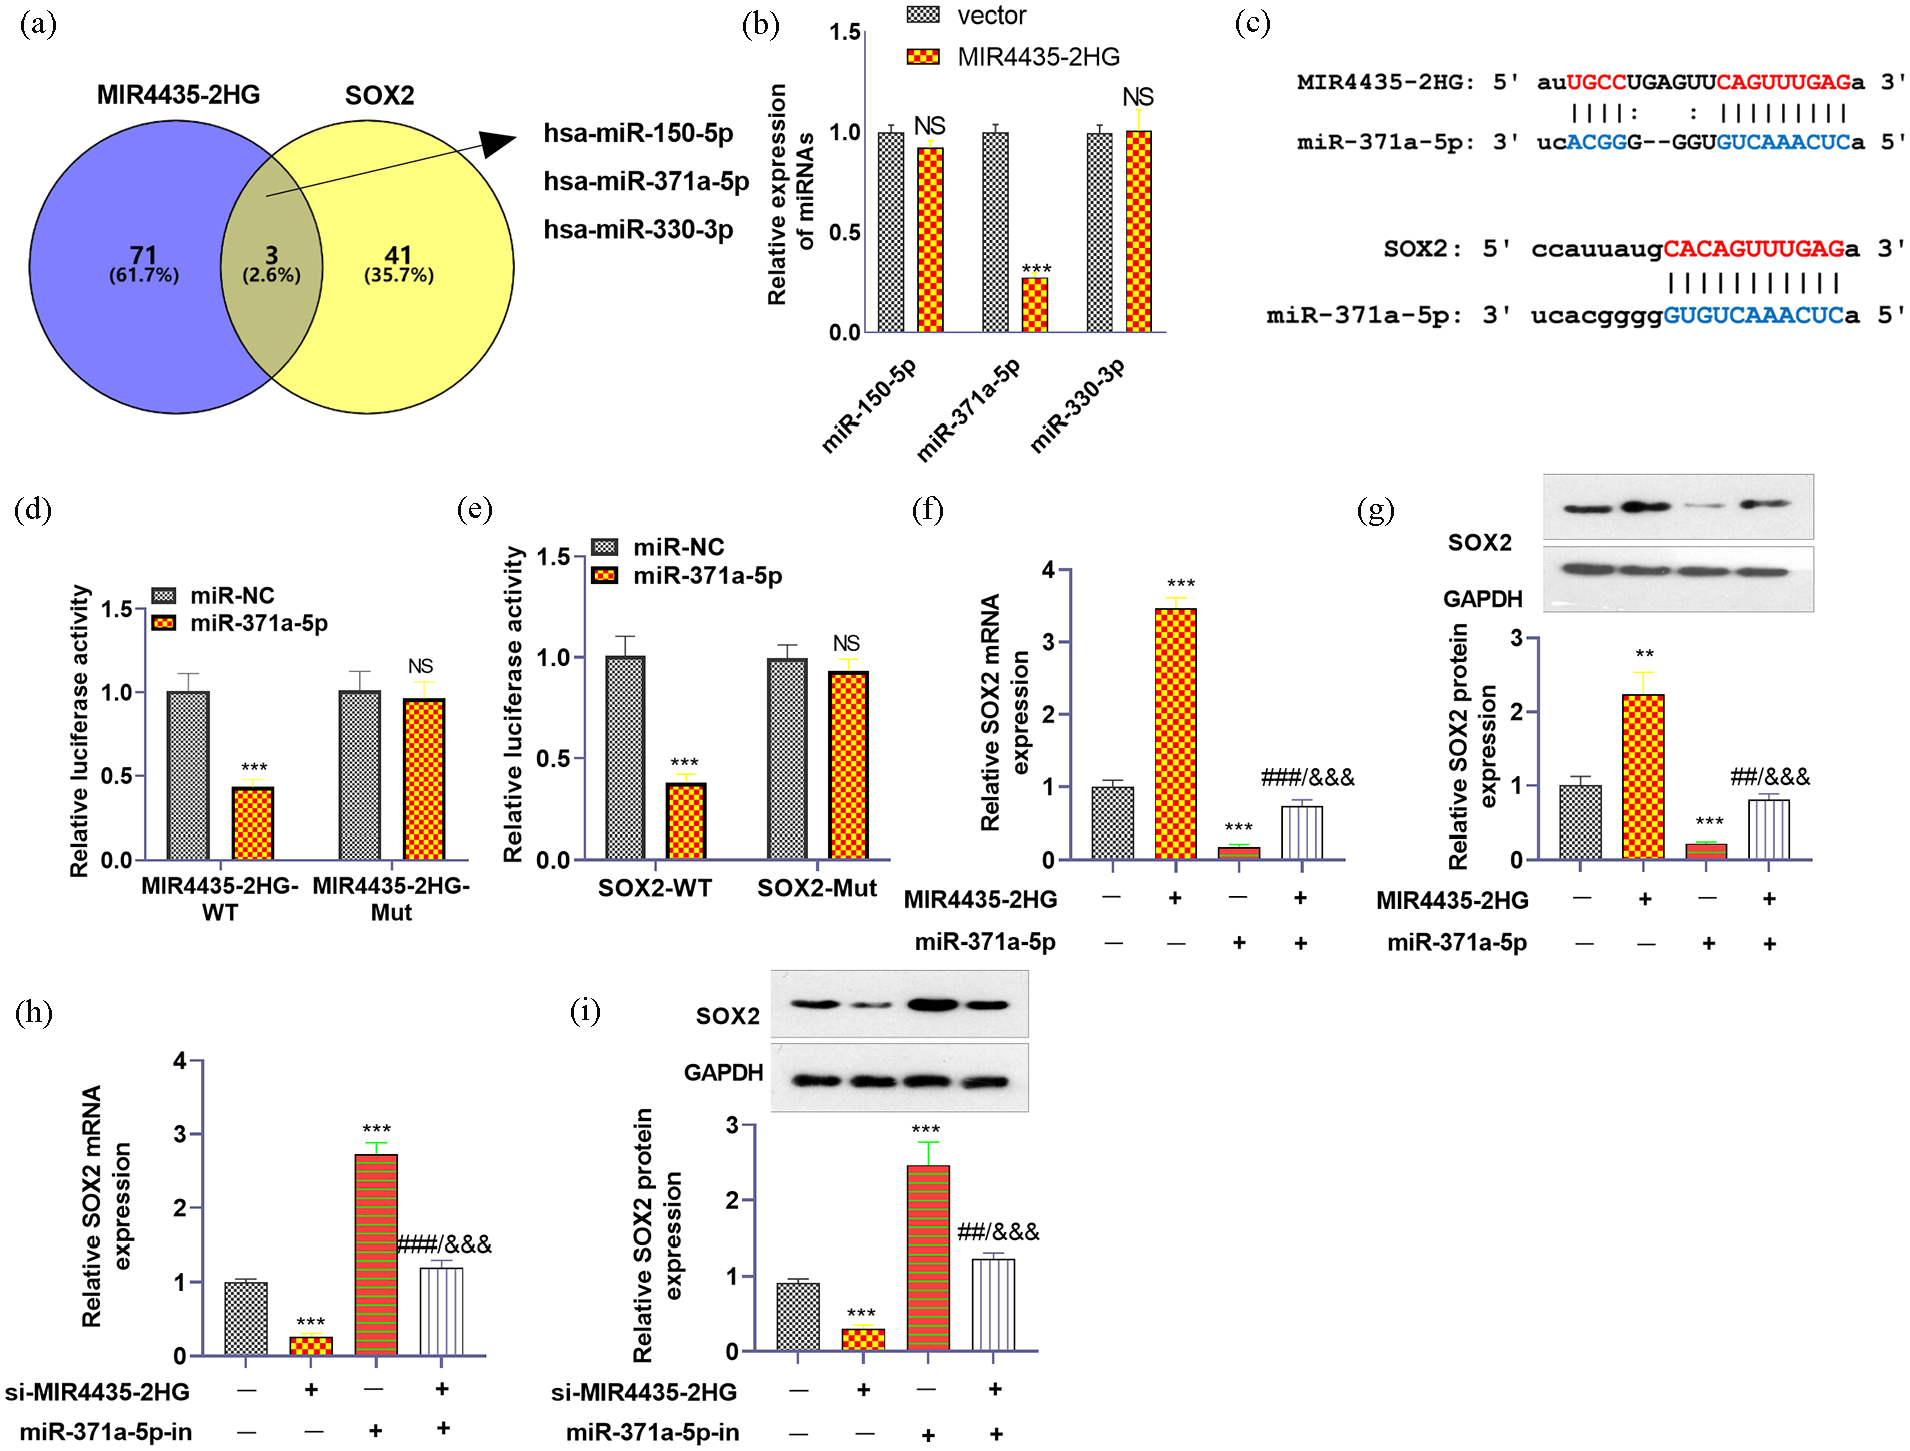
miR-371a-3p was the target of MIR4435-2HG and SOX2. (a) starBase (https://starbase.sysu.edu.cn/agoClipRNA.php?source=lncRNA) and TargetScan (http://www.targetscan.org/vert_72/) were used to predict the miRNA targets of MIR4435-2HG and SOX2. (b) RT-PCR was conducted to test the three miRNAs that share targets with MIR4435-2HG and SOX2. (c) The binding sites of MIR4435-2HG with miR-371a-5p, SOX2, and miR-371a-3p. (d) The binding of MIR4435-2HG and miR-371a-5p was validated through a dual luciferase assay. (e) The binding of SOX2 and miR-371a-5p was validated through a dual luciferase assay. (f and g) qRT-PCR and western blotting were used to detect the expression of SOX2 mRNA and protein after overexpression of MIR4435-2HG or miR-371a-5p, respectively. (h and i) qRT-PCR and western blotting were used to detect the expression of SOX2 mRNA and protein after MIR4435-2HG was knocked down or miR-371a-5p was inhibited, respectively.
Overexpression of miR-371a-5p or SOX2 downregulation weakens the promoting effects of MIR4435-2HG
To investigate the regulatory effects of MIR4435-2HG/miR-371a-5p/SOX2 on the development of NSCLC cells, we transfected MIR4435-2HG, miR-371a-5p mimics, or si-SOX2 into H460 cells. RT-PCR and western blotting confirmed that SOX2 was promoted by the MIR4435-2HG overexpression plasmid and that both the miR-371a-5p mimic and si-SOX2 inhibited SOX2 expression (Figure 9(a) and (b)). A CCK8 assay revealed that, compared with the MIR4435-2HG group, the miR-371a-5p mimic and si-SOX2 groups exhibited inhibited cell proliferation (Figure 9(c)). Compared with the MIR4435-2HG overexpression group, the miR-371a-5p mimic and si-SOX2 groups presented attenuated levels of CDK2, CDK4, CyclinD1, and CyclinE1 (Figure 9(d)); increased cleaved Caspase3 expression (Figure 9(e)); increased Bax and Bad levels; and decreased Bcl2 levels (Figure 9(f)). In addition, miR-371a-5p mimics and si-SOX2 inhibited glucose uptake and lactate production (Figure 9(g) and (h)) and suppressed LDHA, GLUT-1, HK1, HK2, PKM1, and PKM2 levels in H460 cells (Figure 9(i)). The migration and invasion of H460 cells were tested. Compared with the MIR4435-2HG group, the miR-371a-5p mimic and si-SOX2 groups inhibited the migration and invasion of H460 cells (Figure 9(j)–(m)). EMT-related and PI3K/Akt/mTOR proteins were also examined. The western blot data revealed that the miR-371a-5p mimics and si-SOX2 enhanced E-cadherin and inhibited N-cadherin and vimentin (Figure 9(n)). The miR-371a-5p mimics and si-SOX2 reduced the levels of phosphorylated PI3K, Akt, and mTOR (Figure 9(o)).

miR-371a-3p upregulation or SOX2 knockdown weakens the promoting effects of MIR4435-2HG on cancer cells. si-SOX2 and miR-371a-5p mimics were transfected into H460 cells with MIR4435-2HG downregulation. (a and b) RT-PCR was used to determine SOX2 mRNA expression, and western blotting was used to test SOX2 expression. (c) CCK-8 assay for detection of proliferation. (d) Western blot analysis of CDK2, CDK4, CyclinD1, and CyclinE1 expression. (e) Cell apoptosis was detected via IF staining of cleaved Caspase3 in cells treated with cisplatin (20 μM). (f) Western blotting was conducted to test the Bax, Bcl2, Caspase3, and Bad levels. (g) Glucose uptake and lactate production were detected. (i) The expression of LDHA, GLUT-1, HK1, HK2, PKM1, and PKM2 was determined by western blotting. (j–m) A wound healing assay was used to detect migration. Transwell assays were used to detect invasion. (n–o) EMT-related proteins and the PI3K/Akt/mTOR pathway were detected via western blotting.
Discussion
During lung cancer progression, epigenetic modifications play pivotal roles, as they both influence the expression of cancer-associated genes and affect the malignant behaviors of cancer cells. 30 In addition to their role in genomic and epigenomic programs, lncRNAs play crucial roles in NSCLC through specific transcriptional and posttranscriptional control.31,32 Here, we conducted both in vitro and in vivo experiments to examine the role of MIR4435-2HG in NSCLC development and found that MIR4435-2HG promoted NSCLC progression by mediating proliferation, apoptosis, migration, invasion, and glycolysis.
Recently, an increasing number of studies have suggested that lncRNAs are altered in NSCLC. These lncRNAs not only are associated with the clinical outcomes of NSCLC patients but also directly affect the malignancy of tumor cells.33,34 For example, the lncRNA RGMB-AS1 is expressed at lower levels in NSCLC patients, and its lower level is associated with advanced tumor stage and poor overall survival. In an RGMB-AS1-overexpressing cell model, the growth of tumor cells was markedly restrained in a mouse xenograft model. 35 Targeting lncRNAs can also affect the immune microenvironment of lung cancer cells. Zheng et al. 36 reported that downregulating the lncRNA MIR17HG led to the inhibition of cell proliferation, tumorigenicity, and immune capacity in Tregs. Moreover, Liu et al. 37 reported that the level of lncRNA16 was elevated in the serum of NSCLC patients with a poor response to platinum-based chemotherapy. LncRNA16 mediated the chemoresistance of NSCLC cells by inhibiting ROS generation via the HBB/NDUFAF5 axis. This study suggested that the combination of first-line platinum-based chemotherapy with lncRNA16 expression intervention can hopefully overcome chemoresistance.
Multiple studies have shown that MIR4435-2HG, an oncogene, induces cancer cell proliferation and migration and plays a crucial role in regulating the malignant progression of various cancers.38,39 MIR4435-2HG has been identified as a biomarker for all types of cancer and is involved in promoting tumor formation through six signaling pathways: the TGF-β, Wnt/β-catenin, MDM2/p53, PI3K/AKT, Hippo, and MAPK/ERK pathways. 40 In this study, we found that the lncRNA MIR4435-2HG was highly expressed in NSCLC cells and tissues. MIR4435-2HG knockdown promoted NSCLC cell proliferation, migration, invasion, and glycolysis while inhibiting cell apoptosis. In addition, we also found that knocking down MIR4435-2HG inhibited the expression of the cell cycle-related genes CDK4 and CDK6. Cyclin-dependent kinases (CDKs) are key regulatory factors for cell cycle progression. CDK4 and CDK6 form complexes with D-type cyclin D, and the activated cyclin D-CDK4/6 complex promotes cell cycle G1 progression and G1−S phase transition by phosphorylating the Rb tumor suppressor protein. 41 The inhibition of CDK4 and CDK6 is considered to play a crucial role in the treatment of NSCLC. 42 Consistent with previous findings, MIR4435-2HG may play a carcinogenic role in NSCLC.
miRNAs play important roles in gene regulation and have been implicated in the development and progression of NSCLC. 43 MiRNAs have been identified as potential biomarkers for NSCLC diagnosis, prognosis, and treatment response. Aberrant expression levels of specific miRNAs in tumor tissues, blood, or other body fluids have been associated with NSCLC development and progression.44,45 For example, via microarray platform screening, Genova et al. 46 reported that miR-181a-5p and miR-574-5p are delivered by circulating extracellular vesicles and serve as promising prognostic markers for NSCLC patients receiving nivolumab treatment. 46 miRNAs play a role in regulating chemoresistance and immune therapy resistance in NSCLC.47,48 Thus, miRNAs have emerged as potential therapeutic targets for NSCLC treatment. Strategies to modulate miRNA expression, such as the use of miRNA mimics or inhibitors, are being explored as novel therapeutic approaches to inhibit tumor growth and metastasis and overcome drug resistance in NSCLC.49,50
LncRNAs can interact with various miRNAs to inhibit miRNA expression and further activate the expression of target genes. 51 MIR4435-2HG can also regulate tumor development by sponging miRNAs.52,53 In this study, we used the StarBase online tool to predict binding sites between MIR4435-2HG and miR-371a-5p and validated them through dual-luciferase reporter gene experiments and RIP. The qRT-PCR results revealed low expression of miR-371a-5p in NSCLC, and Pearson’s correlation analysis revealed a negative correlation between MIR4435-2HG and miR-371a-5p. The overexpression of MIR4435-2HG inhibited the expression of miR-371a-5p. However, the role of miR-371a-5p varies among different cancers. Previous studies have shown that miR-371a-5p is upregulated in HCC cells and promotes resistance to oxaliplatin. 54 In addition, miR-371a-5p, a carcinogen, promotes the occurrence and development of hepatocellular carcinoma and pancreatic cancer.55,56 A recent study showed that a miR-371a-5p mimic weakened the chemical resistance of colon cancer cells to cetuximab. 57 Here, we demonstrated that miR-371a-5p plays an antitumor role in NSCLC. Further research has shown that sex-determining region Y-box 2 (SOX2) is a target of miR-371a-5p, with a negative correlation between miR-371a-5p and SOX2 in NSCLC and a positive correlation between MIR4435-2HG and SOX2. Knocking down SOX2 weakened the miR-371a-5p inhibitor-mediated procancer effects.
The SOX family of transcription factors plays crucial roles in various biological processes, and dysregulation of Sox genes has been implicated in cancer development and progression in a variety of tumor types.58,59 For example, increased WNT2 enhances the chemoresistance and tumorigenicity of gastric cancer cells by forming a WNT2−SOX4 feedback loop. 60 SOX2 is a transcription factor that contains three structural domains, including HMG, DIM, and TAD domains. The TAD domain of SOX2 can bind to the promoters of various target genes and transactivate or inhibit the expression of target genes. 61 The expression and role of SOX2 in cancer have been fully studied. According to reports, SOX2 is overexpressed in more than 25 human cancers, and upregulation of SOX2 expression promotes cancer cell proliferation, migration, invasion, and tumor metastasis. 62 SOX2 regulates multiple signaling pathways that promote cell proliferation, survival, and tumor development. 63 An increasing number of studies have indicated that various miRNAs can regulate the expression of SOX2 at the posttranscriptional level. For example, in NSCLC, miR-638 expression is downregulated, and SOX2 expression is upregulated. MiR-638 can directly bind to the 3′-UTR of SOX2 and inhibit the expression of SOX2, thereby inhibiting NSCLC cell proliferation, invasion, and EMT. 64 MiR-625 mitigates esophageal cancer cell viability and migration by targeting SOX2 translation. In addition, studies have shown that SOX2 is involved in regulating metabolic reorganization in tumor cells. Increased expression of SOX2 is positively correlated with increased glycolytic activity in prostate cancer. 65 In this study, we confirmed that miR-371a-5p inhibits SOX2 by binding to its 3′-UTR. Knocking down SOX2 inhibits the proliferation, migration, invasion, and glycolysis of NSCLC cells and promotes cell apoptosis.
The PI3K pathway is frequently dysregulated in cancer, leading to constitutive activation of downstream signaling cascades, such as the Akt/mTOR pathway. Aberrant activation of PI3K results in increased cell proliferation, survival, and metabolism, promoting tumor growth and progression. 66 The upregulation of the SOX2 and PI3K pathways plays a vital role in cancer development. For example, fibronectin (FN) enhances the stemness of NSCLC cells by promoting the activation of the integrin αvβ3/PI3K/AKT signaling pathway, which is dependent on SOX2. 67 Moreover, the activation of the PI3K pathway can upregulate the expression of glucose transporters (e.g., GLUT1) and glycolytic enzymes, promoting enhanced glucose uptake and glycolytic metabolism in cancer cells. 68 The PI3K pathway can induce and sustain the Warburg effect by increasing glycolytic flux and redirecting glucose metabolism toward biosynthetic pathways that support tumor growth and proliferation. 69 Therefore, targeting the PI3K-mediated regulation of glycolysis offers new opportunities for developing novel precision medicine approaches to treat cancer and improve patient outcomes. We also found that SOX2 upregulation promoted PI3K/Akt/mTOR pathway activation. Targeting MIR4435-2HG or miR-371a-3p can significantly regulate the SOX2-PI3K/Akt/mTOR axis.
To our knowledge, this study reveals a novel regulatory axis, namely, the MIR4435-2HG/miR-371a-5p/SOX2/PI3K/Akt/mTOR axis, involved in NSCLC development. Targeting this axis can significantly restrain the progression of NSCLC. Nevertheless, there are several limitations to this study. First, clinical NSCLC cases and tumor samples should be collected, and the expression of the MIR4435-2HG/miR-371a-3p/SOX2-PI3K/Akt/mTOR axis in the samples should be determined to analyze the diagnostic role of the axis in NSCLC. Alterations in NSCLC patients receiving adjuvant radiotherapy and chemotherapy should also be detected, which may provide a new reference for the treatment of NSCLC patients with clinical complications. Second, the antitumor effects of miR-371a-5p in MIR4435-2HG- or SOX2-mediated oncogenic functions in NSCLC require further investigation in animal studies.
Conclusion
In summary, this study suggested that MIR4435-2HG is highly expressed in NSCLC and is associated with poor survival in NSCLC patients. MIR4435-2HG aggravated the malignant behaviors of NSCLC cells through repressing miR-371a-5p and activating the SOX2/PI3K/Akt/mTOR pathway. MiR-371a-5p targeted SOX2 and inhibited its expression. Therefore, this novel MIR4435-2HG/miR-371a-5p/SOX2/PI3K/Akt/mTOR axis is a potential diagnostic marker and therapeutic target for NSCLC.
Footnotes
Acknowledgements
Not applicable.
Author contributions
Conceived and designed the experiments: Jin Yang and Yu Su. Performed the experiments: Jin Yang, Yuchen Wang, and Chuang Li. Statistical analysis: Yu Su, Yuchen Wang, and Kun Gao. Wrote the paper: Mengmeng Li and Jin Yang. All the authors have read and approved the final manuscript.
Declaration of conflicting interests
The author(s) declared no potential conflicts of interest with respect to the research, authorship, and/or publication of this article.
Funding
The author(s) received no financial support for the research, authorship, and/or publication of this article.
Ethics statement
Ethical approval for this study was obtained from the Ethics Review Board of Hebei General Hospital (Approval no. HBGH-2022-0224).
Consent for publication
Not applicable.
Animal welfare
The present study followed international, national, and/or institutional guidelines for humane animal treatment and complied with relevant legislation.
Data availability statement
The datasets used and analyzed during the current study are available from the corresponding author upon reasonable request.