
Abstract
Objective:
The cause of syncope is generally determined based on clinical manifestations. There has been little discussion about the value of electrocardiograms for diagnosing neurally mediated syncope. The aim of this study was to test the predictive value of the isolated very low QRS voltage in tilt-table testing for suspected neurally mediated syncope in a Chinese population.
Methods:
This retrospective study enrolled patients with suspected neurally mediated syncope. Tilt-table testing was a part of the diagnostic examination. Each patient underwent echocardiography and electrocardiogram. isolated very low QRS voltage referred to a voltage of ⩽0.3 mV for the QRS complex in an isolated frontal lead or ⩽0.7 mV for the QRS complex in an isolated precordial lead.
Results:
In total, 157 patients were included in the tilt-table testing positive group, and 242 patients were included in the tilt-table testing negative group. Compared with the testing negative group, the testing positive group had more patients with isolated very low QRS voltage in the frontal leads (p < 0.001). Moreover, for patients with isolated very low QRS voltage in the precordial leads, no significant difference was noted between the testing positive group and testing negative group (p = 0.289). Isolated very low QRS voltage in the frontal leads demonstrated 84.08% sensitivity and 74.38% specificity for a positive tilt-table testing response. The area under the curve of isolated very low QRS voltage for a positive tilt-table testing response in frontal leads was 0.806 (p < 0.0001).
Conclusion:
In patients with suspected neurally mediated syncope, isolated very low QRS voltage in the frontal leads is a parameter that can predict a positive tilt-table testing response. The presence of isolated very low QRS voltage in frontal leads can serve as a parameter for evaluating syncope patients.
Keywords
Introduction
An episode of syncope occurs when cerebral hypoperfusion causes a sudden and transient loss of consciousness. 1 Syncope contributes to approximately 1%–3% of emergency department visits and associated with 6% of hospital admissions, resulting in a high hospitalization rate and high medical costs.2,3 The combined diagnostic yield of syncope is only 50%. 4 The cause of syncope is generally determined based on clinical manifestations, but an electrocardiogram (ECG) can also be valuable. According to the ACC/AHA/HRS syncope guidelines, ECG is recommended as a class I diagnostic tool along with clinical history and physical examination, as ECG can help identify the potential arrhythmogenic causes of syncope attacks during this period. 5 Holter ECG is also valuable for diagnosing arrhythmic syncope in selected patients. 6 However, there is little discussion about the value of ECG for diagnosing reflex syncope. Compared with patients with arrhythmic syncope, patients with neurally mediated syncope (NMS) have less baseline ECG information. However, ECG can still provide some clues for the diagnosis of NMS.
Low electrocardiographic QRS voltage (LQRSV) is traditionally defined by a zenith-to-nadir QRS voltage of <0.5 mV for all frontal leads and a QRS voltage of <1 mV for all precordial leads. LQRSV is associated with various cardiac and noncardiac diseases. Cardiac diseases, such as cardiomyopathy with myocardial scar formation or fiber fat replacement, are associated with a decrease in the potential generated by the heart. Noncardiac diseases, such as emphysema or obesity, are related to the attenuation effect and reduced conduction from an enlarged volume outside the pericardial space. 7 A recent study revealed that the presence of isolated very low voltage QRS complexes may be related to NMS. Isolated very low QRS voltage (IVLV) refers to a voltage of ⩽0.3 mV for the QRS complex in an isolated frontal lead or ⩽0.7 mV for the QRS complex in an isolated precordial lead on ECG (Figure 1).8–10 Blendea et al. first described that IVLV in the frontal leads could predict a positive response to tilt-table testing (TTT) in suspected NMS patients with a sensitivity of 78% and a specificity of 68%. 8 In clinical work, we found that some NMS patients with a positive TTT result have a low-voltage QRS complex in an isolated frontal or precordial lead on ECG. The purpose of this study was to test the predictive value of IVLV for TTT in Chinese patients with suspected NMS.
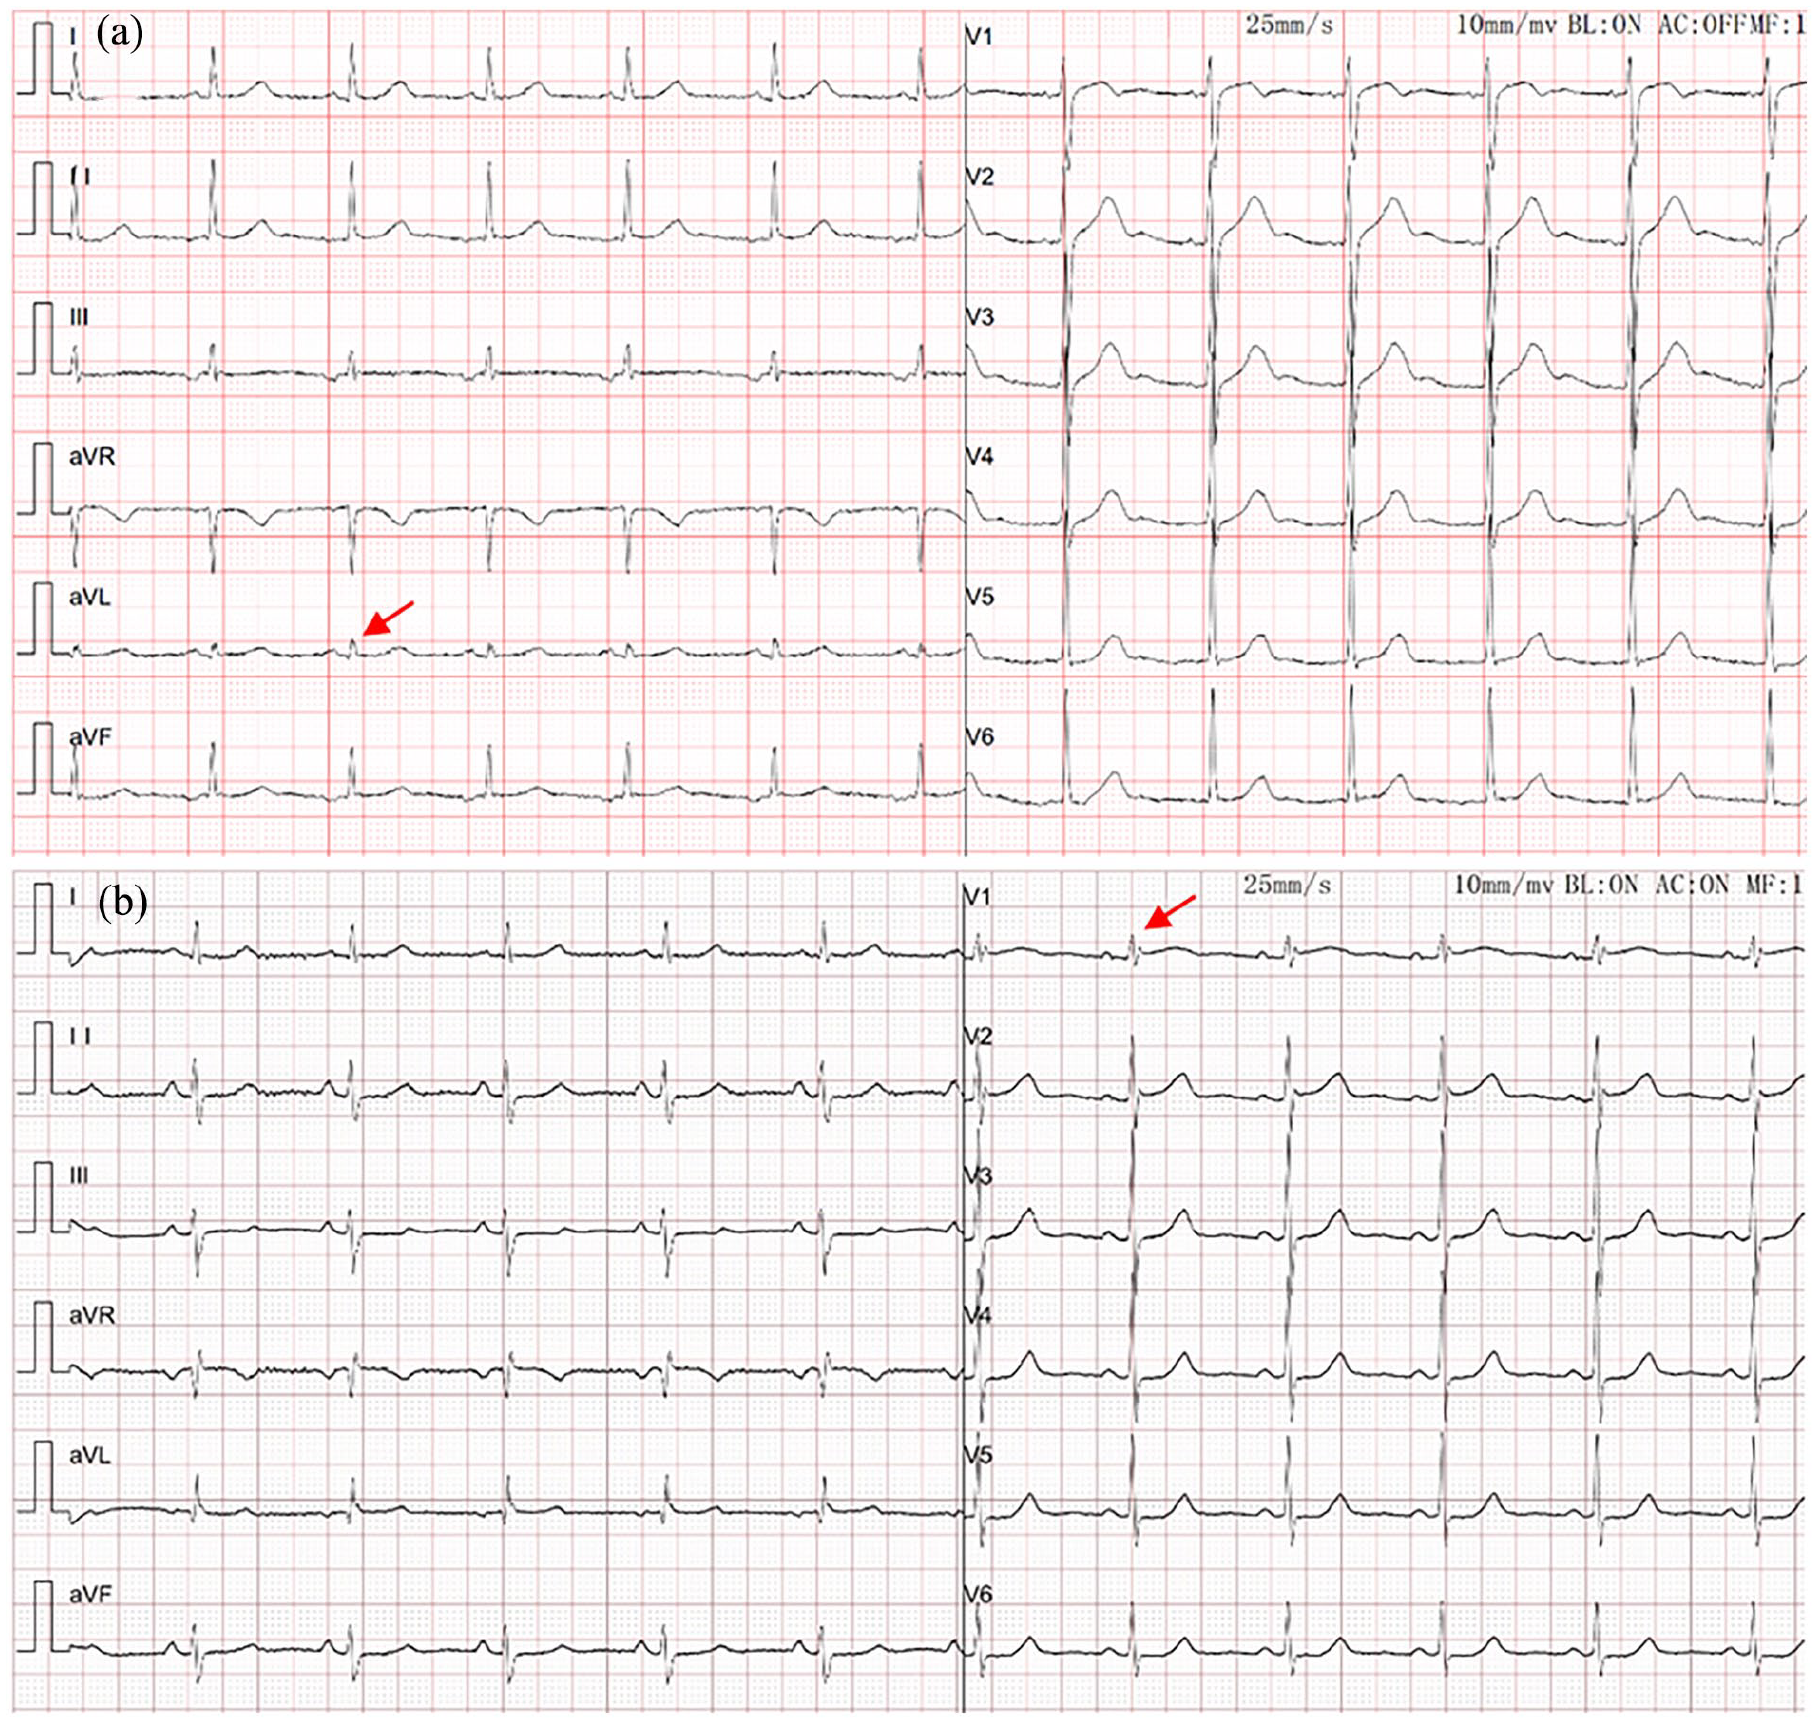
IVLV is observed in the aVL lead (a) and V1 lead (b) for patients with NMS and a positive TTT response (red arrow).
Materials and methods
Study design and study population
From March 2019 to January 2023, this retrospective study enrolled consecutive patients who were suspected of having NMS at our hospital (Shaanxi Provincial People’s Hospital, Xi’an, Shaanxi Province, China). TTT was a part of the diagnostic examination. Syncope referred to transient loss of consciousness due to cerebral hypoperfusion, which manifests rapidly, lasts only a few seconds, and spontaneously reverses on its own. Presyncope refers to the condition in which a patient feels they are about to succumb to syncope, but the patient does not experience a transient loss of consciousness. 11 NMS was suspected when clinical features suggested that reflex mechanisms led to vasodilation, bradycardia, or both.5,11 Echocardiography and TTT were performed within 2 days. Twelve-lead ECG and TTT were performed within 2 days. The exclusion criteria included heart failure (left ventricular ejection fraction (LVEF) <40%, NYHA functional class III–IV), history of myocardial infarction, hypertrophic cardiomyopathy, dilated cardiomyopathy, infiltrative cardiac diseases, takotsubo syndrome, arrhythmogenic right ventricular cardiomyopathy, pericardial effusion, pericarditis, valvular heart disease (moderate-to-severe valve insufficiency or stenosis), second-degree or third-degree atrioventricular block, complete bundle branch block, sinus node dysfunction, supraventricular or ventricular tachycardia, Wolff‒Parkinson‒White syndrome, Brugada syndrome, a prolonged QT interval, subclavian steal syndrome, postural tachycardia syndrome, symptomatic orthostatic hypotension, nonsyncopal loss of consciousness, and hypersensitive carotid sinus syndrome. Patients with extracardiac causes of low QRS voltage, such as emphysema, pneumothorax, pleural effusion, chest deformities or obesity (body mass index ⩾30 kg/m2), were excluded. Patients with poor-quality ECGs were also excluded.
The Institutional Audit Committee of Shaanxi Provincial People’s Hospital approved this study protocol (No. 2019-R014). Registered patients were required to provide informed written consent. This study complied with the strengthening the reporting of observational studies in epidemiology (STROBE) statement.
Data collection
Each patient underwent echocardiography. LVEF, left ventricular end-systolic diameter (LVESD), and left ventricular end-diastolic diameter (LVEDD) were measured using standard diagnostic echocardiographic examinations. The height and weight of each patient were measured, while the patient was wearing light clothing and barefoot. An individual with diabetes mellitus was defined as having used antidiabetic medications or having blood glucose levels greater than 126 mg/dl during fasting. Those with hypertension were defined as having a systolic blood pressure greater than 140 mmHg and/or a diastolic blood pressure greater than 90 mmHg or being on antihypertensive medication. Coronary artery disease referred to diameter stenosis ⩾50% in one or more major coronary arteries diagnosed by coronary computed tomographic angiography or coronary angiography. Stroke was defined as an acute cerebrovascular event resulting in focal or systemic neurological dysfunction and lasting more than 24 h, as confirmed by clinical and radiological examinations. The patients’ medication intake (such as angiotensin-receptor blockers, β blockers, angiotensin-converting enzyme inhibitors, calcium channel blockers, or diuretics) was also recorded.
Tilt-table testing
All TTTs were performed at our hospital. Patients were required to fast for at least 8 h before TTT. The patients underwent TTT by lying supine on the tilt table. The patients were positioned with an upright tilt at a 60-degree angle for 30 min or until symptomatic hypotension occurred. A positive TTT response was characterized by the occurrence of abrupt loss of consciousness or presyncope with a sudden drop in systolic blood pressure to 80 mmHg and recurrence of clinical symptoms. 10 If the patients did not show a positive reaction within 30 min of TTT, they were placed in the supine position and received an infusion of isoproterenol at 1 mg/min, which was increased within 5 min to increase the supine resting heart rate by 20% (the maximum infusion rate was 5 mg/5 min). Once the titration was complete, the patient underwent another 15-min tilt upright. If the TTT result was positive, the patient was placed in the supine position, and the protocol was terminated. Type 1 (mixed), type 2A (cardioinhibitory without >3 s of asystole), type 2B (cardioinhibitory with >3 s of asystole), and type 3 (vasodepressive) are reports of a positive response to TTT. 12
ECG analysis
Each subject underwent a standard 12-lead ECG (25 mm/s and 1 mV/10 mm) at rest performed by a trained technician. Two experienced electrocardiologists independently performed the ECG measurements and interpretations. The electrocardiologists had over 10 years of work experience, and they were unaware of the TTT results. Digital calipers were used to measure the ECG parameters at 200% magnification. Inconsistent ECG measurements and interpretation results were reconciled through consensus. IVLV referred to a voltage of ⩽0.3 mV for the QRS complex in an isolated frontal lead or ⩽0.7 mV for the QRS complex in an isolated precordial lead.6,8
Statistical analysis
Continuous variables are expressed as the median (interquartile range) for nonnormally distributed data or as the mean ± standard deviation for normally distributed data. The Kolmogorov–Smirnov test was performed to analyze the normality of the distribution of continuous variables. Categorical variables are presented as frequencies and percentages. Differences between groups were compared using the chi-square test, Mann–Whitney test, or Student’s t test, as appropriate. The accuracy, sensitivity, specificity, positive predictive value, and negative predictive value were used to assess the diagnostic performance of IVLV for a positive TTT result. The predictive performance of IVLV for a positive TTT result was assessed using receiver operating characteristic (ROC) curves. To determine the metric of overall diagnostic performance, the area under the ROC curve (AUC) was calculated. 13 The ideal cutoff value of the ROC curve for improving the diagnostic yield of IVLV was determined according to the maximum Youden index. Statistical analysis was performed with MedCalc 20.0 (Ostend, Belgium). A difference of p < 0.05 was considered significant.
Results
A total of 399 patients with suspected NMS who underwent TTTs were enrolled. There were 157 patients in the TTT positive group (TTT+ group; mean age 54.27 ± 15.83 years) and 242 patients in the TTT negative group (TTT− group; mean age 55.86 ± 14.80 years). There were more males in the TTT− group than in the TTT+ group (57.85% versus 36.94%, p < 0.001). Significant differences in LVESD, LVESD indexed to height, and LVEDD indexed to height were noted (p < 0.05). No significant differences in age, body mass index, LVEDD, or LVEF were noted between the TTT+ group and TTT− group (p > 0.05).
More patients in the TTT+ group than in the TTT− group had a history of presyncope (92.36% versus 8.18%, p < 0.001). Very low QRS voltage in the frontal leads was significantly lower in the TTT+ group than in the TTT− group (0.27 ± 0.11 versus 0.45 ± 0.20, p < 0.001). Compared with the TTT− group, the TTT+ group had more patients with IVLV in the frontal leads (84.08% versus 25.62%, p < 0.001). However, there were no significant differences in the very low QRS voltage in the precordial leads between the TTT+ group and TTT− group (p > 0.05). For patients with IVLV in the precordial leads, there was no significant difference between the TTT+ group and TTT− group (28.02% versus 33.06%, p = 0.289). The TTT+ group included 21.02% with a type 1 response, 7.01% with a type 2 response and 71.97% with a type 3 response. No significant differences in medical history (diabetes mellitus, hypertension, coronary artery disease, or stroke) or medications (angiotensin-converting enzyme inhibitors, angiotensin-receptor blockers, β-blockers, calcium channel blockers, or diuretics) were noted between the TTT+ group and TTT− group (p > 0.05) (Table 1).
Clinical characteristics of the patients.

IVLV: isolated very low QRS voltage; LVEDD: left ventricular end-diastolic diameter; LVEF: left ventricular ejection fraction; LVESD: left ventricular end-systolic diameter; TTT: tilt-table testing.
Multivariate regression analyses of predictors of a positive TTT response were performed. The results revealed that a history of presyncope and very low QRS voltage in the frontal leads were independently associated with a positive TTT result (Table 2).
Multivariate logistic regression analysis on predictors of a positive TTT response.

LVEDD: left ventricular end-diastolic diameter; LVESD: left ventricular end-systolic diameter.
IVLV in the frontal leads demonstrated 84.08% (95% CI: 77.40%–89.42%) sensitivity and 74.38% (95% CI: 68.39%–79.76%) specificity for a positive TTT response. IVLV in the precordial leads demonstrated 28.03% (95% CI: 21.16%–35.74%) sensitivity and 66.94% (95% CI: 60.63%–72.84%) specificity for a positive TTT response.
ROC curve analysis was also performed. A significant difference in the AUC of IVLV in the frontal leads for a positive TTT result was observed with a value of 0.806 (95% CI: 0.764–0.844, p <0.0001). The optimal cutoff value for IVLV in the frontal leads for a positive TTT response was ⩽0.29. The ideal cutoff value of the ROC curve for improving the diagnostic yield of IVLV was determined according to the maximum Youden index.
However, no significant difference in the AUC of IVLV in the precordial leads for positive TTT response was noted, and the AUC was 0.527 (95% CI: 0.477–0.577, p = 0.360). A significant difference in the AUCs was noted between IVLV in the frontal leads criterion and the precordial leads criterion (p < 0.001) (Figure 2 and Table 3).
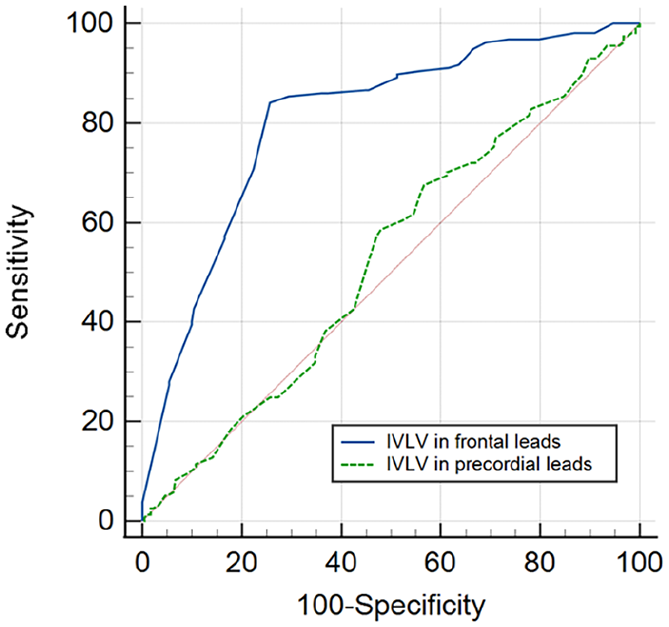
ROC curve of IVLV for a positive TTT response in patients with suspected NMS.
AUC values of IVLV for a positive TTT response in patients with suspected NMS.

AUC: area under the ROC curve; CI: confidence interval; ECG: electrocardiogram; IVLV: isolated very low QRS voltage; NMS: neurally mediated syncope.
The AUCs of IVLV in the frontal leads for a positive TTT result in men and women were 0.816 (95% CI: 0.755–0.867, p < 0.001) and 0.799 (95% CI: 0.737–0.852, p < 0.001), respectively (Figure 3 and Table 4).

ROC curve of IVLV in the frontal leads for a positive TTT response in men (a) and women (b) with suspected NMS.
AUC values of IVLV in the frontal leads for a positive TTT response in men and women with suspected NMS.

AUC: area under the ROC curve; CI: confidence interval; ECG: electrocardiogram; IVLV: isolated very low QRS voltage.
Discussion
Syncope is a common disease in emergency departments. 14 Assessment of syncope involves clinical history, physical examination, and ECG. 4 Although clinical manifestations are the most valuable means of determining the cause of syncope, it is possible to gather valuable information from an ECG as well. In the past, ECG was mainly used to assess cardiac structural abnormalities (such as myocardial infarction), conduction system diseases or hereditary arrhythmia syndrome (such as hypertrophic cardiomyopathy, long-QT syndrome, arrhythmogenic right ventricular cardiomyopathy, or Brugada syndrome) for patients with unexplained syncope. 5 It is necessary to distinguish between NMS and transient loss of consciousness caused by other causes to provide patients with accurate diagnosis and appropriate treatment. The primary mechanism of NMS is abnormal autonomic reactions triggered by various triggering factors, such as coughing, strong emotions, prolonged standing, urination, or defecation. 15 Trigger activation of peripheral or central receptors and vagal central regions plays a key role in the reflex mechanism of NMS.16,17 Hypovolemia, thermal stress, or hypoxemia are more likely or are severe responses to these triggering factors. 11 The baseline ECG of NMS provides less information than that for arrhythmic syncope. However, discussions about the value of ECG in NMS are rare.
In most cases, NMS patients are asymptomatic during clinical examination, and the likelihood of capturing spontaneous events is low. The recording of syncope mostly relies on TTT and long-term ECG monitoring. Blendea et al. 8 found that many NMS patients had an IVLV in one of the frontal leads (⩽0.3 mV). Blendea et al. 9 found that IVLV in the frontal leads could predict a positive TTT response in suspected NMS patients with a sensitivity of 78% and specificity of 68%. Recently, a research study showed that IVLV in frontal leads can predict the recurrence of NMS and did not depend on clinical factors. 10
The diagnostic value of ECG for TTT in a Chinese patient with NMS has not been explored to a large extent. The predictive value of IVLV for TTT in the Chinese patient with NMS has not been explored. The results of this study showed that in Chinese patients with suspected NMS, IVLV in frontal leads was more predictive of a positive TTT response with 84.08% sensitivity and a 74.38% specificity, and these values were higher than those noted in the previous study. 9 The applicability of IVLV in frontal leads is heterogeneous, which may be due to different ECG characteristics in different races. 18 However, there was no predictive value for IVLV in precordial leads. Unlike previous studies, we also compared the diagnostic performance of IVLV in the frontal leads for men and women for the first time. The AUC of IVLV in the frontal leads for men was higher (0.816) than that for women (0.799).
The mechanism of IVLV is unclear. The classical standard for low voltage of ECG (QRS voltage of all frontal leads <0.5 mV and QRS voltage of all precordial leads <1 mV) is usually caused by the influence of voltage generation or voltage transmission from the heart to the surface electrode. 19 IVLVs are not consistent with classical low-voltage criteria because IVLVs do not appear in all frontal leads or all precordial leads. The decrease in QRS voltage may reflect the decrease in intracardiac and intravascular volume. 19 According to Brody’s theory, intracardiac blood volume affects QRS voltage through differences in impedance between blood and extracardiac tissue. The resistivity of blood in heart is less than that of the tissues around the heart. Therefore, the increase in the blood volume in the cavity can increase the transmission of cardiac force to the body surface through the reduction of the resistivity, which subsequently may cause increased QRS voltage. 20 In contrast, the decrease in the voltage of the QRS wave is related to the decrease of intracardiac blood volume. The QRS with the lowest voltage correlated significantly with LVEDD. The presence of IVLV was at least partially due to the specific left ventricular geometry of NMS. 6 The pathogenesis of NMS is believed to be related to a decrease in the intravascular volume and small cardiac dimensions.20,21 When IVLV occurs, the frontal leads are nearly perpendicular to the QRS axis. The generation of low voltage may occur when the cancellations of electrical forces in the ventricles are perpendicular to the QRS axis. In NMS patients, due to insufficient ventricular filling, the opposing left ventricular walls may be in closer proximity, which may exacerbate the cancellation phenomenon along the short axis of the ventricle. We found the TTT+ group had smaller LVESD and LVESD indexed to height than the TTT− group. Although there was no significant difference in LVEDD, the TTT+ group had smaller LVEDD indexed to height than the TTT− group. Therefore, the increase in cancellation and the resulting decrease in voltage along the short axis may result in IVLV in NMS patients. 10
Importantly, this study has certain limitations. First, the sample size was relatively small, and the study was conducted at a single center. Therefore, a considerable number of large-scale studies are needed. Second, this study was a retrospective study, and no relevant studies have been performed in the Chinese population. Therefore, sample size calculation and justification were not conducted. Third, this study only included suspected NMS patients, and the results are not applicable to a general population of patients with syncope. This means that patients already diagnosed with a different etiology for syncope were not included. Finally, there is no gold standard for the diagnosis of NMS. According to the standards of the European Society of Cardiology, 11 the diagnosis of NMS mainly relies on clinical features. We were unable to exclude patients with potential causes of non-NMS. However, in patients with clinical manifestations consistent with the characteristics of NMS, the possibility of other causes is very low.
Conclusions
In patients with suspected NMS, IVLV in frontal leads is more predictive of a positive TTT result. The presence of IVLV in frontal leads can serve as a parameter for evaluating syncope patients. Our results emphasize that the TTT might be of value to identify at-risk patients for NMS. However, it is necessary to validate the results of this study in large-scale studies.
Footnotes
Acknowledgements
The authors would like to thank the registered patients for providing consent for this study.
Author contributions
HC, YC, LL, YG, JF, and LZ contributed to the data collection, statistical analysis, and manuscript drafting. YL, LS, FC, HW, and GC participated in the data collection and manuscript revision. HC, YC, LL, and HW were responsible for the study design, manuscript revision, and consultation. All authors contributed to editorial changes in the manuscript. All the authors have read and approved the final manuscript.
Declaration of conflicting interests
The author(s) declared no potential conflicts of interest with respect to the research, authorship, and/or publication of this article.
Funding
The author(s) disclosed receipt of the following financial support for the research, authorship, and/or publication of this article: This research received support from the Technology Development Incubation Fund of Shaanxi Provincial People’s Hospital (No. 2022YJY-35; No. 2023YJY-57) and the Technology Talent Support Program of Shaanxi Provincial People’s Hospital (No. 2021JY-24).
Ethics approval
This study was approved by the Ethics Committee of Shaanxi Provincial People’s Hospital (No. 2019-R014).
Informed consent
The patients included in this study provided written informed consent.
Trial registration
None.