
Abstract
Objectives:
Early childhood nutrition is critical for physical and mental development, and any hindrance (malnutrition) at this stage adversely affects adulthood which makes them more susceptible to a variety of communicable and non-communicable diseases. St. Martin’s Island was the focus of this study, which examined the prevalence and risk factors for malnutrition among under-five children.
Methods:
In this cross-sectional study, 256 children aged under five were assessed for anthropometry, and multiple logistic regression models were fitted to identify potential predictors of malnutrition. For analysis, SPSS and WHO Anthro software were used.
Results:
The prevalence of stunting, wasting, underweight, and overweight were 34.4%, 17.6%, 18.9%, and 6.9% respectively among children under-five years of age in St. Martin’s Island. An increase in child’s age decreases their risk of being stunted (AOR = 0.97, p = 0.006). Males were more likely than females to be wasted (AOR = 2.03, p = 0.001). Both stunting (AOR = 2.42, p = 0.004) and wasting (AOR = 2.82, p = 0.015) rate were higher among the poorer section as compared to the richest. On the contrary, underweight was low among the poorest section (AOR = 0.37, p = 0.024). Other socio-economic factors, for example, household food insecurity, and parental occupation affect these forms of malnutrition significantly.
Conclusion:
Prevalence of all forms of malnutrition except underweight was higher as compared to the national perspective in St. Martin’s Island among the under-five children. Community-based approaches by the local government in collaboration with various non-government organizations should be taken to reduce and prevent malnutrition among children.
Introduction
Malnutrition in childhood is an important public health concern worldwide; therefore, adequate nutrition for children is recognized as one of the essential pillars of public health. Malnutrition not only encompasses undernutrition (e.g., stunting, wasting, underweight, micronutrient deficiencies) but also refers to overweight, obesity, and the consequential non-communicable diseases that result from an unhealthy diet.1,2 Individuals who consume insufficient calories and protein for growth and development or who are unable to metabolize nutrients are considered at risk of being undernourished. On the other hand, excessive calorie intake may lead to overweight or obesity. 3 The indicators of undernutrition include stunting (low height-for-age), wasting (low weight-for-height), and underweight (low weight-for-age), whereas overnutrition (overweight, obesity) is measured by abnormal or excessive fat accumulation for height. 4
Malnutrition in earlier life adversely affects the physical and mental development of children and is one of the important risk factors for many communicable and non-communicable diseases in later life. 5 Thus, it plays a vital role in determining health and disease conditions throughout life. 6 Moreover, this invisible problem greatly impedes national progress as well as affects the national economy in the long term. 7 Malnutrition accounts for 35% of morbidities among under-five children 8 and the mortality rate is subsequently high among malnourished children. 9 Globally, around 45% of deaths among children younger than 5 years are attributable to undernutrition. 4
Child undernutrition is a problem of great concern worldwide, especially in low- and middle-income countries. In 2020, the global prevalence of stunting, wasting, and overweight among children under-five years was 21.3% (144 million), 6.9% (47 million), and 5.6% (38 million), respectively. 3 In low- and middle-income countries, malnutrition remains a significant child health issue, especially in countries from South Asia and Africa. Asia and Africa together bear the greatest share of all forms of child undernutrition. More than half (54%) of all stunted children and more than two-thirds (69%) of all wasted children younger than five years live in Asia. Whereas, two-fifth (40%) of all stunted children and more than one-quarter (27%) of all wasted children live in Africa. 3
Despite outstanding accomplishments in consistently reducing the rates of child malnutrition during the last few decades, still, child malnutrition is one of the major public health concerns for Bangladesh. Throughout the 1990s, malnutrition rates declined in the country but remained high at the turn of the century. The high prevalence of malnutrition is, even now, one of the leading sources of morbidity and mortality among children under-five years in Bangladesh. 10 Among under-five children, the level of stunting has declined from 43% in 2007 to 31% in 2017. 11 The latest nationally representative Multiple Indicator Cluster Survey (MICS) estimated 28% of under-five children as stunted, 22.6% and 9.8% of children as underweight and wasted respectively. 12
The factors contributing to childhood undernutrition are multifarious. 13 According to the UNICEF conceptual framework of malnutrition, the causes of child malnutrition can be classified as immediate (individual level), underlying (household or family level), and basic (community level). Inadequate dietary intake and poor health status are considered immediate determinants. 14 Childhood undernutrition elicits parallel links with demographic, environmental, and socio-economic aspects as well as parental characteristics, household characteristics, and geographic location. Maternal undernutrition, lack of access and availability of quality food, improper feeding and care practices such as sub-optimal breastfeeding, micronutrient deficiencies, and recurrent infections are the leading causes of undernutrition among children under-five years.15,16 Hossain, et al. 17 explored MICS 2019 Data and found that higher educated mothers, female children, wealthier families, children whose mothers had received prenatal care, and bigger size of the child during birth are associated with a lower risk of stunting, wasting and underweight. Chowdhury et al. 16 showed that children’s age and sex, mother’s BMI, father’s and mother’s education status, place of residence, socio-economic status, community status, religion, region of residence, and food security status are important contributing factors of child undernutrition. A growing body of literature provides evidence that child’s age and sex, size of child at birth, place of delivery, prenatal care, birth interval, household wealth index, maternal empowerment, parental education, mother’s body mass index, maternal height, father’s occupation, place of residence (urban or rural), religion, and family size have emerged as significant predictors of child undernutrition.10,18–25
St. Martin’s island, the only coral-bearing tropical island in Bangladesh is one of the most popular destinations for tourists for its beautiful landscape, clear seawater, and colonies of coral. 26 Although this small continental island of the Bay of Bengal is famous for its natural beauty, and ecological and biodiversity value, there are about 7000 inhabitants who live primarily in the fishing and tourism business. 27 Despite the enormous human settlement, very little is known about their health and nutrition since this community hasn’t been brought under any health or nutrition study so far. Thus, the current study is the first-ever nutrition study on St. Martin’s Island that aimed to investigate the rates of under-five malnutrition in its multiple forms and examine the relationship of child malnutrition with demographic and socioeconomic factors to identify the vulnerability of children being stunted, wasted and underweight.
Methods
Study design, setting, and population
In St. Martin’s Island, a house-to-house cross-sectional survey was conducted from late February to early March 2020. The survey covered the entire island, which consists of nine villages: Purba para, Deil para, Majher para, Konar para, Uttar para, Dakshin para, Zinzira, Paschim para, and Nazrul para (Figure 1). Child malnutrition was the primary indicator of the survey and household was the primary sampling unit. The inclusion criteria for the study was that the household included at least one child under the age of five. Respondents of selected eligible households who were absent at least two visits were excluded.

Study area.
The study was based on a stratified sample of households; each village was considered a stratum and with proportional allocation, the total sample was distributed into nine strata (nine strata because there are nine villages). A complete list of the households was unavailable which restrained us from using simple random sampling. Instead, a modified Expanded Program of Immunization (EPI) sampling approach was applied to select the surveyed households. According to this method, first, a location near the center of the island was selected, then by spinning a pen in the field a random direction was chosen. Next, along the chosen direction a random household was selected and in subsequent steps, the closest household to the previously determined household was checked for compliance with the inclusion criteria. These processes were repeated throughout the survey. 28
Justification of sample size for under-five children
At first, the required sample size was calculated as 305 using Cochran’s formula (Equation 1) considering the point prevalence of stunting in Bangladesh among children under-five years of age as 28%. 12 Stunting prevalence in Bangladesh was taken into account while determining the sample size, as it was greater than other estimates of child malnutrition in the country.
In Cochran’s formula (Equation 1), critical value at 95% confidence interval (CI), Z1-α/2 = 1.96; prevalence of stunting, p = 28%, and degree of precision, d = 5%. Since the population size was known from the population and housing census report, the final sample size was estimated as 254 using corrected Cochran’s formula (Equation 2) after adjusting the known population effect. As 256 children were included in this study, the number of children under 5 years of age was enough to be representative of St. Martin’s Island.


Data collection
Mothers or primary caregivers of under-five children were selected as respondents. Printed version of a structured questionnaire pretested on 10% of the sample was used to gather relevant data from study participants. Children’s height/length, weight, and Mid Upper Arm Circumference (MUAC) were measured by height scale, weight scale, and MUAC tape. Weight was recorded to the nearest 0.5 kg via a portable weight scale. Two types of instruments were used in measuring length/height: a portable infant length measuring scale to measure the recumbent length (for infants and children less than 2 years of age) to the nearest centimeter and a portable anthropometer for measuring the height to the nearest centimeter in older children.
Anthropometric data processing
Height-for-age z score (HAZ), weight-for-age z score (WAZ), and weight-for-height z score (WHZ) were calculated using WHO Anthro software (version 3.3.2) to examine the nutritional status of under-five children. World Health Organization (WHO) growth standard 29 was considered to classify children as stunted (HAZ < −2SD), underweight (WAZ < -2SD), and wasted (WHZ < −2SD). Moreover, following WHO recommendations, any subject with HAZ either above +6 or below −6, WAZ above +5 or below −6, and WHZ above +5 or below −5 were considered an incorrect z-score value (flag data); thus, excluded from the analysis. 30 A total of 14, 11, and 24 children were excluded from HAZ, WAZ, and WHZ computation, respectively because their z-scores fell beyond the acceptable range.
Covariates
A set of demographic and socio-economic factors such as the age of the child, gender of the child, household wealth index, family size, number of children, place of residence, education level of parents, household total monthly income, household food security, and principal occupation of householders, child dietary diversity, and Food Consumption Score (FCS) were considered exposure variables in the regression models. Child dietary diversity was assessed following WHO guidelines 31 which measures the number of different food groups consumed over a given reference period (24 h recall). The food groups used to measure dietary diversity is listed in Supplemental Table 1. The household wealth index was calculated following World Food Program (WFP)’s Comprehensive Food Security and Vulnerability Analysis Guidelines. 32 Principal Component Analysis (PCA) was performed to calculate wealth index from a set of socio-economic variables. Supplemental Table 2 lists the variables used to calculate the wealth index. Another background variable, household food security status, was measured using the Food Insecurity Experience Scale (FIES). 33 The FIES comprised eight questions ranging from low food insecurity (question 1) to severe food insecurity (question 8). The FIES questions are listed in Supplemental Table 3. After that, “Yes” responses were coded as 1, and “No” responses were coded as 0. The total raw score ranges from 0 to 8 and a food secure household was defined as a FIES score of zero, whereas, a household FIES score of ⩾1 was defined as food insecure.
Statistical analysis
Descriptive statistics were performed in terms of frequency, percentage, mean and standard deviation. Normal distribution of variables was investigated before analysis through visual inspection of the histogram, Q–Q plot, detrended Q–Q plot, Box plot, and using statistical test–Kolmogorov–Smirnov and Shapiro–Wilk. 34 An independent sample t-test was used to compare the difference in anthropometry between male and female children. Moreover, to investigate the primary association between malnutrition and selected factors, bivariate analyses were performed using cross tables and a chi-square test (for categorical variable). For predictor analysis, logistic regression models were fitted to measure the strength of association. SPSS (version 25) was used to analyze the data.
Regression model building
Three different logistic regression models were considered for three response variables (stunting, wasting, and underweight). Prevalence of overweight was found very low (about 7%). The cell value for categories of each variable didn’t permit performing the Pearson chi-square test and hence in the multiple logistic regression. Therefore, being overweight was not included in the regression analysis. In addition to significant covariates, the final models retained the important confounding factors to build a richer model. Initially, a set of socioeconomic and demographic factors were considered as explanatory variables and univariate analyses were performed for each variable. The final model was then formed following the stepwise method (forward entry) with important variables that had a significant level of <0.25 in the univariate analyses. 35 The p-value cutoff was set at 0.25 because lower levels, such as 0.05, may miss variables that are known to be important in the study. 36
Before final model building, the underlying assumption of the logistic regression model, that is, multicollinearity, and stability of the model was examined. Pearson goodness of fit was performed to test the validity of the regression model whereas the variance inflation factor (VIF) was examined to check the amount of multicollinearity in the model and VIF greater than 2 was considered to indicate multicollinearity. Results were presented as an adjusted odds ratio (AOR) with a 95% CI and significance level.
Ethical approval
The nature and purpose of our study were explained to all study participants and oral consent was taken before the study. Since most of the respondents were illiterate, we could not take written consent from them. Moreover, no minor subjects were involved in this study, and child mothers (respondents) were not minor subjects. The ethical review committee of the Faculty of Biological Sciences, University of Dhaka reviewed and approved our study (Ref. No. 116/Biol. Scs.).
Results
The prevalence of malnutrition and various socio-demographic characteristics of the study subjects are presented in Table 1. The mean age of the under-five children was 37.22 months and more than half (56.6%) of them were above three years. About 54% of the children were boys. The educational level of the parents was very poor and around half of them had no formal education. Almost half (47.4%) of the fathers supported their families by catching fish. Less than half of the children (45.5%) were found to take at least four different types of foods. Around 36% of the households were found with poor toilet facilities. About one-third (34.4%) of the children in St. Martin’s Island were stunted. The prevalence of wasting and underweight were 17.6% and 19% respectively. Less than one-tenth (6.9%) of the children on this island were overweight.
General characteristics and cross-classification types of malnutrition among under-five children in St. Martin’s Island (N = 256).
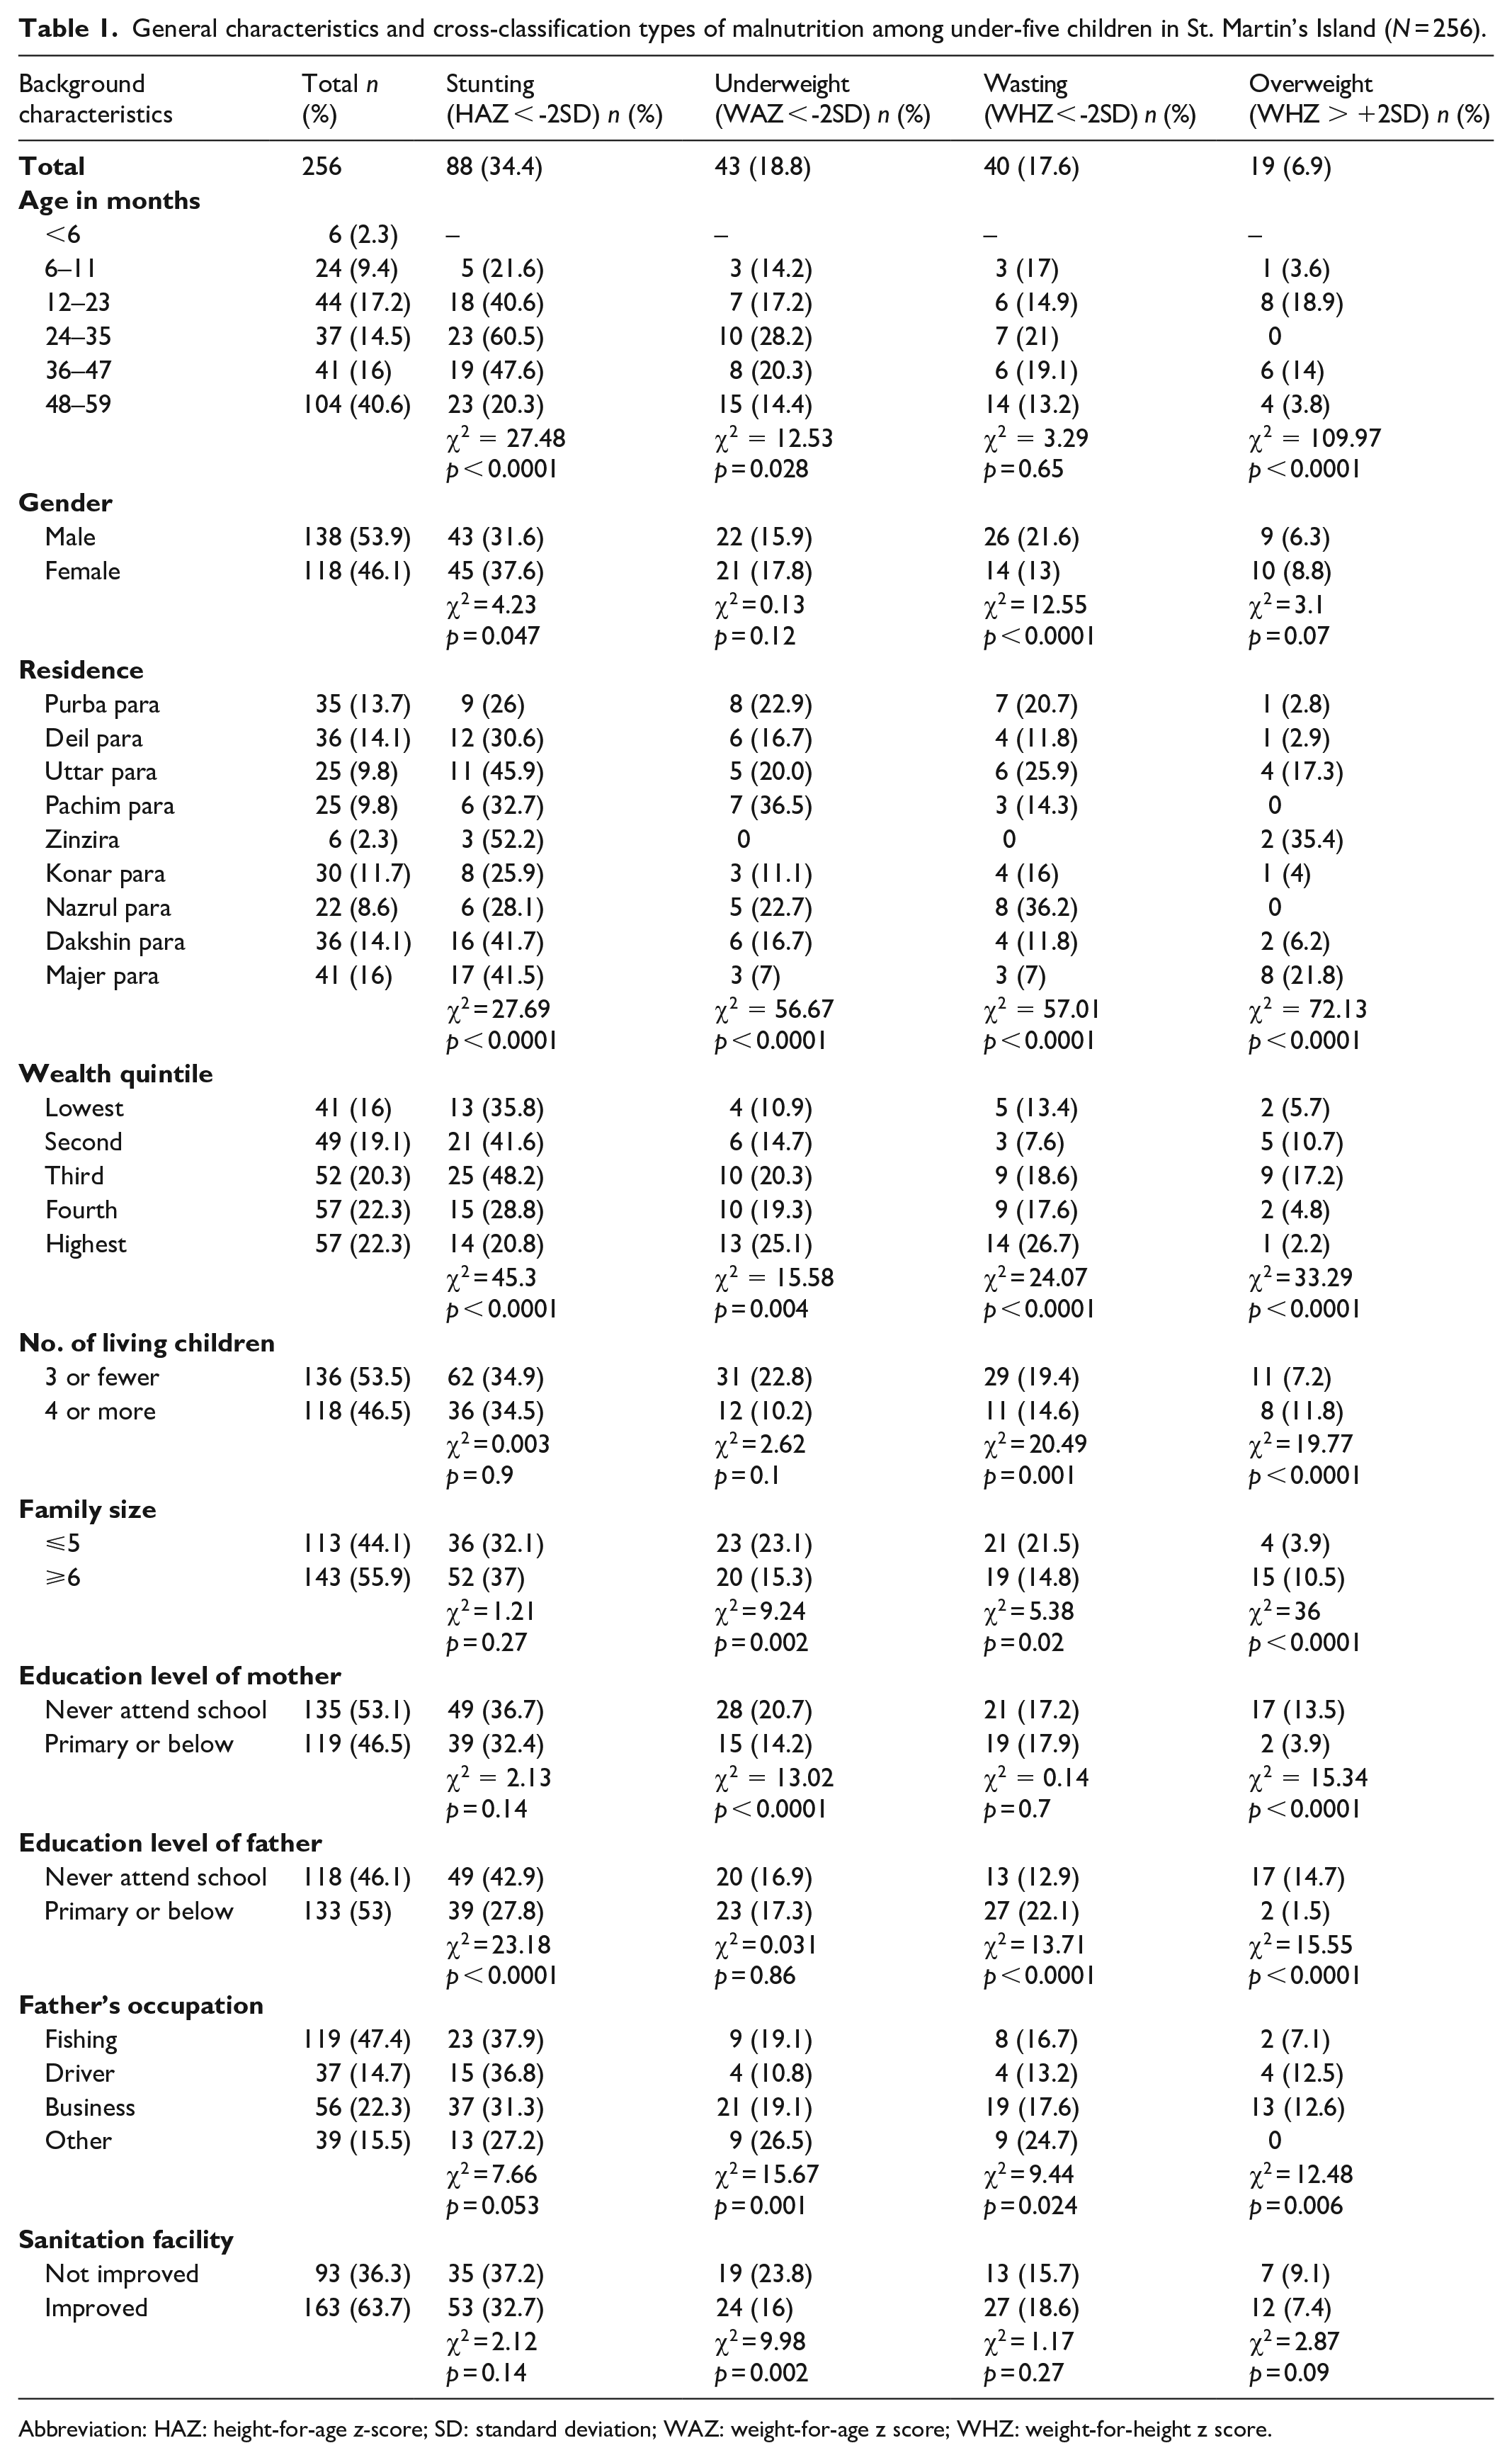
Abbreviation: HAZ: height-for-age z-score; SD: standard deviation; WAZ: weight-for-age z score; WHZ: weight-for-height z score.
Although the mean weight (12.83 kg) of the children was almost the same among male and female children, mean height of the male was significantly higher than the female (92.38 cm vs. 89.07 cm; p < 0.001) (Table 2). Mean HAZ, meanWAZ, and meanWHZ z-scores were −1.34, −0.97, and −0.36 respectively. Though mean HAZ was less in female children compared to males (−1.37 vs. −1.11; p = 0.01), mean WHZ was significantly higher in females (−0.20 vs. −0.56; p = 0.003).
Mean height, weight, age, and different nutritional status indicator of under-five children of St. Martin’s Island (N = 256).

p-value from independent sample t-test.
The multiple logistic regression model shows the contribution of each factor to stunting, wasting, and underweight along with the corresponding odds ratio (OR) and p-value (Table 3). Children who lived in Zinzira and Majher para were 4.8 and 1.84 times more likely to be stunted respectively compared to children from Nazrul para. In comparison to the richest households, the odds of being stunted were 2.42 times higher among children from middle wealth quintile households (adjusted Odds Ratio, AOR = 2.42, p = 0.004). The children with illiterate fathers were 2.31 times more likely to be stunted as compared to children whose fathers completed up to the primary level of education (AOR = 2.31, p = 0.03). However, with the increase in the child’s age, the odds of stunting decrease (AOR = 0.97, p = 0.006).
Multiple logistic regression showing factors associated with stunting, wasting, and underweight.
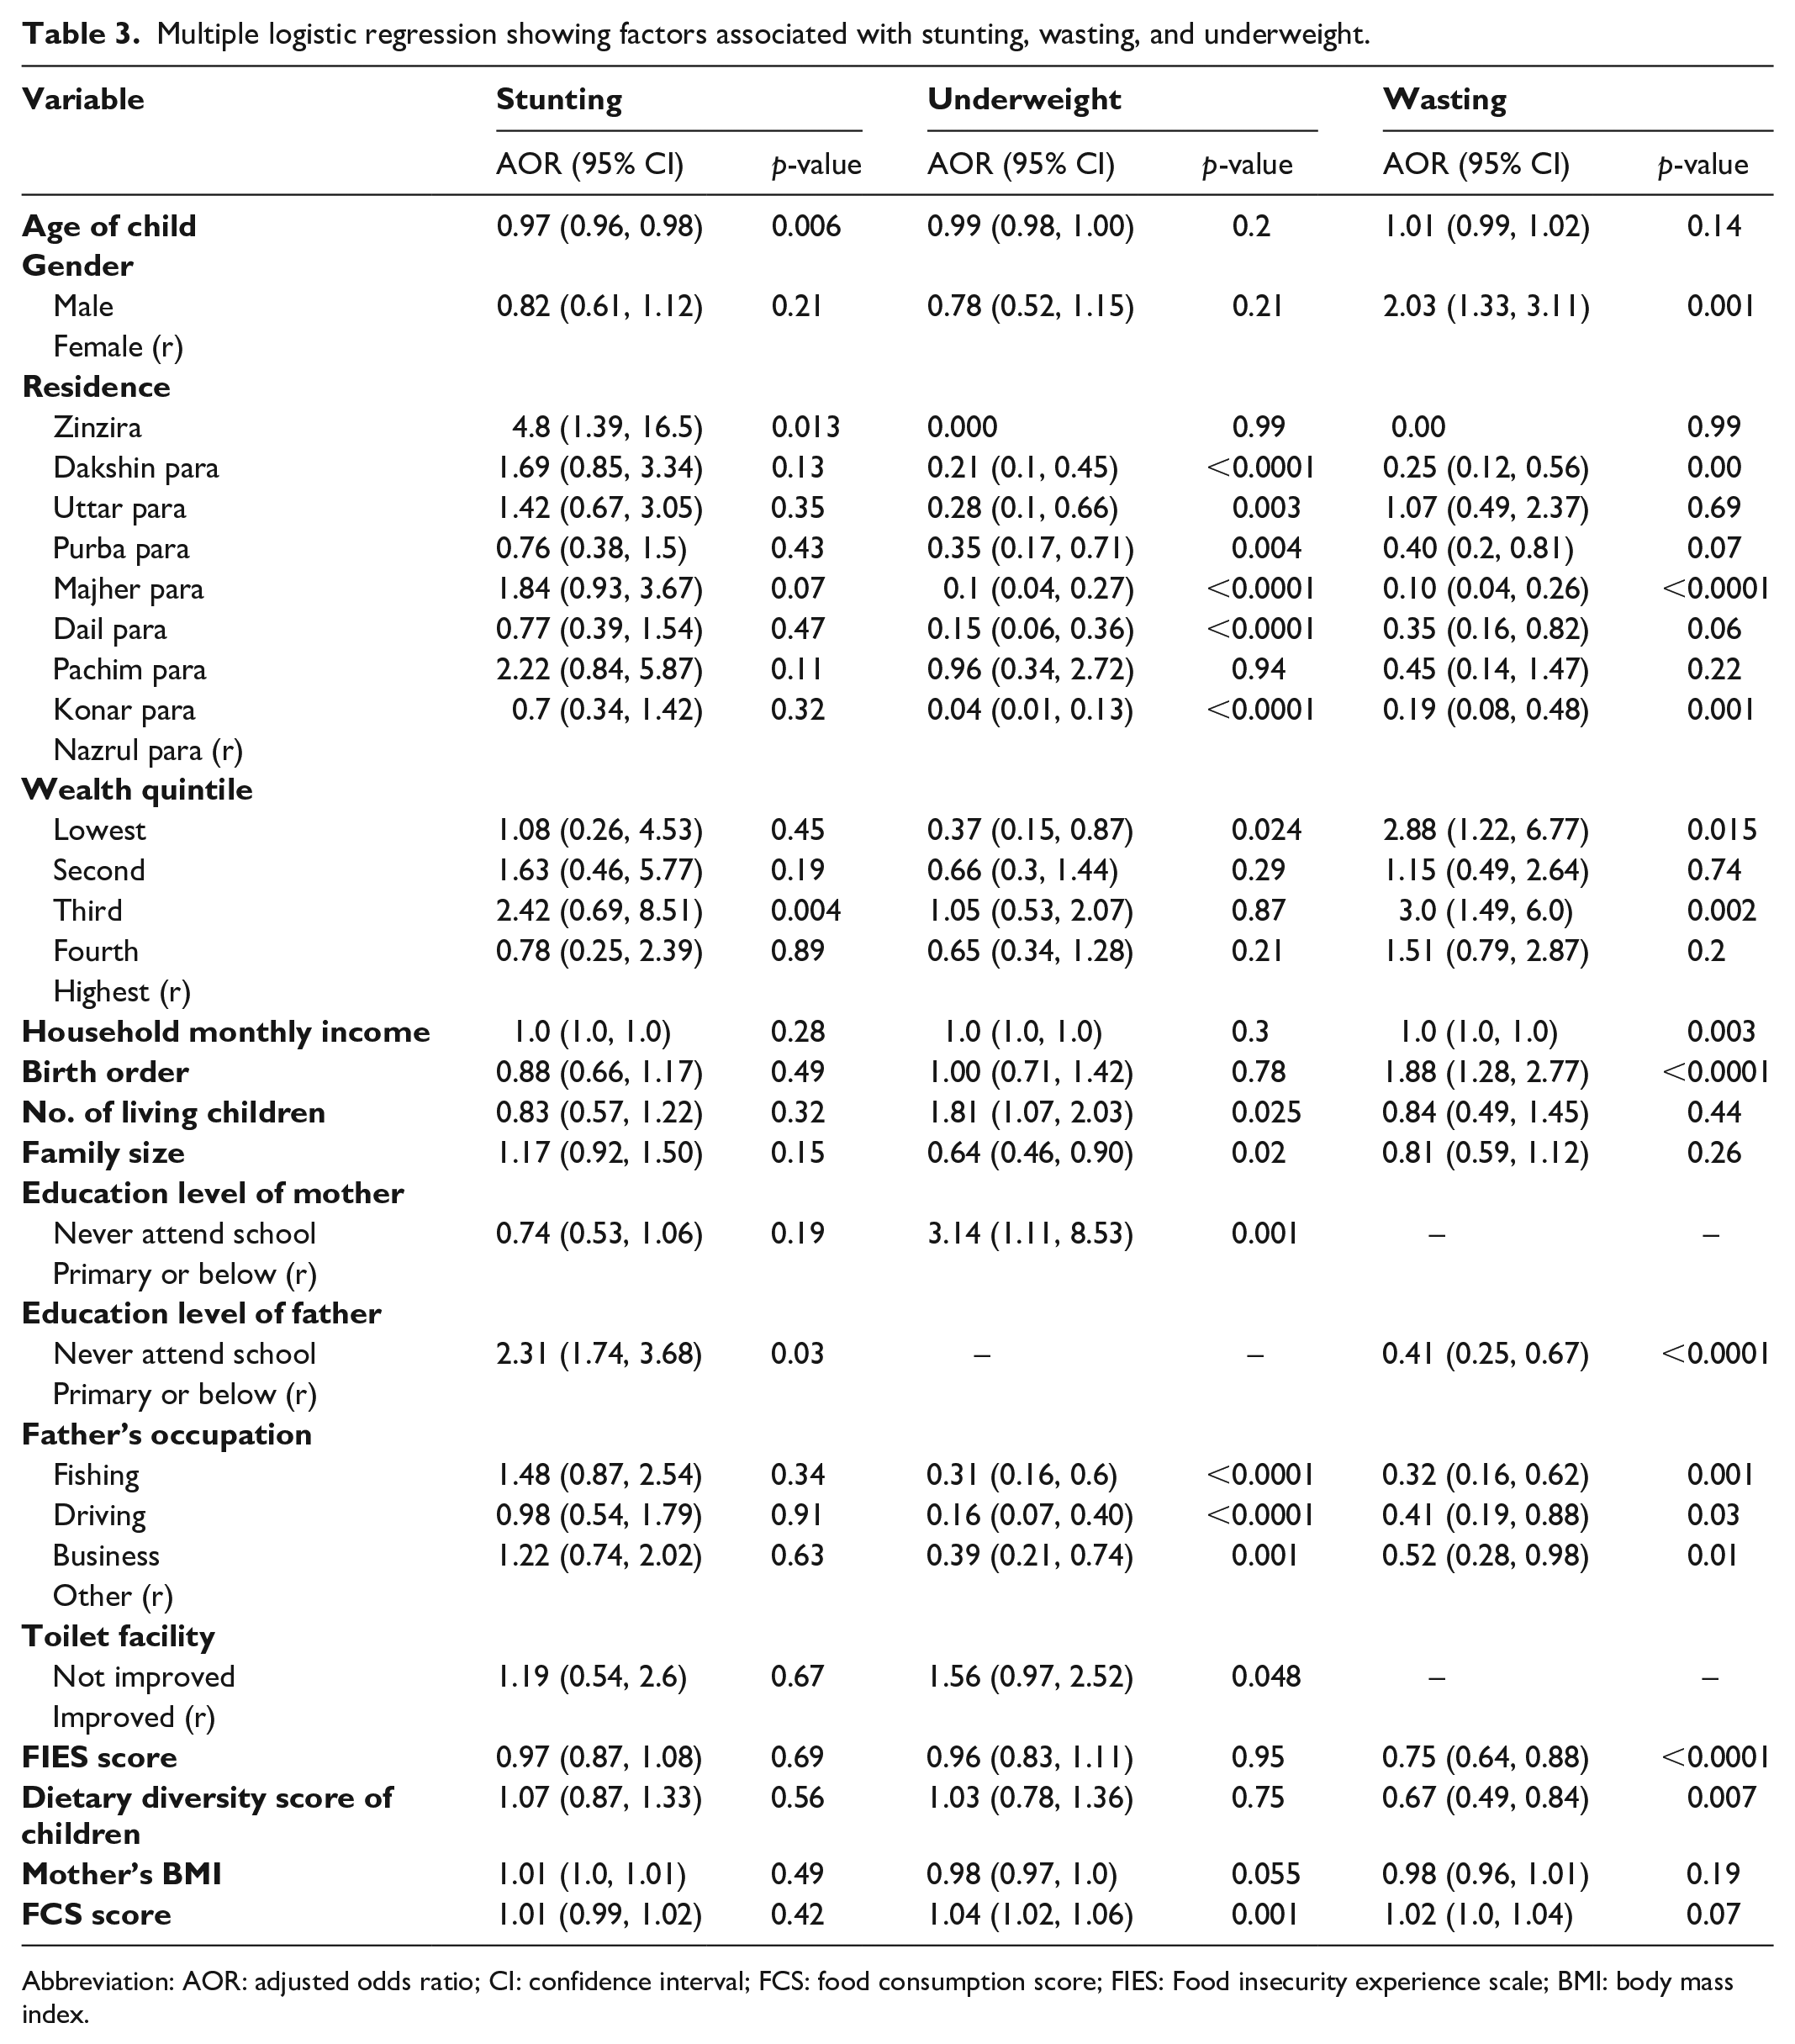
Abbreviation: AOR: adjusted odds ratio; CI: confidence interval; FCS: food consumption score; FIES: Food insecurity experience scale; BMI: body mass index.
Male children had 2.03 times higher odds of being wasted than female children (AOR = 2.03, p = 0.001). The odds of wasting were 75%, 90%, and 81% lower among children residing in Dakshin para, Majher para, and Konar para respectively as compared to children from Nazrul para. Children from households with the poorest and middle wealth index had 2.88- and 3.0-times higher odds of wasting respectively as compared to children from richest households. The odds of wasting were 59% lower in children whose fathers had never attended school as compared to children whose fathers had completed up to the primary level of education (AOR = 0.41, p < 0.0001). Children whose father was involved in fishing, driving, and business were 68%, 59%, and 48% less likely to wasting respectively as compared to children whose father was involved in other occupations. Other key factors of wasting were the FIES score (AOR = 0.75, p < 0.0001), child dietary diversity score (AOR = 0.67, p = 0.007), and birth order (AOR = 1.88, p < 0.0001).
Children from Dakshin para, Majher para, Deil para, and Konar para had 79%, 90%, 85%, and 96% lower odds of being underweight respectively as compared to children who lived in Nazrul para. Unlike stunting and wasting, the children from the poorest households had 63% lower odds of being underweight as compared to children from the richest households (AOR = 0.37, p = 0.024). With the increase in the number of living children, the OR for underweight increases (AOR = 1.81, p = 0.025). The odds of being underweight were 3.14 times higher in children whose mothers had no education as compared to children whose mothers had completed up to the primary level of education (AOR = 3.14, p = 0.001). The OR for underweight increases with the increase in FCS. Other key socio-demographic factors of underweight were unhygienic toilet facility (AOR = 1.56, p = 0.048), principal earning member involved in fishing (AOR = 0.31, p < 0.0001), driving (AOR = 0.16, p < 0.0001) and business (AOR = 0.39, p = 0.001).
Discussion
This cross-sectional study was conducted in St. Martin’s Island, Bangladesh to examine the prevalence and risk factors of malnutrition among under-five children. The findings of this study suggest that there is a lot of scope for improvement of child nutritional status on this island with 34.4% stunted, 17.6% wasted, 18.9% underweight, and around 7% overweight. In this study, age and sex of the child, place of residence, wealth index, birth order, family size, number of living children, father’s occupation, child dietary diversity, and household food security had a significant association with child undernutrition.
The lifestyle of the inhabitants of St. Martin’s Island is distinct from the people of the mainland of Bangladesh. They are mostly illiterate and live in hostile environments struggling with natural calamities. Inhabitants of this island, especially the children are unprivileged with health facilities having only a community clinic there. Again, due to illiteracy and unawareness, various superstitions are entrenched among them which may affect the health of the children adversely. 37 The present study found that the prevalence of all forms of child malnutrition except underweight was comparatively higher in the most south-easterly spot of the country (St. Martin’s island) compared to the latest national estimates.11,12 Prevalence of stunting (34.4%) was found slightly higher on St. Martin’s Island compared to the prevalence in the national perspective (31%). The situation of wasting was more devastating there, as its rate (17.6%) was almost double the rate in the national context (8.0–9.8%). Although the percentage of underweight children was lower (19% vs. 22%) on St. Martin’s Island, the overweight percentage was higher (6.9% vs. 2.2%) in comparison to the percentage found in national surveys.11,12
Up to the age of 24–35 months, malnutrition for stunting and underweight dynamically increased with an increase in age. A similar pattern was examined in previous studies conducted in developing nations including Bangladesh.10,17,38,39 The reason for the increased risk of undernourishment with age could be because of the increased intake of supplemental foods in addition to breast milk. Supplemental foods are more likely to be contaminated, which has been linked to the spread of infectious diseases among children, making them vulnerable to malnutrition. 40 At the age of 24–35 months, malnutrition hits the highest point for stunting, wasting, and underweight and after 35 months, the fraction of stunted, wasted, and underweight children decreased abruptly. These findings are consistent with the latest MICS report. 39 The explanation for this pattern could be that breast milk’s immune-boosting functions are lessened, and children are exposed to contaminated supplementary foods as well as the filthy surrounding. 41 The highest undernourishment rate after 24 months might be due to their fully transition to diets for nutritional requirements rather than breast milk. Children often rely on supplementary foods along with breast milk for the first 24 months of their lives. After 24 months, they have to meet their nutritional requirements solely from diets and any lack between requirement and dietary intake can make them vulnerable to undernutrition. Within next one year, they could be adapted to diets and fulfill their nutritional requirements from diets which enable them to gain catch up growth. Hence, there might be a sharp declination in undernourishment after the age of 35 months. The prevalence of overweight was also relatively higher in younger children (12–23 months) related to other study findings. 17
The sex of the child is one of the most considerable risk factors for malnutrition in several studies.10,16,17 Our finding of the higher prevalence of stunting and underweight among female children was in agreement with the latest Bangladesh Demographic and Health Survey 11 although biologically boys are more vulnerable to morbidity as proven in epidemiological studies. 39 However, being a male child was one of the risk factors for wasting in this study.
We also observed distinct regional variation in terms of malnutrition prevalence. Undernutrition was more prevalent in the distal portion of St. Martin’s Island presumably due to poor community status. Since it was the first study on this island, we couldn’t find any comparable data in the literature. Moreover, similar to other studies held in Bangladesh and other countries,10,16,17,42,43 the wealth index was negatively associated with malnutrition although no trend was identified in the current study. However, the odds of being stunted and wasted were significant in the poorest family, which was coherent with the literature.10,17 In addition, children in the food-insecure household were more likely to be wasted which was in agreement with the findings of a similar study. 44
The present study also indicated that both the parents’ education levels are significant predictors of child undernutrition. Inconsistent with previous findings, children from illiterate fathers or mothers were more prone to be undernourished as compared to their counterparts.10,17,45 This is expected because educated parents can take better care of their children as they are expected to be more careful regarding health, usage of health facilities, hygiene, and sanitation of their children. 46 All parental occupation (fishing, business, and driving) is related to a lower OR of undernutrition as compared to other professions. One probable explanation could be that they can earn more money from these works than from other types of works and household monthly income or higher wealth index is negatively associated with the risk of undernutrition. 10 Aside from fishing, which is their primary source of income, during the tourist season (November to March), the vast majority of them are involved in various kinds of small business and driving (touring boat/rickshaw).
Our study findings suggest improved sanitation facilities as a protective factor against child undernutrition. Children from households with unimproved sanitation facilities were more likely to be underweight than children from households with improved sanitation facilities. This link can be explained by the fact that children from unimproved sanitary environments are more prone to acute diarrhea, and parasitic infections which adversely affect their health. Literature also supports this association where several studies reported poor sanitation facilities as one of the underlying causes of child malnutrition.47–49 Furthermore, the highest number of siblings or birth order led to an increased risk of being underweight, in agreement with Rahman, 2016. 50
Limitations
This study has some unavoidable limitations. First, we could not draw any causal relationship between child undernutrition and risk factors due to the cross-sectional nature of the study. Second, risk factors for overweight were not investigated because of their low prevalence rate. Third, in some cases, we had to depend on self-reported information, that is, age, education, occupation, etc. which may increase the risk of potential information bias. The sample size calculation may not be adequate for subpopulation analysis, and this may limit the study’s power since the power of the study increases with sample size. 51 Furthermore, although EPI sampling approach is recommended for household survey sampling without sampling frame, this sampling approach has occasionally produced non-representative data, which may have led to questionable inferences. 28 Besides, households that agreed to participate may be systematically different than those that did not agree, and there was no way for us to test this, therefore, we couldn’t rule out the certain degree of selection bias. A well-designed qualitative study can be conducted in the island for a better understanding of the risk factors of child undernutrition which was beyond the scope of the present study.
Applicability of evidences
This unprivileged community has not been brought under any health or nutrition-related community survey yet. Children under-five years of being at risk of malnutrition on this island, should serve as a wake-up call for appropriate authorities to take action to improve their nutrition.
Conclusion
Child nutritional status is considered with great importance in community nutrition since it is a proxy indicator for assessing population health status. This empirical study confirms the high prevalence of malnutrition among under-five children on St. Martin’s Island indicating that some effective, sustainable programs are urgently needed targeting this vulnerable group. A joint effort by the government, non-governmental organizations, and community involvement are necessary to overcome the malnutrition problem among children. Better coverage of nutrition-specific (e.g., promotion of breastfeeding, maternal supplementation with balanced energy and protein, multiple micronutrient supplementation) and nutrition-sensitive interventions (e.g., improving socioeconomic status and control over resources, discouraging early marriage, improving access to water and sanitation facilities) may play a vital role in reducing the burden of malnutrition.
Supplemental Material
sj-docx-1-smo-10.1177_20503121221116246 – Supplemental material for Malnutrition among under-five children in St. Martin’s Island, Bangladesh: A cross-sectional study on prevalence and associated factors
Supplemental material, sj-docx-1-smo-10.1177_20503121221116246 for Malnutrition among under-five children in St. Martin’s Island, Bangladesh: A cross-sectional study on prevalence and associated factors by Ahmed Jubayer, Md Hafizul Islam and Md Moniruzzaman Nayan in SAGE Open Medicine
Footnotes
Acknowledgements
We express our gratitude to Md. Nazrul Islam Khan, former professor of the Institute of Nutrition and Food Science, University of Dhaka for his encouragement, support, and cooperation in the study.
Author Contributions
Conceptualization: AJ and MN; Formal analysis: AJ and MHI; Methodology: AJ and MHI; Software: AJ and MN; Visualization: AJ; Draft preparation: AJ and MN; Review and editing the draft: AJ, MHI, and MN. All of these authors reviewed and approved the final version of the paper.
Data availability
The datasets analyzed during the current study are available from the corresponding author on reasonable request.
Declaration of conflicting interests
The authors declared no potential conflicts of interest with respect to the research, authorship, and/or publication of this article.
Ethics approval
Ethical approval for this study was obtained from the ethical review committee of the Faculty of Biological Sciences, University of Dhaka (Ref. No. 116/Biol. Scs.).
Funding
The authors received no financial support for the research, authorship, and/or publication of this article.
Informed consent
The nature and purpose of the study were described to all study participants, and because most of the respondents were illiterate, verbal rather than written consent was obtained prior to study initiation. This sort of informed consent was authorized by the Institutional Review Board.
Trial registration
Not applicable.
Supplemental material
Supplemental material for this article is available online.
References
Supplementary Material
Please find the following supplemental material available below.
For Open Access articles published under a Creative Commons License, all supplemental material carries the same license as the article it is associated with.
For non-Open Access articles published, all supplemental material carries a non-exclusive license, and permission requests for re-use of supplemental material or any part of supplemental material shall be sent directly to the copyright owner as specified in the copyright notice associated with the article.