
Abstract
Background:
Bone sarcomas often present late with advanced stage at diagnosis and an according, varying short-term survival. In 2016, Nandra et al. generated a Bayesian belief network model for 1-year survival in patients with bone sarcomas. The purpose of this study is: (1) to externally validate the prior 1-year Bayesian belief network prediction model for survival in patients with bone sarcomas and (2) to develop a gradient boosting machine model using Nandra et al.’s cohort and evaluate whether the gradient boosting machine model outperforms the Bayesian belief network model when externally validated in an independent Danish population cohort.
Material and Methods:
The training cohort comprised 3493 patients newly diagnosed with bone sarcoma from the institutional prospectively maintained database at the Royal Orthopaedic Hospital, Birmingham, UK. The validation cohort comprised 771 patients with newly diagnosed bone sarcoma included from the Danish Sarcoma Registry during January 1, 2000–June 22, 2016. We performed area under receiver operator characteristic curve analysis, Brier score and decision curve analysis to evaluate the predictive performance of the models.
Results:
External validation of the Bayesian belief network 1-year prediction model demonstrated an area under receiver operator characteristic curve of 68% (95% confidence interval, 62%-73%). Area under receiver operator characteristic curve of the gradient boosting machine model demonstrated: 75% (95% confidence interval: 70%-80%), overall model performance by the Brier score was 0.09 (95% confidence interval: 0.077–0.11) and decision curve analysis demonstrated a positive net benefit for threshold probabilities above 0.5. External validation of the developed gradient boosting machine model demonstrated an area under receiver operator characteristic curve of 63% (95% confidence interval: 57%-68%), and the Brier score was 0.14 (95% confidence interval: 0.12–0.16).
Conclusion:
External validation of the 1-year Bayesian belief network survival model yielded a poor outcome based on a Danish population cohort validation. We successfully developed a gradient boosting machine 1-year survival model. The gradient boosting machine did not outperform the Bayesian belief network model based on external validation in a Danish population-based cohort.
Background
Accurate survival prediction for patients with newly diagnosed bone sarcoma would greatly aid clinicians in deciding the most appropriate treatment. Bone sarcomas often present late with an advanced stage at diagnosis; accordingly, short-term survival is varying. 1 In some settings, the decision to perform surgery or, more commonly, deciding which surgical treatment to choose, relies partly on the prediction of estimated survival. Patients with expected short-term survival may sometimes be better served with only a minor operative procedure to relieve pain and maintain quality residual life or perhaps no surgery, rather than undergoing major surgery with amputation or bone resection and insertion of a tumor prosthesis with the associated higher risk of complications and prolonged rehabilitation. Prognostic factors for survival in bone sarcomas have been suggested 2 and management guidelines exist.3,4 However, deciding treatment management is a case-by-case matter due to the broad heterogeneity among bone sarcoma patients. To the best of our knowledge, there have been few attempts to create evidence-based prediction models for survival in bone sarcoma patients using machine-learning techniques.5,6 Bongers et al. 5 developed and compared Bayes point machine and neural network models for 5-year survival in patients with chondrosarcoma. The multilayer perceptron neural networks used comprised a network of models mapping input features into desired outputs adjusted by backpropagation to compensate for errors found when training the model. The Bayes point machine is a kernel-based algorithm seeking to approximate the Bayes-optimal decision curve. 7 Due to its slightly better performance, the Bayes point machine model was preferred to be deployed as a web-based clinical tool by Bongers et al. 5
Using commercially available machine-learning software (FasterAnalyticsTM; DecisionQ, Washington, DC, USA), which was originally developed to analyze video cassette sales, Nandra et al. 6 generated a Bayesian belief network (BBN) model for 1-year survival of patients with bone sarcoma and demonstrated five factors with conditional dependencies for survival 1 year after surgery. BBN modeling has been used to develop decision support tools in numerous oncologic diagnoses including skeletal metastases and soft-tissue sarcomas.6,8,9 However, as the present model has not been externally validated, its clinical use remains unknown. Many research communities are moving away from proprietary modeling methods toward open-source software, including R (R Foundation, Vienna, Austria) or Python (Python Software Foundation, Wilmington, DE, USA), which are now widely used in the field of machine learning. Open-source software is advantageous not only because it is available at low or no cost but also because it is inherently transparent. Code may be published as a supplement to peer-reviewed manuscripts. This allows independent validation as well as continuous development and optimization by the research community in the effort to refine and customize functions. 10
Gradient boosting machines (GBMs) form a group of machine-learning techniques used to generate non-parametric regression or classification models. 11 Gradient boosting uses the ensemble technique, which gradually and sequentially converts weak models to stronger ones. With each boost every new model is subsequently correlated to the negative gradient of the customized loss function from the previous model. The boosting technique has previously proven to outperform other machine-learning models in accuracy and generalizability10,12 and hence produces a model with consistently higher accuracy than conventional single, strong machine-learning models. 10
On that background, the purpose of this study was to externally validate Nandra et al.’s 6 1-year BBN prediction model for survival in patients with bone sarcomas and to develop a GBM model using their training cohort and evaluate whether the GBM model outperformed the suggested BBN model when externally validated in an independent Danish population cohort.
Material and methods
This is a retrospective study. Our training cohort was originally described by Nandra et al. 6 Briefly, 3493 patients with newly diagnosed bone sarcomas treated between 1970 and 2012 at the Royal Orthopedics Hospital, Birmingham UK were included from their institutional prospectively maintained database. The same cohort was used as the training cohort for the creation of the GBM model in this study. From the Danish Sarcoma Registry, 13 a cohort of patients (n = 771) newly diagnosed with bone sarcomas during 2000–2016 was obtained and was used for the external validation cohort for the BBN model by Nandra et al. 6 as well as for external validation of the GBM model proposed in this study. Approval for the study was obtained from the Danish Data Protection Agency (no. P-2019-54) and the Danish Patient Safety Authority (no. 3-3013-2866/1).
External validation of the BBN model
The validation cohort comprised 771 patients with newly diagnosed bone sarcoma included from the Danish Sarcoma Registry (DSR) 13 during January 1, 2000–June 22, 2016. The Danish Sarcoma Registry is a national database prospectively maintained since January 1, 2009. Patients from the year 2000 to 2008 were later included in the DSR by validation through the Danish Cancer Registry and the Danish National Pathology Registry. 14 Patients were included from the only two tertiary referral centers for orthopaedic oncology in Denmark. All patients were accounted for a minimum of 1-year follow-up due to the Danish Civil Registration System, 15 where the exact date of death is known for all Danish patients. Survival was defined as the time from the first contact to a tertiary referral center to the date of death or completed 1-year follow-up. Apart from three foreign citizens, no patients were lost to follow-up. Of the 771 patients, 113 (15%) died within the 1-year follow-up (Figure 1).
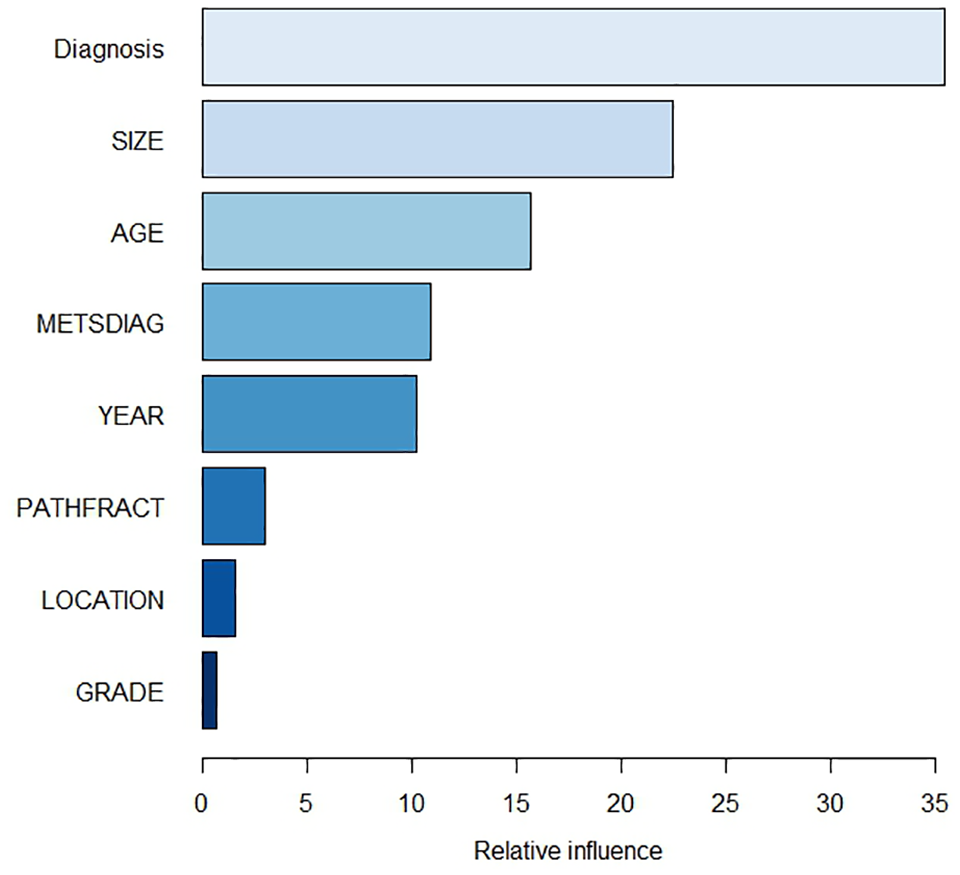
By shuffling copies of all features, the chosen Boruta algorithm trains a Random Forest on the overall data. Features are then rejected or confirmed. Confirmed features are ranked with their relative influence in the GBM model as demonstrated.
Nandra et al.’s 6 BBN model included 11 candidate features for final analysis: age, sex, tumor size at diagnosis, location, grade, alkaline phosphatase, metastasis at diagnosis, pathologic fracture at diagnosis, diagnosis, tumor site, status 1-year after diagnosis, and year of diagnosis. The Danish Sarcoma Registry contains patient characteristics, tumor characteristics, treatment data, and vital status death 13 —most of the required variables for this validation.
Alkaline phosphatase was not available from the Danish Sarcoma Registry and hence was not included for validation. In the validation cohort, tumor grade was defined by the Myhre-Jensen classification until 2004 16 and from 2004 and onward by the Fédération Nationale des Centers de Lutte Contre le Cancer (FNCLCC). 17 Essential for validation is that features used in the training cohort and validation cohort are identical and hence tumor grades were converted as follows: Grade I = 1 = low, Grade II = 2 = intermediate, Grade IIIa and IIIb = 3 = high. No other variables were converted.
Using the Danish validation set, we then determined the ability of accuracy and discrimination by receiver operating characteristic (ROC) analysis and area under the curve (AUC). 18 Validation was considered successful if the AUC under the ROC curve was greater than 0.7 as the lowest acceptable threshold and was determined a priori. In essence, the area under the curve is interpreted as the probability that a person who experienced the outcome (death) had a higher predicted probability than the person who did not experience the outcome; accordingly, discrimination is a measure of how well the model can separate those who do and those who do not experience the outcome. A value of 1 is perfect discrimination, and a value of 0.5 represents chance. Overall predictive model performance was evaluated with the Brier score. 19 The Brier score quantifies the compliance between the predicted probability and observed outcome. The reported value between 0 and 1 is the average squared differences between all the predicted and actual outcomes in the cohort, with 0 indicating perfect agreement and 1 indicating perfect disagreement. However, a score of 0.25 reflects a 50% incidence of outcome, and hence, scores above 0.25 are also to be considered noninformative. 20 The BBN model was used “as-is” by Nandra et al. without prior refitting or optimization and no other imputation of data was used. Validation of the BBN model was performed using commercially available software (FasterAnalyticsTM, DecisionQ Corp., Washington, DC, USA).
Development of GBM model
To mitigate overfitting, a 10-fold cross-validation of the training cohort was initially conducted. Using randomization, data were split into 10 unique test and train sets with balanced events per variable. Each test and train set comprised 20% and 80% of data, respectively. A GBM model was trained on a training set (n = 2794) and subsequently tested on the corresponding test set (n = 699).
For correct comparison, it was decided not to exclude or include variables other than those used by Nandra et al. 6 Due to missing data, alkaline phosphatase was excluded. Tumor sites were subcoded into five location categories as previously described by Nandra et al. 6 (Table 1). Decision trees were chosen as base-learners. As the outcome variable was binary, the Bernoulli loss function 10 was chosen. Missing data were imputed using missForest. 21 For feature selection, we chose the Boruta train algorithm. 22 By shuffling copies of all features, the Boruta algorithm trains a random forest 23 on the overall data; consequently, features are either rejected or confirmed and further ranked with their relative influence in the model. Due to their customizability and efficiency, GBM models are prone to overfitting; 10 selection, and hyper-tuning of parameters is therefore crucial to the outcome. A preliminary baseline model was created with various parameter selections for the hyper-tuning process. The final parameters selected were: shrinkage = 0.01, interaction depth = 3, bag fraction = 0.8, n.minobsinnode = 5. The optimum number of iterations with minimum loss was n = 536. The code is included as Supplementary Material. We performed internal validation using the test set comprising 699 cases not used for development of the model. We performed external validation on the Danish validation set. For both assessments, we used the same metrics as used for external validation of the BBN model: discrimination by ROC analysis and AUC, 18 and overall performance using the Brier score. Discrimination and Brier score is one aspect of model performance but does not provide information of the utility of the model for clinical use. Decision curve analysis (DCA) overcomes this limitation by quantifying the consequences of over- or undertreatment and is increasingly being used to assess prediction models for clinical use. Prediction models generate a survival probability at a given time point after diagnosis. If the probability is 1 or near 1, the surgeon will presumably not be in doubt whether to treat; if the probability is near 0, the surgeon will probably decide against surgical intervention. When the probability of survival is between 0 and 1, decision-making might be more difficult for the clinician. The threshold probability is the point where the expected benefit of surgery is equal to the expected benefit of not treating and where surgeons may become indecisive. 24 Assuming the decision to perform surgery is based solely on the outcome of the prediction model, a range of threshold possibilities between 0 to 1 are plotted against net benefit on a decision curve. The broad range of threshold possibilities to evaluate the prediction model is essential since thresholds are patient- or clinician-dependent. 25 We compared the net benefit of all thresholds and hence determined the clinical use of the model. A model is considered as clinically usable if it demonstrates net benefit across the range of thresholds, that is, it is superior to assuming that all patients or no patients would live longer than 1 year. As illuminated by Vickers et al., 25 net benefit is defined as a patient who will undergo appropriate treatment (surgery) or the opposite: will not undergo treatment based on the prediction model outcome.
Distribution and comparison of baseline variables between training and validation cohort.

IQR: interquartile range.
Mann–Whitney U-test.
Chi-square test.
Baseline distributions between the training cohort and the validation cohort were compared using nonparametric tests. Mann–Whitney U-test (for unpaired data) was used for continuous variables and chi-square test for categorical variables.
We used R studio (R Foundation, Vienna, Austria) for development and external validation of the GBM model and comparison of baseline distributions between the train and validation set.
Results
As intended, the demographic and clinical features of the test set and validation set differed (Table 1). The features that differed significantly were age at diagnosis, tumor size, grade, diagnosis, pathologic fracture at diagnosis, tumor location, and status 1 year after diagnosis. The non-significant observations were sex (p = 0.63) and metastasis at diagnosis (p = 0.22). The proportion of missing values varied among features, but in the train set, the most notable was the tumor size (missing in 51%), and in the validation set, grade (missing in 23%; Table 1).
External validation of the BBN model
External validation of the BBN 1-year prediction model yielded poor discriminatory ability with an AUC ROC of 68% (95% confidence interval [CI], 62%–73%; Figure 2), and hence the ability of the model to discriminate between survival and no survival is insufficient when based on this Danish population. The overall model performance evaluated with the Brier score was 0.12 (95% CI: 0.102–0.141).
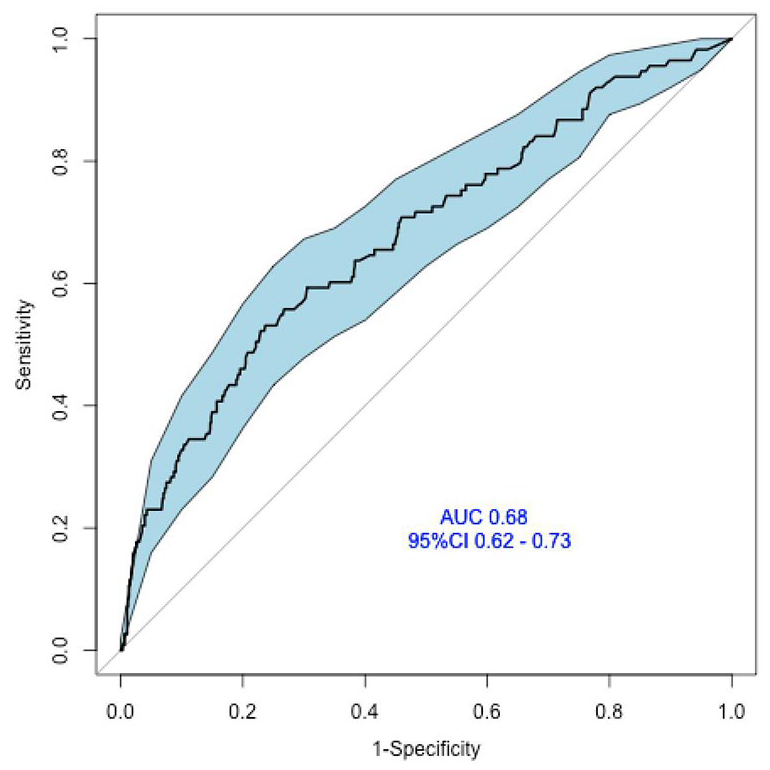
ROC curves of the external validation of the1-year survival BBN model. The discriminatory accuracy of the BBN model for survival yielded poor power (0.68).
Internal validation of the GBM model
Internal validation by AUC ROC analysis yielded good discriminatory ability with 75% (95% CI: 70%–80%; Figure 3). The Brier score for overall model performance was 0.09 (95% CI: 0.077–0.11). DCA demonstrated a positive net benefit, that is, above the lines assuming none or all patients are alive 1 year after diagnosis, hence supporting that the model is suitable for clinical use for probability thresholds above 0.5 (Figure 4). However, at threshold probabilities below 0.5, the surgeon gains more benefit assuming that all patients are alive. Nandra et al. 6 demonstrated similar findings when performing DCA analysis of the BBN model (0.5). Net benefit was capped at 85% (patients alive after 1 year), given the definition that net benefit is one patient being treated appropriately according to the output of the prediction model. Features that ranked highest in variable importance were diagnosis, tumor size, and age (Figure 1).

ROC curves of the internal validation of the 1-year survival GBM model. The discriminatory accuracy of the GBM model for survival was classified as good (0.75).

Net benefit plotted on the decision curve analysis graph against threshold probabilities demonstrating the benefit of intervention based on decision to treat from model output. The curve demonstrates a net benefit if using the model at thresholds above 0.50 compared to assuming all patients survive. For thresholds below 0.50, the model is no better or no worse that assuming all patients will survive.
External validation of the GBM model
External validation of the GBM model yielded poor discriminatory ability with an AUC of the ROC curve of 63% (95% CI: 57%-68%; Figure 5) and hence the GBM model did not outperform the BBN when externally validated in this Danish cohort. The Brier score was 0.14 (95% CI: 0.12–0.16). Since the model cannot be recommended for clinical use based on this external validation, DCA was not performed.

ROC curves of the external validation of the 1-year survival BBN model. The discriminatory accuracy of the GBM model for survival yielded poor power (AUC: 0.63.)
Discussion
The individual treatment strategy for patients with newly diagnosed bone sarcoma is primarily dependent on estimated short-term survival. To our knowledge, no 1-year prediction model for survival using the machine-learning technique has been successfully externally validated for clinical use. The aim of this study was to evaluate two prediction models for survival and potentially provide clinicians with a validated decision tool to support choice of treatment strategy for patients with bone sarcoma.
Owing to the variety and heterogeneity of bone sarcomas, management is based on individual decision-making. While several prediction models for short-term survival have been developed for patients with metastatic bone disease8,26 and soft tissue tumors, 9 only separate prognostic factors for survival have been identified for patients with bone sarcoma.1,27 The decision to perform surgery and which surgical intervention to choose often relies on estimated survival based on the presence of the prognostic factors. The identification of prognostic or predictive factors is not straightforward. Although there is a lack of consensus on how to carry out clinical trials for identification of predictive factors, it is commonly considered that it is not possible to assess predictive significance of a potential predictive factor without a clinical trial including a control group,28–30 a challenging task in the field of orthopaedic oncology due to low incidence. Furthermore, as stated in a systematic review by Bramer et al., 2 strong unsuspected prognostic factors may not become significant when attempting to evaluate prognostic factors in small, underpowered sample sizes, as is often the case with bone sarcomas.
A prognostic factor is defined as a factor with proven independent impact of a given outcome (e.g. death) regardless of any given treatment. As such, independent prognostic factors are able to identify subgroups with differing risks (e.g. tumor size) and hence they guide decision-making. 28 However, prognostic factors are not powerful enough to guide choice of treatment on an individual level as opposed to validated predictive factors. 31 A predictive factor is a factor that identifies differential benefit from a certain treatment depending on the status of the predictive factor.29,31 A prognostic factor can also be a predictive factor but not necessarily; most prognostic factors are not predictive.32,33 Current literature indicates that at diagnosis, metastasis, tumor size, and age are the most commonly suggested prognostic factors for survival.2,34,35 There is a broad consensus that the presence of metastases at diagnosis is the factor with the greatest impact on prognosis.2,27,35 Other suggested factors, such as alkaline phosphatase, tumor site, histologic subtype, and sex, have consistently been reported as prognostic factors for survival.36–38
The developed GBM model demonstrated five features appearing with the highest rank of relative influence on outcome of interest: diagnosis, tumor size, age, metastasis at diagnosis, and year of diagnosis (Figure 1), consistent with previous findings in the literature. Nandra et al. 6 also identified tumor size, age, and metastasis at diagnosis as having the largest prognostic effect on short-term survival, indicating the relative importance of these features for any future model predicting survival in patients with bone sarcoma. Nevertheless, to strengthen the model and circumvent observational bias, the use of objective variables, such as biochemical markers, should be considered. Several biochemical markers have proven well suited as features for prediction models in patients with bone metastasis; 26 serum lactate dehydrogenase and molecular markers, such as p-53 and p-glycoprotein, have been reported to have prognostic value for patients with osteosarcoma. 39 Thorn et al. 40 found a positive correlation between high YKL-40 protein expression in tumor tissue and longer overall survival in osteosarcoma patients. To the best of our knowledge, no biochemical or molecular marker has been used as a feature for development of prediction models for patients with bone sarcoma using machine-learning techniques. The demonstrated relative importance of year of diagnosis (Figure 1) is doubtless a reflection of the incremental improved overall survival from 1970 to present. However, year of diagnosis is not a reproducibly variable; consequently, this time variable is not recommended for prediction as it may add to overfitting of the model and in the present models also to underestimating mortality and, ultimately, the risk of under-treating patients. Identification and inclusion of solid variables is undoubtedly warranted. Other solutions could be to improve the variety of data, as suggested by Chen et al.; 41 we suggest objective variables such as biochemical markers. In addition, prediction models for each main subtype of bone sarcoma would increase homogeneity and generalizability, as demonstrated by Quirina et al. 42
The machine-learning technique is based on algorithms that find patterns in preferably large, irregular, and complex sample sizes. Few attempts have been made to overcome the lack of knowledge in identifying an adequate sample size for machine-learning prediction models.43,44 Large sample sizes have previously been recognized as the single biggest influence on design and performance of models together with the rule of thumb with 10 events per predictor parameter of interest.43–45 This was contradicted by Riley et al. 43 who proposed three criteria for identifying the minimum sample size. Furthermore, Chen et al. 46 demonstrated that modern data in small sample sizes used to train prediction models have greater impact for accurate prediction than do larger historical sample sizes. This is supported by Park and Han, 47 suggesting that robust validation of a model depends on an adequate target population, preferably prospective. Given our results, it is questionable whether the Danish population cohort used for validation of both models was adequate for validation in terms of sample size and events per variable despite the cohort being modern with limited missing data.
One of the main risks of model overfitting is too many features compared with the number of observations. The demonstrated overfitting of the BBN model by Nandra et al. 6 and present GBM model could partly be explained by the significantly improved overall survival from 1970 to 2016; 2 hence, decreasing the outcome of interest (events). We suggest that the considerably improved treatment for patients with bone sarcoma in general and the resulting better overall survival during the present period affect the outcome of interest variable and hence also the generalizability of both models when being validated in a modern cohort.
We chose to create a GBM model for several reasons. GBM models are capable of handling large non-parametric sample sizes with complex interactions and substantial missing or outlying data. 10 Furthermore, GBM models have proven to provide higher and more accurate prediction than other conventional single machine-learning methods and in some studies also when compared with other ensemble methods, such as bagging.10,48 Some obvious advantages of the GBM technique are the customizability and full transparency. Nevertheless, another common cause of overfitting is the models being too powerful, and since GBM models tend to continuously mitigate any errors during process, they are prone to overfitting if not duly regulated by model hyperparameter tuning. 10 One could be tempted to train the model with a high number of base-learners with many splits and subsequently boost the model with numerous iterations to obtain high accuracy. However, beyond any given optimal number of iterations, the model will predict the training cohort with a consequent increased loss and decreased generalizability. Hyper-tuning of parameters is therefore a crucial balance. We speculate that the capability of the GBM model combined with the use of a historical train set partly explains why the present model was not successfully validated in this Danish cohort despite significant differences in patient demographics between the training and validation cohort.
Limitations
Machine learning makes minimal assumptions about data, and the models are solely evaluated by their ability of accurate prediction. 30 In machine learning, no hypotheses are being tested, as in classic statistics, and hence power analysis was not performed. Nevertheless, certain study limitations in the validation cohort need to be addressed. First, although data were drawn from a prospectively maintained database, all data are to be considered retrospective. Second, the data comprise only patients from a Danish population and origins from two tertiary referral centers with the same treatment strategy and hence may not represent the desired heterogeneity used to test the model for generalizability. However, data were chosen due to the no loss to follow-up and limited missing data. Furthermore, the patients included were not selected for surgery but comprised all patients with newly diagnosed bone sarcoma. Nevertheless, the selection bias may cause the model to be less robust. Third, we did not explore the cause of death, and death from causes other than the cancer diagnosis might have added inaccuracy to the model toward underestimation of survival. Next, the requirement of equal features for validation is essential and although GBM and BBN techniques are particularly feasible with missing data, we acknowledge the missing data for alkaline phosphatase in the validation cohort, although they were excluded in the training cohort as described by Nandra et al. 6 Alkaline phosphatase has previously proven to be prognostic for patients with osteosarcoma, 49 and it is possible that the inclusion of alkaline phosphatase would have improved prediction accuracy of the GBM model. Moreover, by converting the histologic grade variable for the purpose of equality, we might have added further observation bias to the final model. Finally, the external validation on both models was performed on a smaller cohort compared with the train set and with significant differences in baseline characteristics apart from sex and metastasis at diagnosis (Table 1). These differences could partly be explained by the large sample size where even small differences were detected as well as by the different time periods when patients were included. Clearly, the 1-year survival changed from 1970 to 2012 due to considerable improvements in diagnostics techniques and treatment modalities, 2 as also seen by the significant difference in 1-year survival between train and validation cohort (Table 1).
Estimating 1-year survival in patients with bone sarcoma is challenging. We believe our study proves the power and potential of the GBM algorithm. However, the predictive power of a model is not in itself a product of a given algorithm more than the variables used train them. Our results necessitate reflection on the feasibility of machine-learning models as a tool for prediction in this patient population. Machine-learning models were originally designed to serve purposes other than medical decisions. The unconventional construct of cohorts without any assumptions is appealing, given the complexity and heterogeneity of patients with bone sarcoma but may result in unrecognized inadvertent biases conflicting with clinical practice. Although the aim should never be to replace clinical assessment but rather to assist clinical decision-making, we may need to reconsider the background for creating prediction for mortality, bearing in mind the statement by Moons et al. 50 Just because a model is good to predict does not mean it is useful clinically.
Conclusion
External validation of the 1-year BBN survival model yielded poor outcome, and the model is not recommended for clinical use based on a Danish population cohort validation.
We successfully generated a GBM model for 1-year survival. With internal validation, the resulting model demonstrated good accuracy and model performance when predicting 1-year mortality in patients with newly diagnosed bone sarcoma.
The GBM model did not outperform the BBN model when externally validated in a Danish population cohort. We encourage other institutions to validate the present model in a non-Scandinavian population.
The study reinforces the need for external validation of prediction models prior to clinical use. We are committed to continuing the ongoing work with development and improvement of prediction models for patients with bone sarcoma. We encourage further insight into and discussion of machine-learning techniques as a method of prediction in a clinical setting.
Supplemental Material
sj-txt-1-smo-10.1177_20503121221076387 – Supplemental material for Development and comparison of 1-year survival models in patients with primary bone sarcomas: External validation of a Bayesian belief network model and creation and external validation of a new gradient boosting machine model
Supplemental material, sj-txt-1-smo-10.1177_20503121221076387 for Development and comparison of 1-year survival models in patients with primary bone sarcomas: External validation of a Bayesian belief network model and creation and external validation of a new gradient boosting machine model by Christina E Holm, Clare F Grazal, Mathias Raedkjaer, Thomas Baad-Hansen, Rajpal Nandra, Robert Grimer, Jonathan A Forsberg, Michael Moerk Petersen and Michala Skovlund Soerensen in SAGE Open Medicine
Footnotes
Acknowledgements
The authors thank Professor Henrik Jørgensen and Dr. Dennis Winge Hallager for their insights into data curation.
Declaration of conflicting interests
The author(s) declared no potential conflicts of interest with respect to the research, authorship, and/or publication of this article.
Ethical approval
Ethical approval for this study was obtained from: The Danish Data Protection Agency (no. P-2019-54) and the Danish Patient Safety Authority (no. 3-3013-2866/1).
Funding
The author(s) disclosed receipt of the following financial support for the research, authorship, and/or publication of this article: The Danish Cancer Society and the A.P. Moller Foundation.
Informed consent
Informed consent was not applicable due to the nature of the study.
Supplemental material
Supplemental material for this article is available online.
References
Supplementary Material
Please find the following supplemental material available below.
For Open Access articles published under a Creative Commons License, all supplemental material carries the same license as the article it is associated with.
For non-Open Access articles published, all supplemental material carries a non-exclusive license, and permission requests for re-use of supplemental material or any part of supplemental material shall be sent directly to the copyright owner as specified in the copyright notice associated with the article.