
Abstract
Background:
Abdominal obesity is emerging as a major contributor to the worsening of non-communicable diseases. There is a dearth of data on central obesity among adults in Ethiopia in general and in the study area in particular. The aim of this research was to determine the prevalence of central obesity and its predictors among adults in Nekemte, Ethiopia.
Methods:
Community-based cross-sectional study was conducted in Nekemte town from March to April 2020. Multistage sampling technique was used to select 466 study participants. Interviewer-administered structured questionnaire was used for data collection. The data were entered into Epi Data 3.1 and analyzed by SPSS Version 25. Bivariate logistic regression analysis was used to identify candidate variables at p < 0.25. Finally, multivariable logistic regression analysis was used to identify the independent predictors of central obesity at p < 0.05 with 95% confidence intervals.
Results:
Prevalence of central obesity in this study was found to be 28.4% (95% CI 24.5–32.6). Where, the prevalence was higher among females (37%) than males (18%). Being a female (AOR = 5.59, 95% CI 2.95–10.57), age range of 40–49 years (AOR = 4.91, 95% CI 2.17–11.13), ⩾ 50 years (AOR = 8.16, 95% CI 3.21–20.72), being in marriage (AOR = 9.306, 95% CI 4.23–20.44), highest wealth status (AOR = 7.94, 95% CI 3.76–16.76), consumption of fast foods (AOR = 3.022, 95% CI 1.375–6.64), and lack of knowledge about obesity (AOR = 3.39, 95% CI 1.93–5.95) were factors associated with central obesity.
Conclusion:
The study revealed a moderate prevalence of central obesity in the study area. Being a female, older age, being in marriage, richest household wealth status, consumption of fast foods, and lack of knowledge on obesity were identified as factors associated with central obesity. Comprehensive health education and promotion on healthy diet should be encouraged focusing on females, married individuals, and older ages.
Introduction
Obesity is a medical condition which is characterized by abnormal fat accumulation in the body which may impair health. 1 Central obesity is an excess accumulation of fat in the abdominal area particularly due to excess visceral fat. It is the most common nutritional disorder in humans which disposes the individual to a complex health problem. 2
Although the cause of obesity is multifactorial in which genetics, environmental, and physiological factors were participated, the fundamental cause of it is an imbalance between calories consumed and calories expended. 3 Obesity is the current global problem as a result of evolution in diets because of changes in food availability, food prices, and level of income, which caused replacement of traditional plant-based diets by high sugars, animal fats, low in starch diets, low dietary fiber, low fruits, and vegetables has been increased. 4 This transition, combined with changes in lifestyle, such as physical inactivity due to the increased sedentary nature of many forms of work, changing modes of transportation, and increasing urbanization 1
Obesity can be divided into general and regional. 5 There are two main types of regional obesity in terms of fat distribution and the risk for development of disease as gynoid and android. The gynoid type of fat distribution, which is also called pear shape, is common in females and it indicates that heavier deposits of fat occur around the thigh and buttocks. Individuals with this type of fat distribution typically do not develop impairment of glucose metabolism. However, android or apple shape of fat distribution is common in men, which is commonly stored around the waist and upper abdomen. This type is highly associated with significant risk of cardiovascular disease (CVD) and non-insulin dependent or type II diabetes mellitus. 6
World Health Organization (WHO) guidelines stated that alternative measures that reflect abdominal obesity, such as waist circumference (WC), waist-to-hip ratio (WHR), and waist-to-height ratio (WHtR), have been found to be superior to body mass index (BMI). However, WC alone could replace WHR and BMI as a single risk factor for all causes of mortality. 7 Similarly, WC was also found to be a simple and more accurate predictor of type 2 diabetes mellitus than other indices, such as BMI and WHR. 8
The increased prevalence of obesity in past decades in several parts of the countries is taken as a worldwide epidemic. 8 The worldwide prevalence of obesity nearly tripled between 1975 and 2016. In 2016, more than 1.9 billion adults aged 18 years and older were overweight. Of these, over 650 were obese. Overall, 13% of the world’s adult population (11% of men and 15% of women) was obese in 2016. 1 If the condition left ignored worldwide, an estimated 57.8% of adults will be expected to be classified as obese by 2030. 8
Over the past years, obesity was considered as the problem of high-income countries, but nowadays the number of people with overweight and obesity has been rising in low- and middle-income countries especially in urban settings. Worryingly, recent studies done in different parts of African countries showed, central obesity as to be growing faster. South Africa was the most affected country with the prevalence of central obesity among adults, 67.0%. 9 Studies in other African countries also indicated the high prevalence of central obesity. For instance, study conducted in West Africa, Tanzania, and Uganda reported the prevalence as 50.8%, 24.88%, and 11.8%, respectively.10–13
Ethiopia has not been excluded from this burden. Though there is no national data on central obesity in adults. Few studies conducted in different regions indicated the significant prevalence of central obesity to be 37.6%, 26%, 21.29%, and 19.6% in urban areas of northwest Ethiopia, Jimma University teaching hospital, Mizan Aman town, and Addis Ababa, respectively.14–17
Obesity is the serious health problem as it can become a burden on health care cost and reduce quality of life since it is an important intermediate risk factor for chronic non-communicable disease (NCD). Globally 44% of diabetes burden, 23% of ischemic heart disease burden, and 7%–41% of certain cancer burdens are attributable to overweight and obesity. 18 NCDs are the leading cause of death globally, and one of the major health challenges of the 21st century. In 2016, they were responsible for 71% (41 million) of the 57 million deaths which occurred globally. 19
Once NCD was a problem of developed countries, currently it is also a problem of developing countries. In 2016, 78% of all NCD deaths, and 85% of premature adult NCD deaths, occurred in low- and middle-income countries (LMICs). High mortality related to NCD was observed in the African which is 22%. 19 This increasing incidence of chronic NCDs in low-income countries of Sub-Saharan Africa (SSA) poses a growing challenge to their national health systems, given that infectious diseases are still highly prevalent in these settings. 20
In Ethiopia, deaths related to NCD are estimated to be around 42%. Among these, 27% are premature deaths occurring before 70 years of age. Disability-adjusted life years (DALYs) due to NCDs in the country have increased from 20% in 1990 to 69% in 2015.15,21
To avert this devastating problem, attention was given to the worrying trends in the magnitude of chronic diseases and their risk factors in Ethiopia. As a result, tobacco-free and physically active initiative was launched by Federal Ministry of Health (FMOH). 22 In addition, NCD was included as one component of the national nutrition program (NNP) with the following initiatives: promoting public awareness of healthy lifestyles, integration of prevention and control of lifestyle-related disease in the urban health extension program to enhance physical activities of the community. Despite this, according to WHO’s report of 2018 on NCD country profiles, 39% of all deaths in Ethiopia were caused by NCD. 19
Abdominal obesity was emerging as an important driving force behind the deterioration of NCD risk in adults. It is the major component of a defined cluster of risk factors for chronic NCD called metabolic syndrome. 23 Individuals with evidence of cardiovascular and diabetes disease often display central obesity. 13 Observational studies have identified central obesity as a predictor of adverse metabolic and cardiovascular outcomes independently of BMI. 24
Previous studies conducted outside of our country identified factors associated to central obesity as socio-demographic and economic factors, behavioral factors, and dietary-related factors.5,13,20–23,25 However, there are contradicting findings regarding some of the variables and there are also variables not studied. In Ethiopia, even if there are few studies conducted to assess obesity among adults, they focused on general obesity which is measured with BMI. 24 However, although BMI is considered as a clinical or epidemiological tool for the evaluation of risk for chronic NCD in both primary and secondary prevention, 2 WHO and also some studies still suggested using of WC, with or without accompanying BMI to measure obesity.26,27 Since obesity-related comorbidities were found to be more closely associated with abdominal adiposity and visceral fat depots than with the amount of total body fat.18,28,29
To the best knowledge of the investigator, there is limited published study which identified factors associated with central obesity among adults in Ethiopia in general and study area in particular. Also, few published studies which identified prevalence of central obesity among adults were institutional-based study which may be difficult to generalize for large community. So, this study was conducted to assess magnitude and associated factors of central obesity among adults of Nekemte town, West Ethiopia, 2020.
Materials and methods
Study area and period
The study was conducted in Nekemte town from March to April 2020; Nekemte town is 328 km away from the capital city of the country, Addis Ababa, to the west. The town is located at latitude of 9°5’N to longitude of 36°33’E with the altitude of 1960–2170 m above sea level. According to the 2018 annual report of the municipality, there are 132,710 populations of which adults aged 18–64 years group comprise 69,523. The town is subdivided into seven administrative kebeles.
Study design and population
Community-based cross-sectional study was conducted taking all adults residing in Nekemte town during the study period as source population and all the randomly selected adults who fulfilled the eligibility criteria as study population.
Eligibility criteria
Inclusion criteria
Adults aged from 20 to 64 years.
Being residents of Nekemte town for at least 6 months before the study period.
Exclusion criteria
Women with self-reported pregnancy.
Severely ill and unable to communicate during data collection.
Edematous individuals.
Sample size determination and sampling technique
Sample size was determined using single population proportion formula by considering 95% confidence interval, 5% accepted margin of error, and 26% prevalence of central obesity among adults in Jimma University teaching hospital; 17 accordingly, the calculated sample size for this study was 295. After multiplying with 1.5, which is design effect, and adding 5% considering non-response, the final sample size was 466.
Multistage sampling techniques followed by systematic random sampling were utilized to select the study participants. Households were selected through systematic random sampling approach based on the interval calculated from, K = N/n = 12,443/466 = 26. To select the first household, bottle spinning method at the middle of the selected kebeles was used; then, a random number was selected within the sampling interval and the number of households in the direction of the head of the bottle was counted until the selected number is reached; then, the next household was selected by adding the sampling interval to the randomly selected number. Then, data were collected every 26 houses from all the selected kebeles. From each selected household, an adult aged 20–64 years was drawn. When multiple adults were available within the household, one adult was chosen at random from the same household. Conversely, when no adult was available, one was selected from the immediate neighboring household. In case sampled adult was absent from their home during data collection period, another visit was arranged.
Variables of the study
Central obesity was the dependent variable of the study. Whereas independent variables where socio-demographic factors, behavioral factors, such as smoking, drinking alcohol, physical inactivity dietary factors, such as consumption of fruits and vegetables, skipping breakfast, dietary diversity score, and knowledge toward obesity, they were assessed by structured questionnaire.
Data collection instruments
Interviewer-administered structured questionnaires which adapted from WHO stepwise for NCDs surveillance, EDHS, and Food and Agricultural Organization (FAO) were used to collect the data.30–33 The instrument consists of socioeconomic, behavioral, diet-related physical activity questions, knowledge toward obesity, and anthropometric measurements of WC, weight, and height.
Data collection procedures
Data were collected by six BSc nurses, and three health officers were assigned as supervisors. Anthropometric measurements were taken after the interview.
Assessment of physical activity
The global physical activity questionnaire (GPAQ) developed by WHO for physical activity surveillance was used to assess the physical activity pattern among selected participant 33 which is based on intensity, duration, and frequency of physical activity at work, in recreational settings and involving transportation (journeys), using a set of 16 questions. Data were collected on the number of days, hours, and minutes of the physical activity performed at work, involving transportation and in recreational settings for at least 10 min or more continuously each day.
Assessment of dietary intake
In total, 24-h dietary recall was used to assess dietary intake. Participants were asked to mention all things what they ate from sunrise of yesterday to sunrise of today, including snacks and foods eaten outside of the home. Those foods were categorized into nine food groups (starchy staples, dark green leafy vegetables, vitamin A rich fruit, vegetables and tubers, other fruits and vegetables, organ meat, meat and fish, eggs, legumes, nuts and seeds, milk and milk products) which was adapted from FAO. 32 The participant was coded as a “consumer” of a food group if they had consumed at least one food item from food groups within the last 24 h.
Food frequency questionnaire adopted from WHO stepwise was used to assess frequency of consumption of different types of food groups. Participants were asked to report the number of times they consumed weekly from the last 12 months.
Knowledge toward obesity
To assess knowledge of the participants toward obesity, 12 standard questions adopted from FAO were used. 33 Based on this question, the mean of their score was taken to classify them as having poor knowledge or good knowledge toward obesity.
Anthropometric measurements
WC was measured on a standing position midway between the lower rib margin and the anterior superior iliac crest in the horizontal plane at the end of a normal expiration, with the arms relaxed at the sides using a flexible plastic metric tape and recorded to the nearest 0.1 cm.
Operational definitions and definition of terms
Adult
A person whose age group found between 20 and 64 years. 34
Centrally obese
Measure of WC for European region recommended for Africans by International Diabetes Federation (IDF) and WHO for male ⩾ 94 cm and female ⩾ 80 cm. 35
Dietary diversity score
Is the sum of total number of food groups consumed from total of nine food groups eaten by the respondent over 24 h prior to data collection day? Depending on this, the individual dietary diversity score (IDDS) of the participant was categorized as follows.
Low
If the participant consumed ⩽ 3 food groups.
Medium
If the participant consumed 4 or 5 food groups.
High
If the participant consumed ⩾ 6 food groups. 31
Low consumption of fruits and/or vegetables
Consumption of fruits and/or vegetables < 5 serving per day.
Wealth index
Socioeconomic index was developed as follows: first, all study participants were asked about the ownership of fixed assets by their household with a score of “1” given to those who own the asset and score of “0” given to those who did not own. Then, principal component analysis was used to develop the wealth index and categorized into three tertiles as poor, medium, and rich.
Fast food consumption
Consumption of food made by fast foods, such as burger, pizza, bombolino, chips, biscuit, sanbusa and the like, at least once per week.
Skipping breakfast
Individual will be considered as skipping breakfast if she or he skips three or more breakfast per week.
Physically active
If the participant’s total physical activity metabolic equivalent of task (MET)-min/week is at least 600.
Physically inactive
If the participant’s total physical activity MET-min/week is less than 600. 32
Smoking status
In this study, smoking status was categorized as follows:
Current smoker
Respondent who has smoked 100 cigarettes in his or her lifetime and who currently smokes cigarettes.
Non-smoker
Respondent who has never smoked or who has smoked less than 100 cigarettes in his or her lifetime.
Former smoker
Respondent who has smoked 100 cigarettes in his or her lifetime and who currently are not smoking cigarettes. 34
Alcohol drinking
Consumption of at least one standard alcohol using local conventional measures during the reporting periods.
Heavy or excessive alcohol consumption
In this study, heavy or excessive alcohol consumption is defined as consumption of ⩾ 6 drinks and ⩾ 4 drinks on a single occasion in men and women, respectively. 35
Good knowledge
Those individuals who scored knowledge questions above or equal to the mean.
Poor knowledge
Those who scored knowledge questions below the mean.
Data processing and analysis
Data were checked for completeness and consistencies, coded, and entered into Epi Data 3.1 then exported to SPSS Version 20 for cleaning and analysis. Principal component analysis was employed for wealth index after checking of all the assumptions. Level of physical activity of the study participants was analyzed using WHO physical activity analysis guideline.
IDDS was calculated by summing a total of nine food groups eaten by the respondents 24 h prior to data collection day. Descriptive analysis was conducted to show frequency distribution and to summarize the data. Chi-square test was conducted to see an association between categorical variables. Bivariable and multivariable analysis were conducted using binary logistic regression. All the variables whose p < 0.25 were taken to multivariable analysis, Hosmer–Lemeshow’s goodness of fit test was employed to check the model fitness and it have p-value of 0.098. Multicollinearity was also checked using variation inflation factor (VIF) at VIF > 10, indicating the presence of multicollinearity. Backward stepwise regression analysis was done; variables at p < 0.05 were declared statistically significant. Results were displayed using texts, tables, and figures.
Data quality assurance
Data quality was ensured starting from tool development to result analysis thoroughly. First, questionnaire was prepared in English language and translated to the local language, Afaan Oromo, then translated back to English language to keep the consistency of the tool.
Two days training was given with practical session for data collectors and supervisors about the objectives, process of data collection, and demonstration of interview through and taking measurement for each trainee. Standardization exercise was done during the training, and coefficient of variation is less than 2.5% for all. The measurement was taken two times and the average was taken as the true value.
Pretest was conducted on 5% of the total sample size (24 adults) residing in Cheleleki kebele of Nekemte town which was not selected in the study prior to the actual data collection to check for clarity and understandability of the questionnaire. Those questions that found to be unclear or confusing were modified based on the result of pretest. Supervisors thoroughly followed all the data collection processes on spot and checked the completeness of the questionnaire on daily basis.
Results
Socio-demographic and economic characteristics of the study participants
Out of 466 participants, 457 (98%) gave complete response. The mean age of participants was 35 (SD ± 9) years and more than one-third (37.4%) of them were 20–29 years. More than half of the participants (54.3%) were females and 64.1% of the study subjects were in marriage. Overall, 139 (39.2%) of the respondents were Government/NGO employee (Table 1).
Socio-demographic and economic status of the respondents in Nekemte town, West Ethiopia, March 2020 (n = 457).
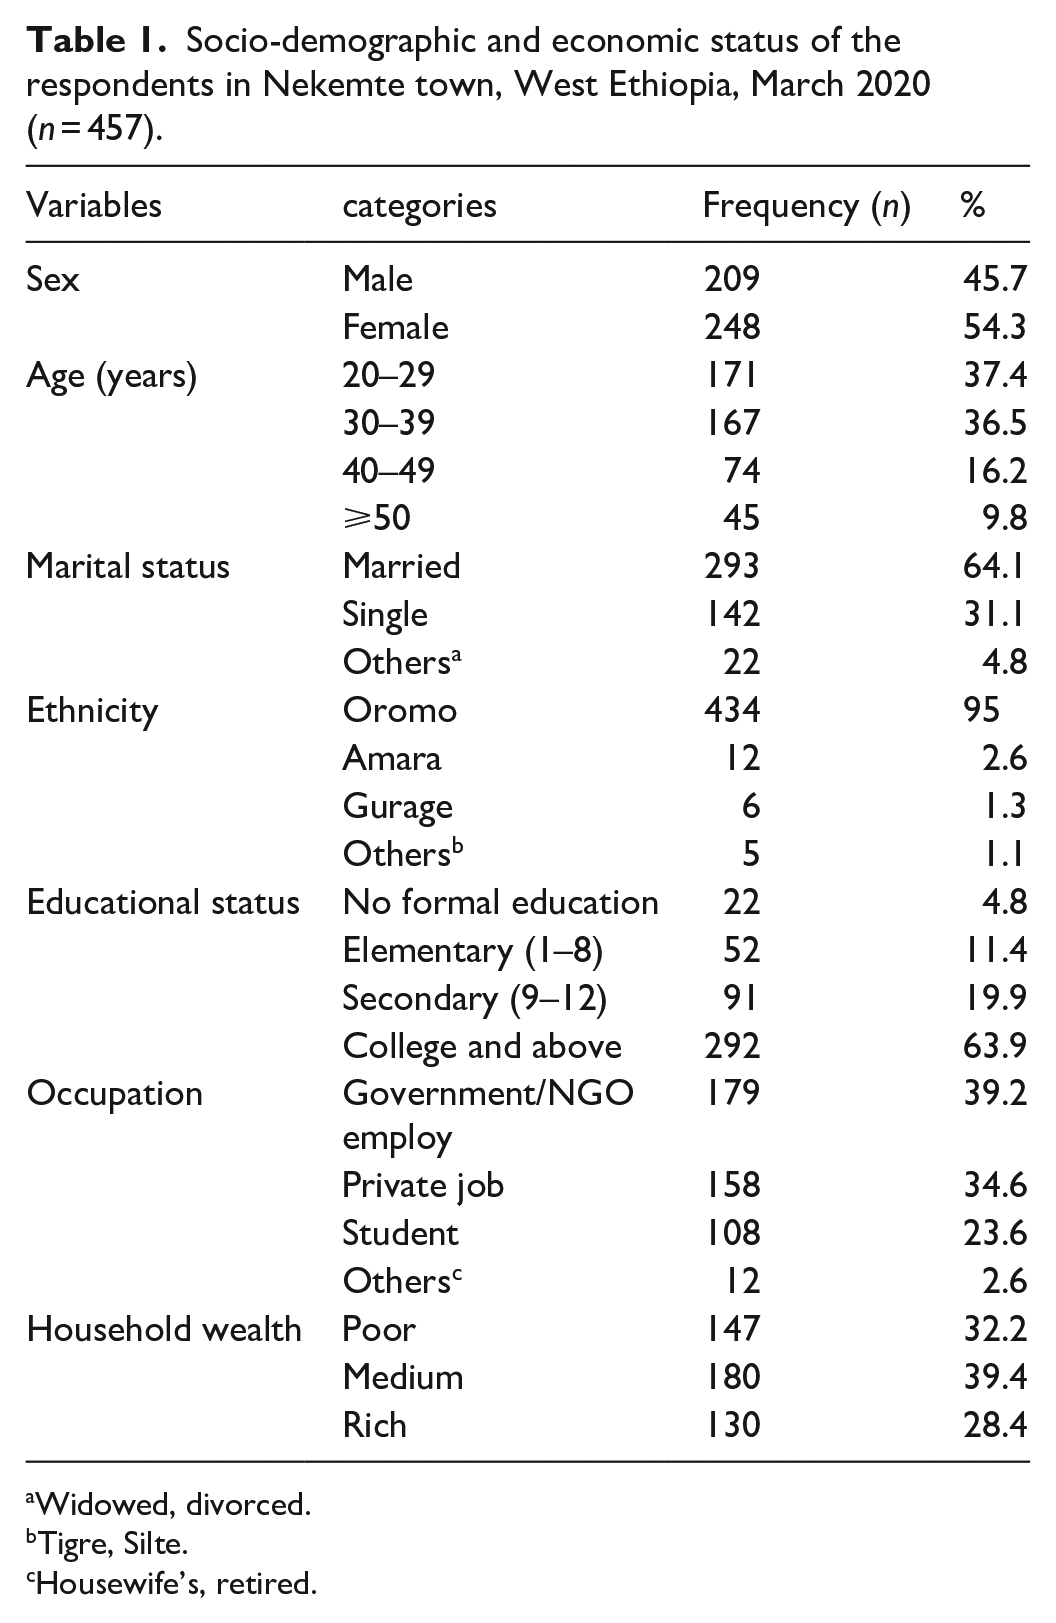
Widowed, divorced.
Tigre, Silte.
Housewife’s, retired.
Behavioral characteristics of the study subjects
Most of the study populations (90.4%) never smoked cigarettes while 4.2% of them were currently smoking. Also, 90 (19.7%) and 75(16.4%) of the participants drunk alcohol within last 12 months and 30 days, respectively.
Majority, 69.6% of the participants had sleep duration of 6–10 h. Regarding physical activity, 354 (77.5%) of them were physically active.
Dietary practice and nutritional status of the respondents
More than three-fourth (83%) of the study participants had low dietary diversity with mean dietary score of 3.3 (SD ± 1.3). However, 186 (40.7%) of them ate fruits and vegetables less than 4 days in a week and 100 (21.9%) had low servings of fruits and vegetables. Also, 319 (69.8%) of the respondents had meal frequency of three and above. Meanwhile, 203 (44.4%) of them did not skip breakfast in typical week. Regarding the BMI category of the study participants, 77 (16.8%) and 34 (7.4%) were overweight and obese, respectively
Knowledge-related characteristics
More than half, 56.5%, of the respondents had good knowledge toward obesity, while 199 (43.50%) of them had poor knowledge toward central obesity.
Prevalence of central obesity
In this study, 130 (28.4%) of the respondents were centrally obese with 95% CI of 24.5–32.6. This was 37% among females and 18% among males (Figure 1).

Prevalence of central obesity by sex among adults in Nekemte town, West Ethiopia, 2020 (n = 457).
Factors associated with central obesity
Multivariable logistic regression analysis indicated that age, sex, marital status, household wealth tertiles, consumption of fast foods, skipping breakfast, and poor knowledge toward obesity were identified to be statistically significant variables associated to central obesity at p < 0.05.
Females were 5.6 times more likely to be centrally obese than males (AOR = 5.56, 95% CI 2.95–10.57). Individuals with age 40–49 and above 50 years were five times and eight times more likely to be centrally obese as compared to those age group of 20–29 years (AOR = 4.9, 95% CI 2.17–11.13 and AOR = 8.16, 95% CI 3.21–20.7), respectively. Married participants were nine times more likely to be centrally obese (AOR = 9.3, 95% CI 4.23–20.4) than those who were single. Respondents within the medium and highest wealth tertiles were 2.5 and 8 times more likely to be centrally obese as compared to those in the lowest tertiles (AOR = 2.5, 95% CI 1.23–4.97 and AOR = 7.94, 95% CI 3.76–16.76).
Individuals who consumed fast foods three and more times per week were about three times more likely to be centrally obese as compared to those who do not eat it (AOR = 3.02, 95% CI 1.37–6.64). Respondents with poor knowledge regarding central obesity were about three times more likely to be centrally obese as compared to their counterparts (AOR = 3.39, 95% CI 1.93–5.95; Table 2).
Multivariable logistic regression analysis of associated factors of central obesity among adults residing in Nekemte town, West Ethiopia, 2020 (n = 457).

COR: crude odds ratio; CI: confidence intervals; AOR: adjusted odds ratio.
Bold values indicates statistically significance.
p-value, * <0.05 ** <0.001.
Discussion
The magnitude of central obesity in this study area was 28.4%. Being a female, older age, being in marriage, richest wealth status, consumption of fast foods, and having poor knowledge on obesity were identified as factors significantly associated with central obesity. This prevalence of central obesity in this study implies that the risk of developing metabolic syndrome and NCD will be high if this problem left unresolved. Since central obesity was identified as a factor associated with increased glucose intolerance, CVDs, certain types of cancers, and mortality from all causes independently of BMI.36–40
The prevalence of central obesity in this study was comparable with the finding from the studies done in Indonesia, Malaysia, Tanzania, and Jimma,37–40 but higher than the findings from result of studies done in southern China, Nigeria, Uganda, Mizan Aman, and Addis Ababa.5,8,23,41,42 This difference might be explained by the change in lifestyle of the society from time to time which comes from increased urbanization and nutrition transition causing replacement of traditional plant-based diets by high sugars, animal fats, low in starch diets, low dietary fiber, low fruits, and vegetables. 43 However, it was lower as compared to the study done in Urban areas of northwest Ethiopia, India, and South Africa.3,14,44 This might be due to the difference in sample size and also the setup in which the study was conducted.
This study showed that females were more likely to be centrally obese as compared to males. This is consistent with the findings of the study done in South Africa, Uganda, and Tanzania3,5,6 This could be due to the fact that in developing countries, males involve in more strenuous exercise than females. Again, the difference in abdominal fat distribution between males and females could be explained as abdominal fat adiposity in females due to the increasing of parity as pregnancy leads to an increase in visceral and abdominal fat and also postpartum and a postmenopausal redistribution of body fat to the abdominal area.39,40
In this study, the risk of abdominal obesity increased with age which was again supported with previous studies done in China and Nigeria.23,41 The possible explanation for this might be physiological change of reduction of basal metabolism and reduction of physical activities causing decreased energy expenditure as age increase leading to positive energy balance and hormonal changes during aging can be another factor as aging is associated with a decrease in growth hormone secretions, reduced responsiveness to thyroid hormone, decline in serum testosterone, and resistance to leptin. Resistance to leptin could cause a decreased ability to regulate appetite downward.41–44
Married participants were more at risk than those who were single and this is again reported from the result of the study done in Uganda, Tanzania, and South Africa.3,5,6 The likelihood of married people being more abdominally obese has been attributed to a change of dietary patterns after marriage in relation to childbearing and culture of postpartum care for women in Ethiopia. Again, this difference might be due to the fact that married individuals are much older than singles in this study.
In this study, central obesity was higher among participants in higher household wealth index. This finding was inconsistent with studies conducted in China and Saudi Arabia.3,23 The possible explanation for this might be in developed countries; economically disadvantaged people are more likely to consume junk and empty calorie foods which are important risk factors of obesity with low price. However, in our country, obesity increases with wealth which might be primarily explained by economic access to food because of those foods with low fiber, high energy density, and saturated fats are more in price than foods with low energy density and high fibers, such as whole grains, fruits, and vegetables.
Subjects who consumed fast foods greater than three times per week were more likely to be centrally obese as compared to those who do not consume it. This finding is also supported with the study done in Iran. 41 The possible explanation for this might be that fast foods are low in fiber, high in glycemic load, and high in energy density which may be greater than the daily energy requirements.41–45
Individuals with poor knowledge toward obesity were more likely to be centrally obese as compared to their counterparts. This might be due to the fact that individuals with poor knowledge may face challenge to practice healthy lifestyle to prevent obesity.
Limitation of the study
Dietary information was taken from 24-h recall which may be affected with different factors.
Since this is a cross-sectional study, the issue of temporality is questionable.
Taking the information on subjective bases on household wealth, age, and dietary, data may lead to social desirability bias.
Conclusion
This study revealed that more than one in four adults residing in Nekemte town were centrally obese. This prevalence was moderate when compared to previous studies done in Ethiopia. Being a female, older age, being in marriage, richest household wealth status, consumption of fast foods, and lack of knowledge on obesity were identified as factors associated with central obesity. Comprehensive health education and promotion on healthy diet should be fostered focusing on females, married individuals, and older ages to curb the problem.
Supplemental Material
sj-docx-1-smo-10.1177_20503121211054988 – Supplemental material for Central obesity and its predictors among adults in Nekemte town, West Ethiopia
Supplemental material, sj-docx-1-smo-10.1177_20503121211054988 for Central obesity and its predictors among adults in Nekemte town, West Ethiopia by Bayise Biru, Dessalegn Tamiru, Abonesh Taye and Bikila Regassa Feyisa in SAGE Open Medicine
Footnotes
Acknowledgements
The authors thank Jimma University, and the study participants and the data collectors.
Author contributions
The authors’ responsibilities were as follows: B.B. conceived the study and wrote the proposal, facilitated data collection, analysis, data interpretation, and prepared the article. All authors had the primary responsibility for the content and finally submitted the article for publication. All authors read and approved the final article.
Declaration of conflicting interests
The author(s) declared no potential conflicts of interest with respect to the research, authorship, and/or publication of this article.
Funding
The author(s) received no financial support for the research, authorship, and/or publication of this article.
Ethical approval
Ethical approval for this study was obtained from Jimma University Institutional Review Board (Ref. No: IRB 00068/2020). Permission letter was taken from Nekemte town administrative office and respective kebeles’ administrative office.
Ethical consideration
Ethical approval for this study was obtained from Jimma University Institutional Review Board with a reference of IRB 00068/2020, and letter of support was written for Nekemte town municipality. Permission letter was taken from Nekemte town administrative office and respective kebeles’ administrative office. All the study participants in the selected households were assured all the objective of the study, their full right to participate in the study, and or withdraw in between in case they were not comfortable with the interview.
Informed consent
Written informed consent was taken from study participants. The purpose, objectives, confidentiality, and the right to complete or refuse were clearly explained for the study participants.
Patient and public involvement
Patients and/or the public were not involved in the design, or conduct, or reporting, or dissemination plans of this research.
Patient consent for publication
Not required
Availability of data and materials
The data used and/or analyzed during the current study are available from the corresponding author on reasonable request.
Supplemental material
Supplemental material for this article is available online.
References
Supplementary Material
Please find the following supplemental material available below.
For Open Access articles published under a Creative Commons License, all supplemental material carries the same license as the article it is associated with.
For non-Open Access articles published, all supplemental material carries a non-exclusive license, and permission requests for re-use of supplemental material or any part of supplemental material shall be sent directly to the copyright owner as specified in the copyright notice associated with the article.