
Abstract
Objective:
Early hospital readmissions have been rising and are increasingly used for public reporting and pay-for-performance. The readmission problem is fundamentally different in surgical patients compared with medical patients. There is an opportunity to intervene preoperatively to decrease the risk of readmission postoperatively.
Methods:
A predictive model of 90-day hospital readmission for patients undergoing elective carotid endarterectomy, aortofemoral bypass/aortic aneurysm repair, and femoral-distal arterial bypass was developed using data from the Healthcare Cost and Utilization Project State Inpatient Database for Florida State. The model training followed a nested resampling method with subsampling to increase execution speed and reduce overfitting. The following predictors were used: age, gender, race, median household income, primary expected payer, patient location, admission type, Elixhauser–van Walraven Comorbidity Index, Charlson comorbidity score, main surgical procedure, length of stay, disposition of the patient at discharge, period of the year, hospital volume, and surgeon volume.
Results:
Our sample comprised data on 246,405 patients, of whom 30.3% were readmitted within 90 days. Readmitted patients were more likely to be admitted via emergency (47.2% vs 30%), included a higher percentage with a Charlson score greater than 3 (35.8% vs 18.7%), had a higher mean van Walraven score (8.32 vs 5.34), and had a higher mean length of hospital stay (6.59 vs 3.51). Endarterectomy was the most common procedure, accounting for 19.9% of all procedures. When predicting 90-day readmission, Shrinkage Discriminant Analysis was the best performing model (area under the curve = 0.68). Important variables for the best predictive model included length of stay in the hospital, comorbidity scores, endarterectomy procedure, and elective admission type. The survival analysis for the time to readmission after the surgical procedures demonstrated that the hazard ratios were higher for subjects who presented Charlson comorbidity score above three (2.29 (2.26, 2.33)), patients transferred to a short-term hospital (2.4 (2.23, 2.59)), home healthcare (1.64 (1.61, 1.68)), other type of facility (2.59 (2.54, 2.63)) or discharged against medical advice (2.06 (1.88, 2.26)), and those with greater length of stay (1.89 (1.86, 1.91)).
Conclusion:
The model stratifies readmission risk on the basis of vascular procedure type, which suggests that attempts to decrease vascular readmission should focus on emergency procedures. Given the current focus on readmissions and increasing pressure to prevent unplanned readmissions, this score stratifies patients by readmission risk, providing an additional resource to identify and prevent unnecessary readmissions.
Keywords
Introduction
As hospital stay lengths decrease, the incidence of early readmissions to hospitals has been increasing. 1 The majority of surgical readmissions are related to postoperative complications. 1 The need for hospital readmission after major surgery is also associated with significant increased risk of mortality.2,3 Hospital readmissions are increasingly used for public reporting and pay-for-performance, providing strong incentives for healthcare systems to study and reduce readmission rates. 4 This has led to increased interest in studying rehospitalization rates and factors contributing to them. 5 Identification of metrics for readmission prediction has become a major priority for healthcare providers.
The readmission problem is fundamentally different in surgical patients compared with medical patients: after a surgical procedure, readmissions are often due to a medical condition. 6 Surgical patients have similar underlying comorbidities to medical patients, but what differentiates surgical patients is the fact that they undergo a specific procedure that, in and of itself, carries an associated risk of readmission. 6 The other major differentiating factor for surgical patients is that the intervention that puts these patients at risk is often planned. This suggests that there is a golden opportunity to intervene preoperatively to decrease the risk of readmission postoperatively. 6 Readmission rates among vascular patients are estimated at ~24% 7 and reportedly cost more than any other readmission studied. 7
As it is not clear which factors are associated with better and worse outcomes, 2 we undertook this study to examine readmission data and create a predictive model for vascular diseases and procedures with high readmission rates. The purpose of this study is to examine factors associated with 90-day hospital readmission after vascular procedures. This study was undertaken to improve understanding of which factors are the most commonly associated with readmission and to provide a tool to inform development of a targeted intervention to decrease early readmissions and improve vascular surgery patient outcomes, using big data and machine learning system.
Methods
Study design
Our objective was to conduct a secondary data analysis of the Healthcare Cost and Utilization Project (HCUP) State Inpatient Database (SID) for Florida State to develop a predictive model of 90-day hospital readmission for patients undergoing elective carotid endarterectomy (CAE), aortofemoral bypass/aortic aneurysm repair (AFB/AAR), and femoral-distal arterial bypass (FDAB) based on machine learning algorithms. Our modeling strategy is described according to the TRIPOD Statement. 8
Ethics
The research protocol for this study was reviewed and approved by the Institutional Review Board (number 00112018).
Data description
The HCUP 9 is a group of databases maintained by the Agency for Healthcare Research and Quality and developed through a federal, state, and industry partnership. The SID is one of the databases developed as part of HCUP and contains information about inpatient hospital discharges for all hospitals in a given state, including records for all patients, irrespective of age or payer. The HCUP revisit variables are linked to the HCUP state databases to track multiple hospital visits by a unique person, determine the time elapsed between visits, and evaluate clinical information at the time of discharge. A revisit can be defined as an inpatient admission, an emergency department visit, or a visit for an ambulatory procedure. 10 We calculated 90-day hospital readmission defined as an inpatient hospital admission revisit within 90 days of the index procedure. Our study analyzed data for elective CAE, AFB/AAR, and FDAB procedures in the state of Florida for 2010 through 2013.
Participants
Inclusion criteria were patients who underwent CAE, AFB/AAR, and FDAB, identified through the International Classification of Disease Version-9-Clinical Modification. For CAE, the procedure codes selected were as follows: 3812-Endarterectomy, other vessels of head and neck; 3950-Angioplasty or atherectomy of other non-coronary vessel(s); and 3990-Insertion of non-drug-eluting peripheral vessel stent(s). For AFB/AAR, the procedure codes selected were as follows: 3925-Aorta-iliac-femoral bypass; 3834-Resection of vessel with anastomosis, aorta; 3864-Other excision of vessels, aorta, abdominal; 3844-Resection of vessel with replacement, aorta, abdominal; 3884-Other surgical occlusion of vessels, aorta, abdominal; 3924-Aorta-renal bypass; and 3952-Other repair of aneurysm. For FDAB, the code selected was 3929-Other (peripheral) vascular shunt or bypass which includes following bypass (graft): axillary-brachial, axillary-femoral (axillofemoral) (superficial), brachial, femoral-femoral, femoroperoneal, femoropopliteal (arteries), femorotibial (anterior) (posterior), popliteal, and vascular nitric oxide synthase (NOS). We also selected the following additional codes that were related to the target procedures: 3846-Resection of vessel with replacement, abdominal arteries; 3836-Resection of vessel with anastomosis, abdominal arteries; 3840-Resection of vessel with replacement, unspecified site; 3860-Other excision of vessels, unspecified site; 3866-Other excision of vessels, abdominal arteries; 3926-Other intra-abdominal vascular shunt or bypass; 3956-Repair of blood vessel with tissue patch graft; and 3957-Repair of blood vessel with synthetic patch graft.10,11 Given that our model was created to be used at the time of discharge, we excluded patients who died during hospitalization, and also those younger than 18 years old.
Outcomes
Outcomes of interest were a readmission (yes/no) within 90 days from discharge after CAE, AFB/AAR, or FDAB and the time to readmission after discharge. Longitudinal tracking was achieved using visit linkage variables across patient encounters made available for patients in the state of Florida.
Predictors
We selected the following predictors: (1) age in years; (2) gender; (3) race (White, Black, Hispanic, and others); (4) median household income (0th–25th percentile, 26th–50th percentile, 51st–75th percentile, and 76th–100th percentile); (5) primary expected payer (Medicare, Medicaid, private insurance, self-pay, and other); (6) patient location (rural or Micropolitan Statistical Area, and Metropolitan Statistical Area); (7) admission type (emergency, urgent, elective, and other); (8) Elixhauser–van Walraven Comorbidity Index, which predicts in-hospital mortality based on a set of 30 acute and chronic comorbidities from the International Classification of Diseases diagnosis codes;12,13 (9) Charlson comorbidity score, for prognostic comorbidity classification, a weighted score derived from the sum of the scores for each comorbidity;13,14 (10) main surgical procedure including endarterectomy, aorta-iliac femoral bypass, and other aneurysm repair; (11) length of stay in hospital, counted in days and defined as the time from the date of the admission to the date of discharge; (12) disposition of the patient at discharge (routine, home healthcare, transfer to short-term Hospital, transfer to another type of facility, and against medical advice); (13) the period of the year when the patient was discharged, as first quarter (January–March), second quarter (April–June), third quarter (July–September), and fourth quarter (October–December); (14) hospital volume, defined as the total number of procedures performed per year in a given hospital; and (15) surgeon volume, defined as the number of procedures performed by a surgeon per year.
Data analysis and statistics
Our exploratory analysis started with a visual exploration of all variables to evaluate the frequency, percentage and near-zero variance for categorical variables (female gender, race, income, patient location, main procedure, primary expected payer, admission type, disposition at discharge, discharge quarter), distribution for numeric variables (age at admission, van Walraven comorbidity score (single numeric score that summarizes disease burden and is adequately discriminative for death in hospital), 12 Charlson comorbidity score (predicts 10-year survival in patients with multiple comorbidities), 13 length of stay, hospital volume, surgeon volume), and their corresponding missing-value patterns. 15 Near-zero variance is identified when a categorical variable has a small percentage in a given category and was addressed by combining variable categories. Missing values were handled through imputation algorithms followed by sensitivity analyses to verify whether our results were stable with and without imputation. 16 Comparisons for exploratory analysis were conducted through analysis of variance (t-tests being a category of analysis of variance) and chi-square tests (Fisher’s exact test when any cell presented a frequency below 5).
We modeled readmission within 90 days after CAE, AFB/AAR, and FDAB and time to readmission as outcome variables using the following variables as predictors: age, gender, race, income, type of payer, patient location, admission type, van Walraven comorbidity score, Charlson comorbidity score, main procedure performed, length of stay, patient disposition at discharge, discharge quarter, hospital volume and surgeon volume. The model training followed a nested resampling method with subsampling to increase execution speed and reduce overfitting. The nested resampling consists of two steps: the outer resampling randomly selects two-thirds of the data for training, up to a maximum of 20,000 observations, and leftover data for validation; the inner resampling uses the training data provided by the outer resampling and also splits the data into two-thirds for training, up to a maximum of 10,000 observations, and the remaining for testing. This strategy provides an efficient architecture to avoid overfitting while still maintaining a good execution speed and performance. Classification models for prediction of the presence or absence of readmission within the first 90 days after discharge included Random Forest, Linear Discriminant Analysis, Penalized Discriminant Analysis, and Stochastic Gradient Boosting. Comparison across models was performed using metrics for the area under the curve, sensitivity, specificity, Kappa, and positive and negative predictive values. The receiver operating characteristic (ROC) curve is a plot of sensitivity on the y-axis and 1-specificity on the x-axis. The area under the curve ranges from 0 to 1, 1 being perfect prediction and 0.5 corresponding to random chance.
To better understand how the model classified individual patients, we used the Local Interpretable Model-Agnostic Explanations (LIME) algorithm, which provides information on risk factors that contributed to predictions for individual patients. 17
We evaluated survival using a Cox proportional hazards model, 18 evaluating the risk of readmission associated with different predictors. The following predictors were selected for this analysis: age in years (categorized as ⩽69 and >69), gender, Charlson comorbidity score (categorized as ⩽2, >2 to 3, and >3 using three statistically equal percentiles), race (white and others), admission type (non-elective and elective), primary payer (Medicare, Medicaid, private insurance, self-pay, and others), household income (0th–25th percentile, 26th–50th percentile, 51st–75th percentile, and 76th–100th percentile), patient disposition at discharge (routine, transfer to short-term hospital, transfer to other type of facility, home healthcare, and against medical advice), discharge quarter (January–March, April–June, July–September, and October–December), length of stay (categorized by the median as ⩽1 and >1), annual hospital volume (categorized by the median in ⩽454 and >454), annual surgeon volume (categorized as ⩾13, 14–70, and >70 using three statistically equal percentiles), presence and absence of main procedures including endarterectomy, aorta-iliac femoral bypass, and other surgeries related to aneurysm repair. Results are reported as hazard ratios with 95% confidence intervals, with results interpreted as significant when confidence intervals did not cross 1.0.
All analyses were performed using the statistical language R. 19
Results
Table 1 shows a description of the overall study sample along with a comparison between patients readmitted within 90 days of discharge and those who were not readmitted. Numeric variables are compared using t-tests and one-way analysis of variance (ANOVA) and categorical variables are compared with chi-square tests. Our sample comprised 246,405 patients, of whom 30.3% were readmitted within 90 days. Most patients in our sample were male (57%), a majority were White (70.7%), and mean age was 67.8 (±12.9) years. Most patients (36.1%) had a median income below the 25th percentile and 92.6% were residents of metropolitan areas. Medicare was the most common payer (75.6%). When compared to those who were not readmitted within 90 days from discharge, readmitted patients had more admissions via emergency (47.2% vs 30%), a higher percentage of individuals with a Charlson score above 3 (35.8% vs 18.7%), a higher mean van Walraven score (8.32 vs 5.34), and a longer mean length of stay in the hospital (6.59 vs 3.51). Patients who were readmitted also tended to be treated by surgeons with a lower mean annual patient volume (56.3 vs 68.3) and in hospitals with a higher mean annual hospital volume (535 vs 522). Of the total sample, 74% were routine discharge, with the highest proportion of discharges (25.9%) occurring during the second quarter (April–June). Endarterectomy was the most common of the three main procedures evaluated, with a total of 19.9% of all procedures involving endarterectomy.
Study sample characteristics.

By evaluating the association between the main procedures and time to readmission, we found that patients who underwent AFB/AAR had a significantly shorter time to readmission compared to those who did not (Figures 1 and 2).

Association between aorta-iliac femoral bypass and time to readmission after hospital discharge.

Association between other aneurysm repair and time to readmission after hospital discharge.
We found that Shrinkage Discriminant Analysis was the model that performed best for predicting 90-day readmission after CAE, AFB/AAR, and FDAB, with an area under the curve of 0.68 (Figure 3). It had a positive predictive value of 0.74 and a negative predictive value at 0.55. Important variables for the best predictive model included length of stay in the hospital, comorbidity scores, endarterectomy procedure, and elective admission type (Figure 4).
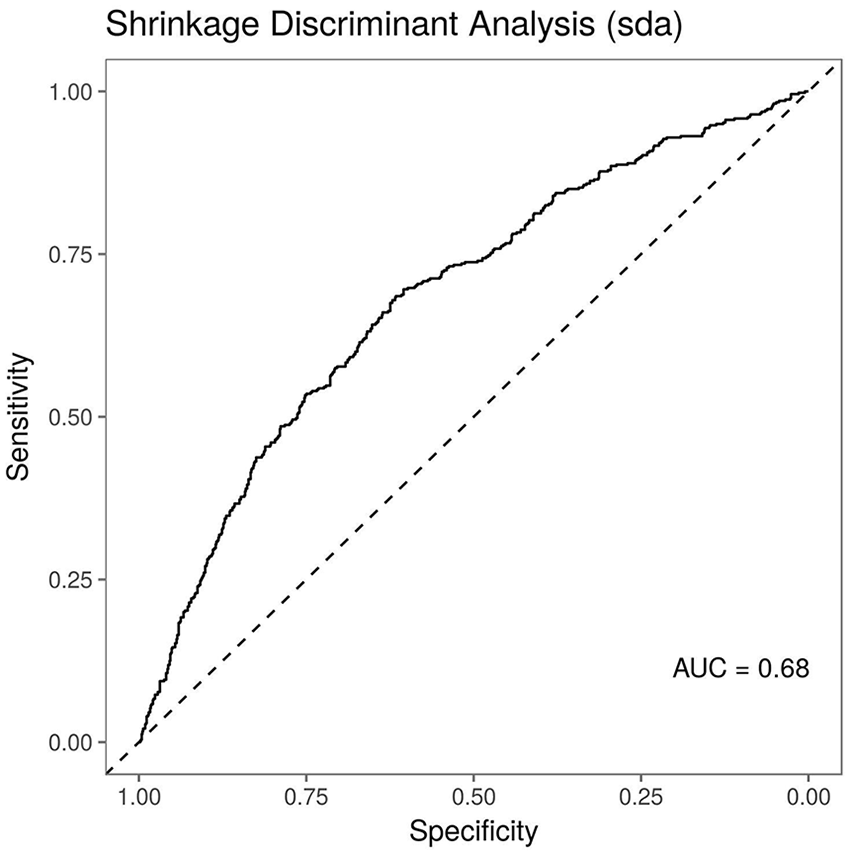
ROC curves for best performing models for predicting readmission within 90 days of discharge.

Variable importance across top performing predictive models for readmission within 90 days from discharge.
Figure 5 illustrates the prediction probabilities of models, showing approximations of how much and in which direction each variable contributed to its prediction for four specific patients. The green bars represent the amount by which the variable increases the risk of the outcome, while the red bar present the risk in the opposite direction. For instance, evaluating the risk of 90-day readmission for a given patient (case #139417), the plot detected that not performing a endarterectomy, having a Charlson score inferior or equal to three, and the length of stay were the variables that made the greatest contributions to model predictions for that specific patient.

Variable importance across predictions for individual patients.
When performing the survival analysis for the time to readmission after the surgical procedures, all variables analyzed were considered statistically significant (p < 0.001) and hazard ratios were higher for subjects who had a Charlson comorbidity score above three (2.29 (2.26, 2.33)), patients who were transferred to a short-term hospital (2.4 (2.23, 2.59)), home healthcare (1.64 (1.61, 1.68)), other type of facility (2.59 (2.54, 2.63)) or discharged against medical advice (2.06 (1.88, 2.26)), and patients who stayed in hospital for a longer time (1.89 (1.86, 1.91)) (Table 2). Patients who underwent an endarterectomy had a significantly lower risk of readmission than those who did not undergo this procedure (0.58 (0.57, 0.59), p < 0.001) (Figure 6).
Survival analysis: time to readmission hazard ratio for carotid endarterectomy, aortofemoral bypass/aortic aneurysm repair, and femoral-distal arterial bypass surgical procedures.

To make the model available for clinical use, we designed a web-based application to calculate the risk of readmission for a given patient along with the corresponding risk factors: https://vascular.pro/content/prediction-individual-patient-readmissions-elective-carotid-endarterectomy-aortofemoral.
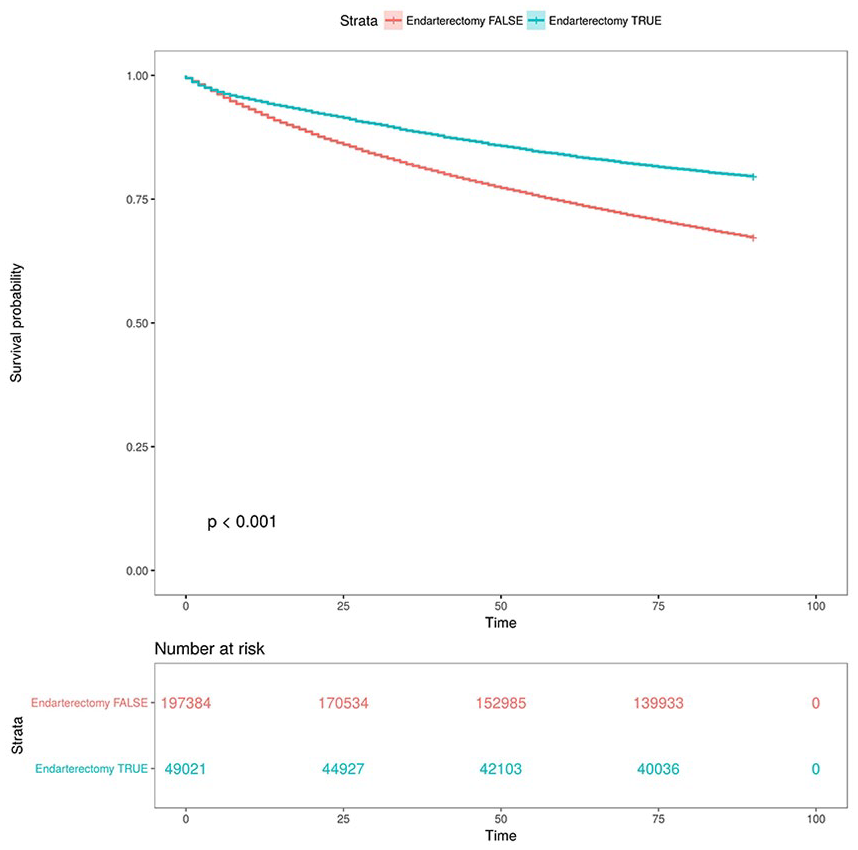
Readmission after endarterectomy procedure.
Discussion
Although there is extensive literature on rehospitalization attributed to particular conditions, especially heart failure, 20 there is very limited research involving vascular diseases and vascular procedures that contribute to rehospitalization.7,21 –23 With regard to lower extremity arterial occlusive disease, in the late 1990s, Goodney et al. 24 reported readmission rates of 19.3% for patients undergoing lower extremity bypass, 11.2% for CAE, and 10.9% for elective AAR. CAE readmission was 7% in a 2007 study. 25 In 2009, a 30-day readmission rate of 24% was reported for patients undergoing peripheral vascular surgery. 21 Recently, an all vascular procedures 30-day readmission rate of 23.3% and a 1-year readmission rate of 53.8% have also been reported, and readmitted patients were more likely to be diabetic (69%), hypertensive (92%), hyperlipidemic (66%), and former or active smokers (62%), and had more cardiovascular comorbidities (87%). 26 In another study, 30-day readmission rates were equivalent for endovascular aneurysm repair (13.3%) and open aneurysm repair (12.8%). 3 We observed a higher percentage of readmissions for vascular procedures than previous papers, 24 but our work is based on data for 90-day readmission. Irrespective of the cause, it is well known that the cost of readmission is very high. 27 This highlights the importance of understanding modifiable factors that influence the disparate causes of rehospitalization. 21 Postoperative readmissions are frequent in vascular surgery patients, 7 but we lack understanding of the reasons and tools to avoid them. 7
It has been shown that post-discharge infections were the most common causes of unplanned vascular surgery readmission,7,28 and the most common vascular operations associated with readmission for infection were lower extremity bypass, amputation, and suprainguinal bypass. 7 These findings suggest that efforts to reduce vascular readmissions focusing on inpatient hospital data could be ineffective and that interventions to reduce vascular readmissions should therefore focus on prompt identification of modifiable post-discharge complications. 28 As such, a number of preoperative patient risk calculators have been proposed22,23 using 30-day readmission data. A predictive model has been created for infectious complications for unplanned vascular readmissions using preoperative patient variables. 7 In that model, Hicks et al. 7 identified the top 5 preoperative risk factors as presence of preoperative open wound, inpatient operation, class III obesity, work relative value unit, and insulin-dependent diabetes. A meta-analysis of 44 studies published before 1990 revealed that age, length of stay during the index hospitalization, and previous use of hospital resources were among the main independent predictors of readmissions. 29 Other authors have identified as predictors of readmission male gender, 30 White ethnicity,27,31 low socioeconomic status, 32 single marital status, 33 psychiatric comorbidity, 34 behavioral problems, 32 diagnosis, 30 severity of illness, 35 nutritional status, 36 and comorbidity. 37
Using a large national database, our analysis examined associations between readmission rate and risk factors for common vascular surgical procedures. We also created a risk score to predict unplanned readmission in vascular patients, which incorporates preoperative comorbidities. Higher hospital volume was consistently related to higher readmission rate, in contrast with previous studies. 24 In addition, surgeons with lower annual patient volume and longer length of stay were both associated with higher readmission rates. Emergency surgery and urgent surgery was associated with more readmissions, while elective surgery was associated with no readmission. Procedures involving the aorta were also related to readmission. Although our study is not the first to examine the association between readmission and risk factors in vascular procedures, and to develop a method for calculating readmission risk, and others have reported hospital readmission as a measure of quality of health, 37 it is the first study to consider 90-day readmission data and to use machine learning methods to achieve precise results. In contrast with traditional statistical analysis focused on risk factors for groups of patients, machine learning enables predictions to be made for individual patients. This prediction takes into account all the interacting factors that make this patient unique: age, gender, comorbidities, elective admission, race, length of stay, and any other features that might be associated with outcomes.
Trust is crucial for effective human interaction with machine learning systems, and explaining individual predictions is important for building trust. 17 The LIME Graphs presented for each patient evaluation (Figure 5) are created by an algorithm that can explain the predictions of any classifier or regressor in a faithful way, by approximating it locally with an interpretable model. 17 The user can therefore easily understand the most effective variable to be modified for each patient. The graph provides a great deal of detailed information about each variable selected. 38
Important variables for the predicting model were length of stay, comorbidity scores, endarterectomy procedure, and elective admission type. Of all readmissions, the proportion of those judged preventable on retrospective chart audits varied in the range of 9% to 50%. 37 Ashton et al. 39 showed that as many as 55% of readmissions could be due to potentially modifiable care. Focusing on readmission of inpatients with specific conditions may lead to identification of unmet clinical, educational, and psychosocial needs. 37 Hospitals with similar readmission rates may differ in how resources are used during hospitalization. Intensity of care is known to differ between teaching and non-teaching hospitals.24,40 It is also important to consider the use of home healthcare services, which has also increased dramatically in recent years. 24 However, it is not known whether use of home healthcare services varies by hospital or procedure.
This study focused on medium-term readmission and has three key strengths. First, we used a novel statistical method which provides an estimate for a specific patient; second, the large database used provides an excellent and profound core for machine learning and algorithm creation; and, third, it is widely available and readily applicable, with a visually understandable graphic result.
Our study has inherent limitations, because of its inbuilt retrospective nature. There is a lack of specific vascular-related variables in the database and it is limited to one geographical location. The database did not differentiate planned reinterventions, such as in hybrid treatments, 41 and theoretically unplanned readmissions are the most preventable type. 26 Machine learning is often seen as a “black box” problem, meaning that it is not apparent which specific factor led to the specific prediction. Hence, a patient with a particular group of clinical characteristics might be more likely to have a complication, but the machine learning model will not tell you which attributes of that specific patient were responsible for that prediction. This is why we developed the LIME graph which displays the main factors contributing toward hospital readmission. In addition to data availability issues, we are fully aware of the fact that publicly available administrative data can be quite noisy, having coding errors and entry inconsistencies. 42 Machine learning will only be meaningful if clinicians and patients focus on modifiable risk factors. The workflow to achieve this goal using the model provided is (1) the clinician uses patient data to simulate both a prediction related to a given outcome, for example, a postoperative complication, and to detect factors that might be increasing or mitigating risk. (2) The physician–patient relationship can be improved by constructing a plan to act upon any modifiable risk factors with simulations in real time. It is possible to create hypothetical scenarios in which we reduce risk factors or enhance protective factors and then use the model to compare risk levels with and without these interventions. 37
Studying readmission causes and developing tools for prevention enables readmission rates to be reduced after implementation of predischarge reviews and improved follow-up care after discharge. 37 Given the current focus on readmissions and increasing pressure to prevent unplanned readmissions, this score stratifies patients by readmission risk, helping direct resources toward those at greatest risk.
Conclusion
This study identifies risk factors for readmission after selected vascular procedures and provides a simple predictive risk score that accurately identifies patients at high risk for readmission. The model stratifies readmission risk on the basis of vascular procedure type, which suggests that attempts to decrease vascular readmission should focus on emergency procedures.
Footnotes
Declaration of conflicting interests
The author(s) declared no potential conflicts of interest with respect to the research, authorship, and/or publication of this article.
Ethical approval
The research protocol for this study was reviewed and approved by the Institutional Review Board (number 00112018).
Funding
The author(s) received no financial support for the research, authorship, and/or publication of this article.
Informed consent
Written informed consent was obtained from legally authorized representatives before the study.