
Abstract
Purpose:
The traditional approach and the Stewart approach have been developed for evaluating acid–base phenomena. While some experts have suggested that the two approaches are essentially identical, clinical researches have still been conducted on the superiority of one approach over the other one. In this review, we summarize the concepts of each approach and investigate the reasons of the discrepancy, based on current evidence from the literature search.
Methods:
In the literature search, we completed a database search and reviewed articles comparing the Stewart approach with the traditional, bicarbonate-centered approach to November 2016.
Results:
Our literature review included 17 relevant articles, 5 of which compared their diagnostic abilities, 9 articles compared their prognostic performances, and 3 articles compared both diagnostic abilities and prognostic performances. These articles show a discrepancy over the abilities to detect acid–base disturbances and to predict patients’ outcomes. There are many limitations that could yield this discrepancy, including differences in calculation of the variables, technological differences or errors in measuring variables, incongruences of reference value, normal range of the variables, differences in studied populations, and confounders of prognostic strength such as lactate.
Conclusion:
In conclusion, despite the proposed equivalence between the traditional approach and the Stewart approach, our literature search shows inconsistent results on the comparison between the two approaches for diagnostic and prognostic performance. We found crucial limitations in those studies, which could lead to the reasons of the discrepancy.
Introduction
Originally, Henderson 1 recognized that carbon dioxide and bicarbonate were key elements of carbonate mass action. Hasselbalch 2 developed it into the negative logarithmic pH notation. Henderson–Hasselbalch equation considers bicarbonate one of the strongest buffers and determinants of pH in our physiologic system. In order to separate metabolic and respiratory components in acid–base disorders, the concept of base excess (BE) was first introduced by Siggaard-Andersen et al. 3 and became the head of the Copenhagen school. On the other hand, exploiting the flaw of using in vitro concept of BE in a living organism, Schwartz and Relman 4 developed the bicarbonate-centered approach setting out the relationship between partial pressure of carbon dioxide (pCO2) and bicarbonate ion (HCO3–) in vivo, which became the center of the Boston school. The difference of the two approaches for metabolic components generated the “great trans-Atlantic acid-base debate” between the Boston school and the Copenhagen school. 5
In the late 1900s, Peter Stewart questioned the bicarbonate-centered approach and the base excess method for acid-base phenomenon.6–8 In his concept, each variable is classified as a dependent or independent factor in determining the H+ concentration of a solution, resulting in pH through the dissociation of water, in order to maintain electrical neutrality.9,10 Although both the BE approach and the Stewart approach were developed in physio-chemical terms, the Stewart approach is sometimes called “physicochemical,” “modern,” or strong ion approach.6,7 In contrast, the bicarbonate-centered approach and the base excess approach are called “traditional approach.” 11 Currently, most of the modern blood gas analyzers report both HCO3− and BE for many clinicians to use the traditional approach.
Since then, both the traditional and the Stewart approaches have been relevant subjects for clinical and research discussions. While some experts have suggested that the two approaches are essentially identical,12,13 clinical researches have still been conducted and discussed which approach has a better performance as a diagnostic or prognostic tool. In this review, we summarize the concepts of each approach and investigate the reasons of this discrepancy, based on current evidence from the literature search, despite the proposed identity.
The traditional approach
Bicarbonate-centered (“Boston”) approach
In the early 1900s, an acid was defined as a substance that is capable of donating hydrogen to a solution, and a base was defined as a substance capable of accepting hydrogen from a solution. Henderson 2 first recognized that bicarbonate is a unique and important buffer, which has the ability to bind or release hydrogen ions in a solution to keep the pH relatively constant, in a physiologic system at constant pCO2. Henderson–Hasselbalch equation provides a simple relationship among the respiratory parameter (pCO2), the non-respiratory parameter bicarbonate (HCO3–), and the overall acidity parameter (pH). 14
Based on the equation, Schwartz and Relman 4 developed the CO2/HCO3– approach predicting the nature of acid–base disorders. Although it is relatively easy to understand and to apply in clinical settings, there are some weaknesses we need to consider. Since there are non-bicarbonate buffers such as albumin and hemoglobin, a change in bicarbonate concentration does not always reflect the total amount of non-respiratory acids or bases. 15 Furthermore, the equation listing pCO2 and bicarbonate as determinants of pH can mislead their interdependence.
BE and standard BE (“Copenhagen”) approach
In 1948, Singer and Hastings 16 introduced the concept of the buffer base, which is the sum of all plasma buffer anions and is composed of bicarbonate ion and non-volatile, weak acid buffers (mainly albumin and phosphate). It is shown that a change in a buffer base corresponds to a change in the metabolic component of acid–base balance and develops into the BE methodology.17,18
In 1960, Siggaard-Andersen et al.3,19 measured the plasma bicarbonate concentration at a fixed temperature and partial pCO2 and compared the difference between their results and a reference value. When corrected by a constant, this difference yields the BE, which represents the amount of acid or alkali that must be added to 1 L of oxygenated blood, exposed in vitro to a pCO2 of 40 mmHg to achieve the average normal pH of 7.40.19,20
Blood BE measures the metabolic component that is independent from the respiratory component and incorporates the effect of hemoglobin as a buffer.19,20 The most commonly used formula for calculating the BE is the Van Slyke equation, developed by Siggaard-Andersen 19
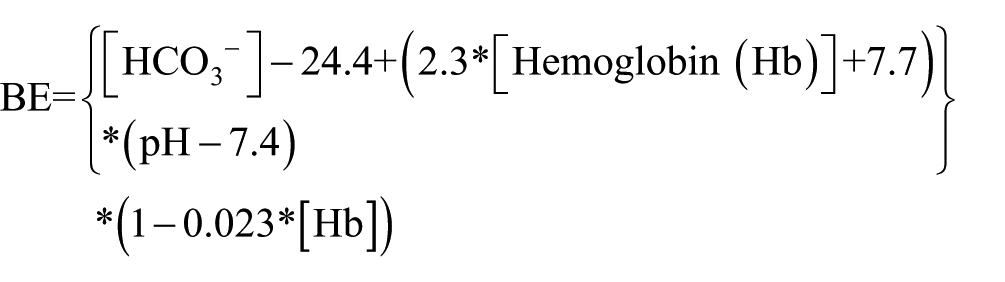
The BE equation suffers from inaccuracy in vivo with changes in pCO2, possibly due to equilibration across the entire extracellular fluid space, which is composed of whole blood and interstitial fluid.7,21,22 Therefore, the equation was modified to “Standardize” the effect of hemoglobin on CO2 titration in order to improve the accuracy in vivo 7

However, the standard base excess (SBE) is still slightly subject to pCO2 change. 7 Furthermore, this equation assumes normal non-buffer ion levels; however, a decrease in albumin or phosphate, which is commonly encountered in intensive care unit (ICU), results in more unstable SBE.7,8 In addition, the BE and SBE methods are unable to detect complicated acid–base disorders or identify different types of metabolic acidosis.
Anion gap
The anion gap (AG), the difference between unmeasured plasma anions and the unmeasured plasma cations, 8 is an additional diagnostic tool to assess the metabolic components of the acid–base equilibrium. Albumin and phosphate, one of the circulatory proteins, mainly account for the AG under normal conditions. The rest of the possible candidates are composed of urate, lactate, ketone bodies, sulfate, salicylates, penicillins, citrate, pyruvate, and acetate.23,24
This additional diagnostic tool provides new insight to the traditional approach, classifying metabolic acidosis into normal AG acidosis and high AG acidosis. However, severe pH disturbances and changes in the concentration of serum albumin, which behaves as an anion, have a significant impact on the AG.25,26 Those disadvantages lower the sensitivity and specificity of this diagnostic tool to detect metabolic acidosis.
A noticeable attempt to improve the practical AG was the introduction of the corrected anion gap (AGc). The most popular AGc is “albumin-corrected” AG. For each 10 g/L decrement in the serum albumin concentration, the AG is expected to decrease by 2.5 mmol/L and needs to be corrected to compensate for abnormality of serum albumin concentration. 8 However, this AGc attributes a fixed negative charge to albumin, taking no consideration for pH effects on the imidazole groups of albumin. 7 In addition, this AGc ignores the phosphate contribution to all of the weak acids that might need to be considered.27–29
Stewart approach
Concept of the Stewart approach
Stewart9,10 questioned the traditional approach for acid–base equilibrium evaluation. He modeled a solution that contained a complex mixture of ions of constant charge over the physiological pH range (strong ions), non-volatile proton donor/acceptors which transfer H + within the physiological pH range (weak acid/base), and the volatile bicarbonate–CO2 buffer system. 8 Key aspect of Stewart’s concept was the classification of each variable as dependent or independent in determining the H+ concentration of the solution. In his theory, there are three responsible variables to independently determine the dissociation of water, and consequently the hydrogen ion concentration, in order to maintain electrical neutrality: (1) strong ion difference (SID), (2) total concentration of weak acids (ATOT), and (3) partial pCO2 of the solution.8,30 Thus, in the Stewart’s approach, metabolic disorders are the results of changes in SID or ATOT.7,31
Apparent SID and effective SID
Apparent SID (SIDa) represents the difference between measured strong cations and strong anions. 7 With the development of devices capable of detecting “unmeasured” ions (which we could not measure routinely), current calculation of the SIDa contains the following ions 7

where Na denotes sodium, K denotes potassium, Ca denotes calcium, Mg denotes magnesium, and Cl denotes chloride.
On the other hand, SID calculated to account for electrical neutrality is viewed as the effective SID (SIDe). 7 The SIDe can be calculated as the sum of bicarbonate and weak acids ([A–)), mainly albumin and phosphate 8

where Alb denotes albumin and Pi denotes inorganic phosphate
SIG
Although the law of electrical neutrality in the body requires SIDa and SIDe to be equal, failure to measure the concentration of all strong and weak ions in plasma yields a gap between the two. Thus, SIG, the difference of SIDa and SIDe, quantifies [unmeasured anions] – [unmeasured cations] of both strong and weak ions. 7
One of the theoretical advantages of SIG over AG is the pure representation of unmeasured ions. Although both AG and SIG represent unmeasured ions, the “unmeasured” ions derived from AG are composed of [Mg2+], [Ca2+], [A–] (mainly albumin and phosphate), [Lactate–], and [other ions] clinicians do not routinely measure, whereas the unmeasured ions expressed by the SIG are composed of just [other ions]. While normal AG ranges from 7 to 17 mEq/L when using [K+] for the calculation, SIG is close to zero in normal situations. 8 Although the albumin-corrected AG eliminates the effect of hypo/hyper albuminemia, the gap still persists.
ATOT
Consideration of ATOT alternations for acid–base disorders is another key aspect of this approach compared to the traditional one.7,31 ATOT, representing all non-bicarbonate buffers, is made up of mainly serum albumin and other minor charges such as phosphate and globulins.7,31 In the Stewart approach, an increase in ATOT would result in metabolic acidosis and a decrease would result in metabolic alkalosis. 7
There is a controversy over the existence of ATOT acidosis/alkalosis.32,33 Although observations in vitro show that alterations in albumin concentration can affect acidity, there is no credible demonstration that the living organism, especially the liver, regulates albumin to maintain acid–base homeostasis. 30 One of the explanations is that the theoretical slight weak acid loss secondary to hypoproteinemia is compensated for by a decrease in SID (adjusted SID) without changes in pH, HCO3–, and BE as commonly seen in ICU, rather than a complex acid–base disorder such as a mixed metabolic acidosis/hypoalbuminemic alkalosis.20,34,35
Although the traditional approach and the physicochemical approach originated from different concepts as mentioned above, their mathematical comparison showed very few differences once model coefficients are estimated in the consistent manner. 12 Representation of the bicarbonate buffers is almost identical, and representation of non-bicarbonate buffering in the van Slyke equation can be derived from the equations of Stewart. Representation of electrical neutrality comes from the preservation of charge equation described by Singer and Hastings. 16 For both approaches, measurement of plasma protein concentration is essential if unmeasured anions are to be distinguished from protein buffers. 12 However, many clinical researches have still been conducted on which method is more informative and useful in clinical situations, and there has been no consistent conclusion. In order to find the reasons of the consistency, we conducted a literature search focusing on two main comparisons: diagnostic and prognostic performance of those approaches.
Literature search
The PubMed Database was initially searched from inception to 15 November 2016 to compare the physicochemical approach with the traditional approach. The search was performed with the relevant medical subject heading terms and strategies: ((SID) OR (strong ion gap)) AND ((AG) OR (BE)). References of selected publications were individually inspected for additional articles that might have been omitted or overlooked in the electronic database search.
The inclusion criteria for the review were (a) studies using both approaches for the same population and (b) studies comparing the diagnostic and/or predictive abilities directly or indirectly. Studies using the traditional methods with AG but without AGc were excluded because non-corrected AG lacks consideration of abnormal albumin concentration commonly seen in the ICU, and many studies already have shown that the simple AG cannot detect acid–base disorders that the Stewart method can identify.36–39 Nonhuman studies, case reports, abstracts, and unpublished or any studies in which full text was not available were excluded.
Results
Our electrical literature search revealed 192 studies. One hundred and five nonhuman studies, case reports, abstracts, or otherwise irrelevant studies were excluded. Among 87 potentially relevant articles, we exclude 41 studies that did not compare the two approaches as for diagnostic and/or predictive performance and 29 studies that did not calculate corrected AG for the comparison. Thus, the remaining 17 articles were included in this review. Eight studies compared their diagnostic abilities and 12 articles compared their prognostic performances (Table 1).
Differences in studied population, measured ions, calculation of variables, and references among articles comparing the two approaches.

ICU: intensive care unit; AGc: corrected anion gap; BE: base excess; SBE: standard base excess; SID: strong ion difference; SIDe: effective strong ion difference; SIG: strong ion gap; SIGc: corrected strong ion gap; Mg: magnesium; Ca: calcium; Alb: albumin; Pi: inorganic phosphate; Lac: lactate; HCO3: bicarbonate; AUROC: area under receiver operating characteristic curve; ROC: receiver operating characteristic; N/A: not applicable; OR: odds ratio; CI: confidential interval; SD: standard deviation.
Inconsistent results on the superiority of one approach over the other approach
While 10 studies have shown the potential superiority of the Stewart approach,6,27–29,40,44,46,48–50 four articles failed to show the superiority of the physicochemical approach over the traditional one,33,41–43 and three articles even showed greater strength of the traditional method than the modern one.24,45,47
Discussion
Reasons for inconsistent results on diagnostic performance
Our literature search shows a discrepancy over the ability to detect acid–base disturbances on diagnostic performance of the two approaches. There are several possible explanations for the discordance. The first thing to be mentioned is the calculation of each variable in both approaches. Table 1 shows there are many differences in inclusive ions, especially lactate, phosphate, and magnesium ion, of each calculation of AGc and SIG among the studies. In addition, cumulative differences or errors in each variable should be considered. As each mathematical equation contains more measurement, there could be greater variability in the parameters, such as SIDa, SIDe, and SIG in Stewart approach, because the differences are exaggerated via complicated mathematical calculations. 51 As shown by Matousek et al., 12 there should be no difference between the approaches from a mathematical perspective. However, it is true only when the same ions are measured and taken into account and each measurement is accurate. Those differences of each calculation and potential cumulative errors could lead to the discordance about the usefulness as a diagnostic tool between the two approaches.
Another potential reason is technological differences or errors in measuring each variable. Morimatsu et al. 52 showed that chloride measurements, made with point-of-care blood gas and electrolyte analyzers, differed significantly from those made using central laboratory biochemistry analyzers, resulting in different SID values and assessments of the acid–base status. Nguyen et al. 51 compared two central laboratory analyzers for electrolyte measurement and reported that the biochemistry laboratory analyzers have large differences from each other. It should be noted that 12 of 17 articles in our review measured electrolytes using central laboratory analyzers, many of which are currently using diluted blood sample and indirect ion selective electrodes in order to measure the electrolytes, rather than blood gas analyzers (Table 1). Measurements by this method are affected by hypoalbuminemia and could be inaccurate compared with the ones measured by blood gas analyzers. 53 Studies that used indirect ion selective electrodes could lead to wrong calculation and acid–base interpretation, which could make an implausible conclusion. Thus, interpretation of the results in papers comparing these approaches needs attention on the analyzer that each study used. We found a wide variety of machines and technologies used to measure pH, pCO2, and electrolytes in those articles, which could be one of the reasons for the inconsistent results on this topic.
Reference value of each parameter is another problem. The dependency on site recommends reference value should be determined in each institution. 46 However, our review showed that while only five studies collected healthy controls for the reference,33,40,46,49,50 other studies used pre-determined numbers,29,41,44,45,48 and the method for reference value selection in those studies was not specified.6,24,27,28,42,43 These incongruences of reference value due to arbitrary choice may cause a variety of discordant results. As there is no consensuses on the normal range of each variable, especially in the Stewart approach, we recommend that future researchers collect healthy controls for reference in each research institute.
We also need to pay attention to the differences in the normal result range between the two approaches in these studies, since more than one parameter in each method aims to represent the same concept. For example, Boniatti et al. defined normal SBE as −5 to +5 and normal SIDe as 38–42 mEq/L. Since changes in BE represent changes in SIDe if ATOT is normal, 8 the large difference of normal range (10 vs 4) could mislead the interpretation. This sort of “unfair” comparison might be one reason of the inconsistent results.
Studied populations need another consideration. Several studies showed that patients with renal failure, 54 liver diseases, 55 sepsis and trauma 56 often have accumulations of unmeasured anions. However, Dubin et al. 33 and Ho et al. 47 reported patient demographics in their studies; the percentage of patients with shock, acute renal failure, and hepatic failure was only 13%, 13%, and 4%, respectively, in one study, and liver diseases were only 2% in the other. A study by Cusack et al. 41 included a high proportion of post-elective surgery patients, who generally have low severity of illness and low mortality. Hucker et al. 43 did not provide details about reasons for admission, patients’ illness severity, or the underlying medical conditions of patients in their accident and emergency department. For patients with severe illness, measuring more ions and involving them into variables such as AG and SIG could demonstrate their potential ability to detect unmeasured anions, revealing more detailed acid–base disturbances, no matter which approach is used. For populations with a small number of severe patients, measuring more ions would not be needed for detailed analysis of acid–base disorders. Thus, the combination of variety of the studied populations and the aforementioned differences of calculation in each variable among those studies could be one of the reasons of their inconsistent results.
Reasons for inconsistent results on prognostic performance
Those factors as the potential reasons for inconsistent results on diagnostic performance could also yield a controversy about the prognostic performance of the two approaches. Some authors have investigated the predictive value of the traditional approach and the physicochemical Stewart approach, mainly, AGc versus SIG. One of their questions is “Is there any association between AGc or SIG and outcomes?” or “Can AGc or SIG levels be used as a marker of poor outcomes?” Here the difference of measured and involved ions in each calculation could again mislead the conclusion. Simple comparison of AGc with SIG does not always answer these particular questions. Although both parameters represent unmeasured ions, consideration of lactate for AGc and SIG depends on each individual study. A bulk of evidence has shown that the level of lactate is associated with poor prognosis.57,58 If we would like to simply compare the prognostic abilities of the two approaches, the contribution of lactate should be removed from their equations. Only five of all 17 articles remove the effect of lactate from their calculations of AGc and SIG.
It is not only lactate but also other ions, such as magnesium, that need to be considered when comparing the two methods. The changes in magnesium concentration are usually so small that they may usually be neglected, but this simplification is not applicable if the changes are significant. Theoretically, an increased level of magnesium reduces the AG, increases SID, and does not change SIG. There are no studies so far that compare these approaches for patients with abnormal serum magnesium concentrations. Thus, radical question of the comparison should not be “Is there any association between AGc or SIG and outcomes?” but “Is there any association between unmeasured anions that we does not measure in clinical practice and outcomes?” In order to answer this question directly, we need to exclude the contribution of lactate and other measured ion.
Finally, we cannot forget the effect of fluids used for resuscitation, which lead to iatrogenic acidosis. Hayhoe et al. 59 found 40% of acidosis were attributed to the use of polygeline, which acts as an acid resulting in increased unmeasured circulating anions. Similarly, gelatin-derived colloids have also been found to iatrogenically increase the SIG due to increased unmeasured anions. 59 None of the studies included in our review provided detailed information about the type and volume of administered resuscitation fluids. This iatrogenically fluid-induced increment of SIG and metabolic acidosis in less critical patients is not expected to have many adverse outcomes, and therefore, the prognostic value of these indices of the Stewart approach could be wrongly affected.
Conclusion
Although the traditional approach and the Stewart approach are seen as complementary giving the same information about the acid–base phenomena despite their different concepts, our literature search shows inconsistent results on the comparison between the traditional approach and the physicochemical approach for their diagnostic and prognostic performance. Many studies to date have crucial limitations in comparing these approaches. Those limitations are considered the reasons for the discrepancy in clinical researches.
Footnotes
Declaration of conflicting interests
The author(s) declared no potential conflicts of interest with respect to the research, authorship, and/or publication of this article.
Funding
The author(s) received no financial support for the research, authorship, and/or publication of this article.