
Abstract
Objectives:
Opioid prescribing in the United States has tripled since 1999. At the same time, there has been increasing attention to patient satisfaction. It has been suggested that providers concerned about patient satisfaction may be more likely to treat pain with opioids. We examined primary care providers’ opioid prescribing practices to determine if higher provider opioid prescribing was associated with higher patient satisfaction.
Methods:
For 77 primary care providers, we compared each provider’s opioid prescription count and amount prescribed to each provider’s patient panel satisfaction measures. Satisfaction measures were obtained from surveys following office visits and consisted of Likert-type scale answers concerning satisfaction for pain management and other provider satisfaction domains. Satisfaction surveys were generated independent of patient complaint of pain and had the aim of overall assessment of patient satisfaction with the provider and the healthcare system. We assessed the correlation between opioid prescribing and patient panel pain management satisfaction using linear regression models with and without adjustment for patient complexity.
Results:
We observed no statistically significant correlation between patient panel satisfaction with their provider and the quantity of opioids that the provider prescribed (R2 = 0.006; p = 0.52). There was also no correlation between patient panel satisfaction and the number of opioid prescriptions written by their provider (R2 = 0.005; p = 0.54). Additional multivariate analysis after adjusting for patient complexity also demonstrated no correlation of pain management satisfaction with opioids prescribed. Although the quantity of opioid prescriptions was not correlated with pain management satisfaction, several other patient satisfaction measures correlated significantly with pain management satisfaction.
Conclusion:
Primary care providers with a greater rate of opioid prescribing did not have higher patient panel satisfaction scores for pain management. In primary care, providers who want to improve patient satisfaction should focus on other components of patient care besides opioid-based pain management.
Keywords
Introduction
Patients are more frequently being asked to rate their satisfaction with their provider. This patient satisfaction information is increasingly being used as a measure of a provider’s job performance and is beginning to show up in provider compensation formulas. In some primary care practices, 2%–10% of compensation is based on patient satisfaction.1,2
Patient satisfaction may depend on providing patients what they want or expect, which is not always beneficial for the patient or society. A well-known example in primary care is that patients are often given antibiotics for upper respiratory infections when there is no convincing medical evidence or guidelines to indicate their effectiveness. 3 Some suggest that this is catering to patient expectations at the expense of antimicrobial stewardship. 4 The World Health Organization (WHO) notes that “antibiotic resistance is one of the biggest threats to global health, food security, and health today,” and states “misuse of antibiotics in humans and animals is accelerating the process.” 5
Patients also have expectations around pain and how it should be managed. 6 They are routinely asked to rate their pain level on a score of 0–10 or by comparing their pain to facial expression representations of pain. Numerous guidelines recommend that patient pain levels are addressed in some fashion and physicians and healthcare systems are monitored for adherence to these guidelines. For example, the Centers for Medicare & Medicaid Services (CMS) has pain management questions (3 of a total 32 questions) in their Hospital Consumer Assessment of Healthcare Providers and Systems (HCAHPS) patient survey.7,8 These survey questions about pain management prioritize achieving rapid and complete pain control to avoid poor pain management marks.
Opioids can be effective in controlling pain, but they have potential for addiction, increased healthcare utilization, 9 and overdose. According to the Centers for Disease Control and Prevention (CDC), there were approximately 15,000 deaths from overdoses involving prescription opioids in 2015. 10 Although opioid per capita prescribing declined from its peak of 782 morphine milligram equivalents (MME) to 640 MME from 2010 to 2015, the US per capita MME in 2015 was still three times higher than the 1999 level. 10 In 2014, almost 2 million Americans abused or were dependent on prescription opioids. 11
Many healthcare providers solicit feedback on patient satisfaction through third-party surveys, sent to randomly selected patients after office visits. We examined the relationship between primary care practice provider opioid prescribing practices and patient satisfaction ratings. Our aim was to determine whether there was a significant relationship between primary practice provider opioid prescribing practices and patient panel pain management satisfaction ratings.
Methods
Setting
This study took place in the primary care practice of Mayo Clinic, Rochester, Minnesota. We included family medicine and primary care internal medicine practitioners for this study. Mayo Clinic Primary Care Internal Medicine and Family Medicine have academic commitments and supervise residency programs. Internal medicine and family medicine residents were excluded from the study because their patient satisfaction data were collected differently and panel sizes were small.
The total number of adult patients in the primary care practices of internal medicine and family medicine was about 105,000. Of the 105,000 patients, approximately 1400 have been enrolled in a controlled substance agreement for opioids.
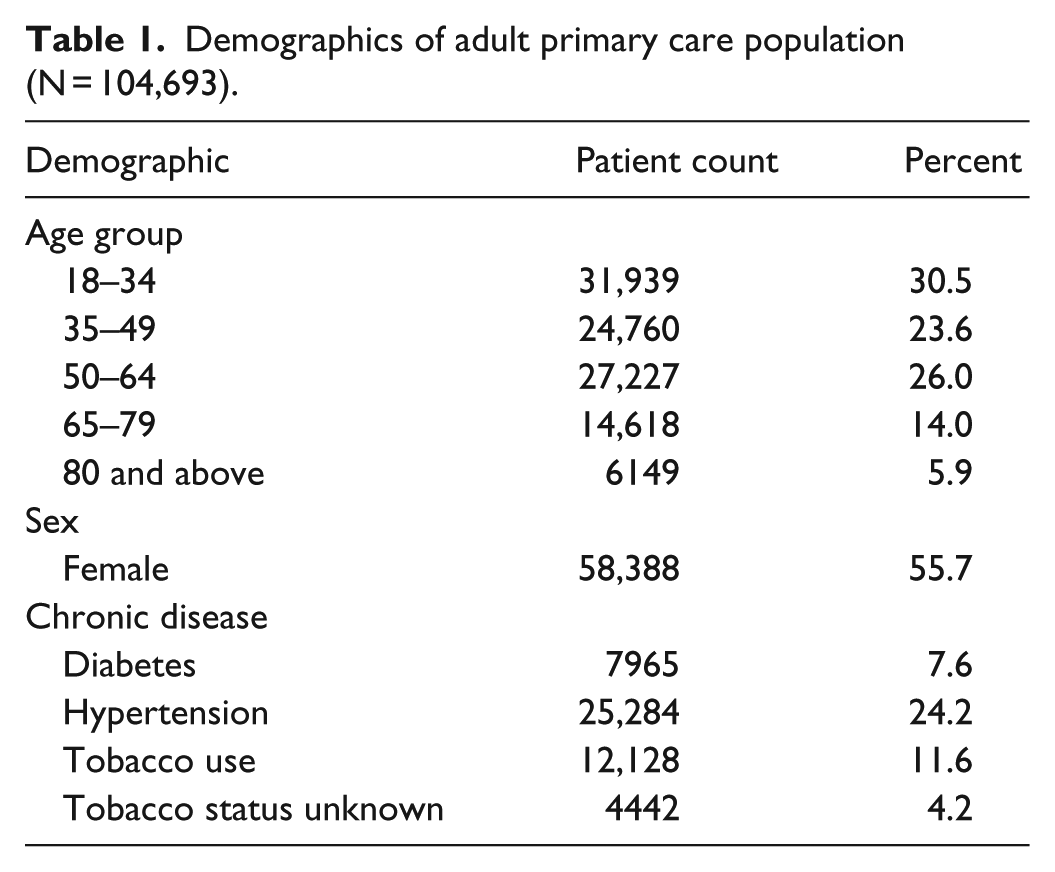
Patients are attributed to a specific provider. Provider panel size (number of attributed patients) is adjusted based on both the time that the provider spends in office practice and the complexity of the patients. Patients in this study were from the population described in Table 1. Over 90% of the primary care population self-identify their race as White.
Demographics of adult primary care population (N = 104,693).
Our sample of healthcare providers was limited to those who could prescribe opioids and included physicians, physician’s assistants (PAs), and nurse practitioners (NPs). Both PAs and NPs can independently prescribe opioids in the state of Minnesota (where the study took place). However, across the United States, there is some variability from state to state on the opioid prescribing authority of PAs and NPs. 12
Only those providers with a panel size greater than 200 patients and at least 30 satisfaction surveys over the 12-month study period were included in the analysis.
All physicians, PAs, and NPs are salaried. During and before the study, compensation of the physicians, PAs, and NPs was not adjusted based on patient satisfaction outcomes.
Opioid dispensing data
The Mayo Clinic electronic prescribing database captured the total opioids prescribed per provider and the count of opioid prescriptions by each provider over the course of 12 months. We used the federal drug enforcement agency (DEA) classification of schedule II narcotics to search the database for opioids. We were able to capture opioid prescribed units (e.g. tablets of oxycodone, milliliters of liquid morphine) rather than actual morphine equivalent doses, and we captured total opioid prescription counts for each provider. Since opioid prescriptions have to meet strict documentation requirements (cannot be called in to a pharmacy), and providers have no option to prescribe other than electronically, we were able to completely capture all the providers’ opioid prescriptions from our prescription database. Because no refills are allowed on these prescriptions, each prescription represents the potential total opioids dispensed. We did not have access to state, pharmacy, or patient information to know how much of these prescriptions were actually dispensed and subsequently used by the intended user. Opioid units were calculated by adding up quantities of pills and milliliters in the individual prescriptions. For example, a hypothetical patient who was prescribed 20 tablets of oxycodone in January, 2 mL of morphine in June, and no other opioids during the study time frame would have had 22 (20 tab + 2 mL) opioid units. The time frame of data collection was 12 months from July 2014 through June 2015.
Patient panel satisfaction data
All ambulatory patient visits were eligible to be randomly selected for a satisfaction survey. The aim of the survey was to assess satisfaction with the Mayo Clinic healthcare system for opportunities in quality improvement. Mayo Clinic used a third-party Avatar Solutions, to collect patient satisfaction data for the duration of the study. Confidentiality of patient responses was assured and responses were delivered to us aggregated into groups of patients corresponding to the individual providers’ panels. It should be emphasized that we had no access to individual patient survey responses. The satisfaction data for our analysis were from accumulated satisfaction surveys from individual patients, but grouped by provider panels. Also, it was not possible to ascertain the percent of the respondents whose office visit with the provider concerned pain or an opioid prescription.
Patient satisfaction survey questions were not specifically designed to evaluate pain management exclusively; a number of components surrounding patient satisfaction with the primary care provider were collected. In the overall group of six questions about provider satisfaction, the particular question of interest for this study was “I was satisfied with the way my provider treated my pain.” This pain management satisfaction question and other satisfaction questions were answered on a 5-point Likert-type scale. The possible Likert-type responses were “strongly disagree, disagree, neutral, agree, strongly agree.” We calculated two different pain management satisfaction measures based on the single pain management survey question. For one measure, we calculated the proportion of surveyed individuals in the individual provider’s panel who responded “strongly agree” (the “top box”) to the pain management question. Theoretically, this could range from 0% (no patient surveyed in the provider’s panel checked the top box for pain management satisfaction) to 100% (every patient surveyed in the provider’s panel checked the top box for pain management satisfaction). We also calculated the pain management question mean score, which was the average of the weighted responses, with 100 representing strongly agree, 75 for agree, 50 for neutral, 25 for disagree, and 0 for strongly disagree. The mean score could potentially range from 0 to 100. Table 2 shows the survey question set for satisfaction with the provider. Validity of the patient survey has been independently assessed and found to have suitable properties. 13 We set the threshold of minimum patient surveys per provider at 30 based on white paper information from Press Ganey. 14
Avatar Medical Practice Survey© questions (5-point Likert-type scale, strongly agree to strongly disagree). a

Avatar copyrighted survey instrument used under the auspices of a contract with Avatar—now Press Ganey. Permission to reproduce survey questions obtained from Press Ganey.
As noted, there were six questions on the survey concerning patient satisfaction with the provider. We also examined the other five questions listed in Table 2. These five questions attempted to examine patient perceptions concerning provider empathy, engagement, shared decision making, communication, and provider attention. In addition to looking for an association of patient panel pain management satisfaction with provider opioid prescribing, we examined the association of patient panel pain management satisfaction with patient panel satisfaction from the other five survey question domains. We examined the correlation between provider panel pain management and the other five provider satisfaction domains to see what provider factors other than opioid prescriptions may be associated with pain management satisfaction.
The patient satisfaction survey was a printed form, mailed 3 weeks following the office visit. Satisfaction data was obtained for a similar 12-month time frame as the opioid prescribing data and was June 2014 through May 2015. The survey completion rates were provided by the third-party survey administrative staff and categorized by practice type (family medicine or primary care internal medicine).
Panel data
We obtained panel sizes (patient counts) and complexity scores for each provider. We used the CMS hierarchical condition category (HCC) endorsed measurement for patient risk and complexity. 15 The HCC is a complexity score based on age and comorbid conditions for individual patients. An individual HCC risk-adjusted score is determined for each patient based on previous billing codes that are collapsed to 187 categories. The HCC is intended to risk-profile healthcare plans so that plans with enrolled beneficiaries having higher expected risk would be paid more compared to plans with lower expected risk. 16 The validity of the HCC has been independently evaluated, 16 it is not copyrighted, and instructions for calculating the HCC can be obtained on the CMS.gov website. 17 As a reference for those unfamiliar with HCC scores, here are some examples: (1) 50-year-old without major medical issues has an HCC score of 0.18; (2) 57-year-old patient with a stable renal transplant has an HCC score of 0.67; (3) 73-year-old with atrial fibrillation, a cerebrovascular infarction, and anticoagulant use has an HCC score of 1.27; and (4) 85-year-old with prior history of pancreatic cancer, colon cancer, and a major artery stent has an HCC score of 3.75. 18
Populations can be risk-adjusted by calculating the mean HCC score from all the individuals in the population. We examined each panel of primary care provider’s patients as subpopulations within the entire primary care practice. Since all primary care providers have an assigned group of patients (their panel), a mean HCC risk score of their panel of patients can be calculated and assigned to each provider. A provider panel HCC complexity score was the mean of the individual patient HCC scores within the provider’s panel.
Appointment data and demographics
From the Mayo Clinic Scheduling System database, we collected the total number of completed face-to-face visits from June 2014 through May 2015 to match the time frame for the opioid prescription counts. Demographic data were captured in an Amalga dataset (Microsoft Corp., Redmond, WA).
Adjusting opioid prescribing units by panel size and complexity
To adjust individual providers’ opioid prescribing quantities, we divided the opioid units and prescription counts by patient panel size. Previous work at Mayo Clinic shows that there is a significant correlation between opioid prescribing and HCC panel complexity score. 18 Based on that finding, we incorporated HCC scores in a multivariate model to adjust for patient panel complexity.
Satisfaction survey and face-to-face visits
Satisfaction surveys were randomly obtained from patients only after face-to-face visits. We could determine the likelihood of a returned survey after a visit by the ratio of surveys completed to face-to-face visits. For example, a provider with 30 surveys returned after 300 visits would have a 10% chance of a survey per face-to-face visit. Using face-to-face visit counts for each provider for the same 12 months of the surveys, we calculated the likelihood of each provider being surveyed after face-to-face visits.
Statistical analysis
We used JMP 13.0 (SAS Corp., Cary, NC) for the descriptive statistics and the univariate and multivariate linear regression analysis.
Results
Study flow and response rates
The study flow is indicated in Figure 1. Of the initial 124 providers with satisfaction data, 77 providers had complete opioid prescribing data, HCC scores, more than 200 patients in their panels, and 30 or more patient satisfaction responses. These 77 provider panels accounted for 73,674 of the 104,693 patients (70% of the primary care practice).
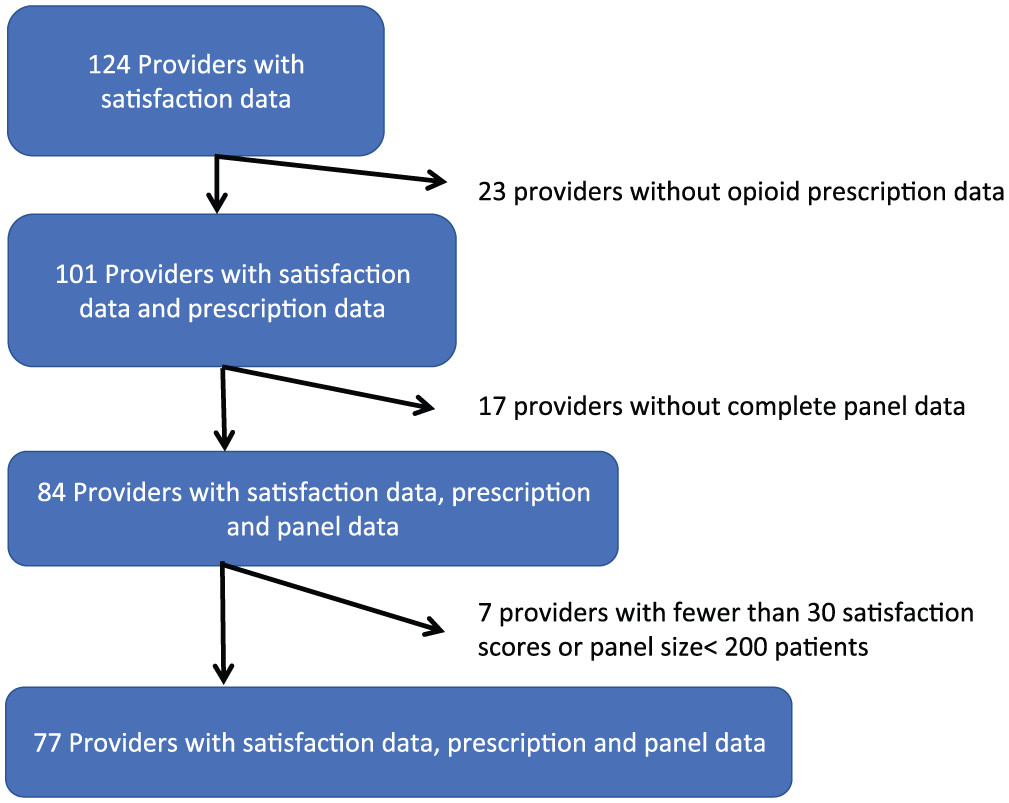
Study flow for providers included in analysis.
Of the 77 providers, 38 were physicians in primary care internal medicine and 29 were physicians in family medicine. There were seven NPs and three PAs. The satisfaction survey response rate was higher for the primary care internal medicine practice (44%) than for family medicine (26%). Provider panel size ranged from 228 to 2029 patients with a median of 866 (mean, 957; standard deviation (SD), 438).
Panel complexity
Overall panel complexity as measured by an average of individual patient HCC scores varied widely by provider but were clustered into two groups (Figure 2). The bimodal histogram of panel complexity was due to family medicine physicians, NPs, and PAs generally having younger patients with fewer comorbidities (lower HCC scores). Family medicine physician panels had a mean HCC of 0.30 (range, 0.25–0.39); NP and PA panels had a mean HCC of 0.28 (range, 0.23–0.37). The upper distribution of HCC scores in Figure 2 was exclusively from internal medicine physician panels that had a mean panel HCC score of 0.64 (range, 0.51–0.82).

Histogram of provider panel complexity (N = 77).
Opioid counts and prescriptions
Total opioid units (pills or mL) prescribed by providers ranged from 910 to 39,093. There was a median of 7518 opioid units prescribed per provider (mean, 10,787; SD, 8930). Oxycodone accounted for 51.3% of the opioid units with another 23% from hydromorphone, representing 74% of the opioids prescribed among the providers studied. Providers prescribed a range of 77–9030 opioid units per 100 patients (median, 915; mean, 1550; SD, 1640). Even after accounting for provider panel size, there was still a wide range of variability among providers in their opioid units prescribed (Figure 3).

Histogram of provider opioid units prescribed per 100 patients (N = 77).
The total number of opioid prescriptions written during the 12 months by each provider ranged from a low of 19 opioid prescriptions to 322. The median for opioid prescriptions by provider was 111 with mean of 127 (SD, 83). For the 12 months’ duration, providers had a range of 1.5–64 prescriptions per 100 paneled patients with a median of 11 and a mean of 17 opioid prescriptions per 100 patients (SD, 15).
Patient survey responses
After excluding providers with fewer than 30 patient responses to the pain management question, the remaining providers had a median of 67 responses to the pain question (range, 30–124; mean, 69.1; SD, 17.1). The histogram of survey response counts to the pain management question is shown in Figure 4. The other five survey questions about the same providers had significantly higher response rates; the total pain management question responses from the 77 providers totaled only 5320 from an expected 6756 based on the other five responses. Thus, patients were answering the pain question about 79% as frequently as other questions (addressed in section “Discussion”).
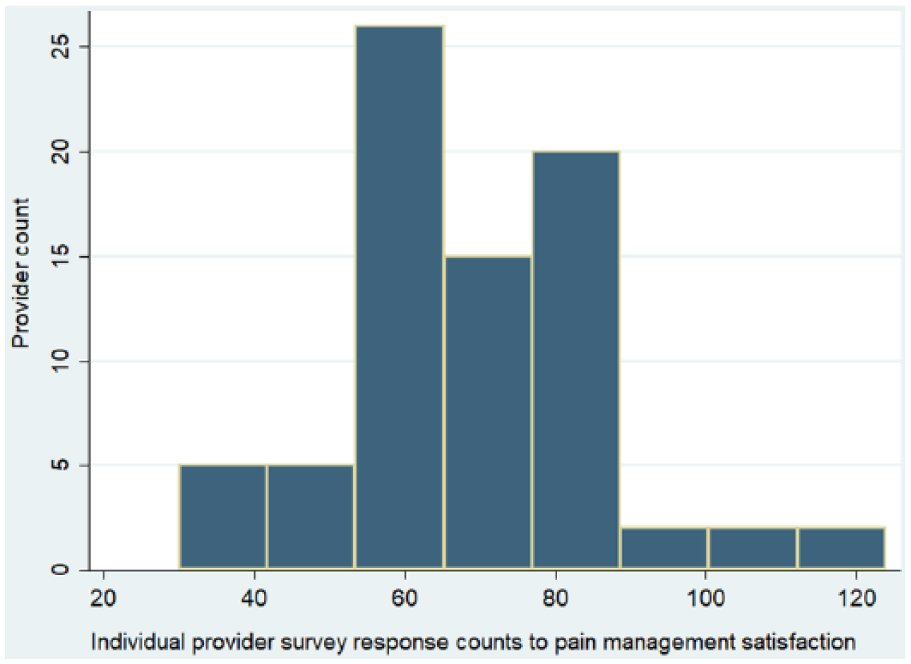
Histogram of provider survey response counts (N = 77).
Providers varied in the percent of their surveyed patients who gave them the “top box” ranking (“strongly agree” in the 5-point Likert-type scale) for pain management satisfaction with a median of 85% for the “top box” with a range of 66%–97%.
Mean pain satisfaction, which used all five components of the Likert-type scale, had a higher ceiling with a median score of 93.4 out of a perfect 100 and a range of 81.7–99.3. The mean of the individual providers’ pain satisfaction scores was 93.1 (SD, 3.3).
Association of opioid measures with satisfaction
The linear regression line of pain management satisfaction versus opioid units per 100 patients is shown in Figure 5 scatterplot.
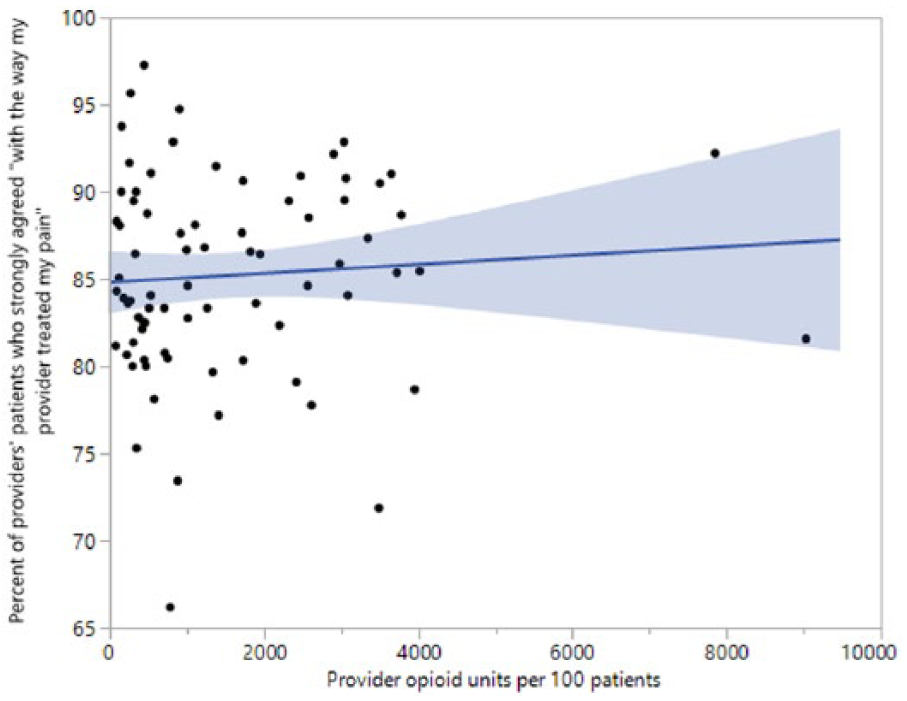
Provider pain satisfaction by opioid units prescribed (CI 95% shading).
Figure 6 shows the linear regression line and scatterplot of pain management satisfaction versus opioid prescriptions per 100 patients.

Provider pain satisfaction of opioid prescriptions (CI 95% shading).
Univariate analysis of the two measures of pain management satisfaction with the two measures of opioid prescribing is shown in Table 3. There was no significant association between either measure of pain-related patient satisfaction and opioid quantity or prescription counts.
Univariate and multivariate linear regression models of opioid units and prescription counts on pain satisfaction.

CI: confidence interval.
Multivariate model is adjusted by panel complexity (as measured by hierarchical condition category).
Percent patients who strongly agree with “I was satisfied with the way my provider treated my pain” (top box).
Mean score for pain satisfaction using all 5-point Likert-type responses, range is 0–100.
Since patient complexity could be a potential confounder, 18 we also constructed multivariable regression models. Table 3 has the results of multivariable models that show no significant association between pain management satisfaction and opioid units or number of opioid prescriptions when adjusted for panel patient complexity (HCC).
We also tested for associations between pain management satisfaction and panel complexity after excluding four influential scatterplot points. These four scatterplot points represented four outlying providers: two with very low satisfaction scores and two with very high opioid prescribing. Univariate and multivariate analyses (adjusted for HCC) after excluding the four influential data points still revealed no significant association.
Association of pain management satisfaction to other provider satisfaction responses
Although we could find no statistically significant association between pain management satisfaction and opioid prescribing, there were strong associations between pain management satisfaction and other domains of satisfaction (Table 4).
Correlation between provider panel pain management scores and other satisfaction domains in satisfaction survey (N = 77).

Ho: correlation coefficient equals zero.
In the group of six survey questions about satisfaction with the provider (pain management and five others), the pain management measure correlated significantly with the five other provider satisfaction measures.
Office visits and likelihood of individual patients being surveyed
Counts of 12 months of office visits also varied significantly between providers. Concurrent with the 12 months of opioid prescribing data and satisfaction data, face-to-face office visit counts by providers ranged from 314 to 2181 (median, 980; mean, 1060, SD, 435). For the 77 providers, the likelihood of a face-to-face visit resulting in a survey response ranged from 2.9% to 18.8% (median, 7.1%; mean, 7.7%). Thus, on average, about one out of every 14 patient visits resulted in a returned survey containing a pain management response.
Discussion
We observed no significant association between the quantity of opioids prescribed or opioid prescription count and satisfaction with pain management, even when adjusting for patient complexity. However, we did observe a significant association between patient satisfaction with pain management and other perceptions about the provider, including perceptions around provider concern, sensitivity, and attention.
Despite the wide variation in the quantity of opioids prescribed, even accounting for patient complexity, we did not observe significantly lower patient satisfaction for providers prescribing fewer opioids or a significantly greater satisfaction for those prescribing more opioids. Rather, differences in pain management satisfaction scores were associated with other overall perceptions of the provider. This is an important point for primary care providers concerned about their satisfaction scores. Our study showed that a provider’s patient satisfaction with pain treatment was more dependent on attributes such as showing concern and sensitivity or attention to the patient rather than on the number of opioid units prescribed or the number of opioid prescriptions.
Our results should not be interpreted as indicating that individual patients will be satisfied even if they do not receive opioid prescriptions to treat their pain. In certain care settings such as the emergency department, where pain is one of the most common reasons for presentation, 19 patient satisfaction is associated with pain management. 20 In primary care, however, visits more frequently concern the management of chronic diseases such as diabetes or hypertension; pain may not be a primary focus. Since our patient satisfaction surveys were not specific for patients with pain, our findings could be explained by a few dissatisfied patients being diluted by a much larger number of pain-free patients who answered the survey.
Patients also only answered the pain question 79% of the time compared to the other provider-specific questions (p < 0.001), suggesting that pain may not have been a primary concern or presenting complaint. However, since “not applicable” was not a choice in the Likert-type design, it is certainly possible there may also have been instances when patients answered the pain management question even when there was no pain related to the visit. This potential effect of a patient answering satisfied with pain management even without current pain could also dilute those truly dissatisfied with their pain management.
Recent major journal articles about patient satisfaction and opioid prescribing6,21–23 may be prompting providers to consider how their pain medication prescribing practices affect patient satisfaction. In one of these articles, Lembke 21 observed that doctors who refuse to prescribe opioids for patients who have opioid use disorder (OUD) are likely to get poor ratings from those patients, and poor patient survey ratings can affect compensation and job security for those doctors. Jerant et al. 23 found that patients who had requests for pain medication denied by providers rated their visit satisfaction 11% lower than in visits where providers fulfilled the pain medication request. Our findings are not inconsistent with these studies. In primary care, a few disappointed patients with OUD or a few denied pain medication requests may not comprise a large enough group to affect all-patient survey results.
In our study, the frequency of a patient being surveyed was about 1 in 14. Rates of opioid prescriptions in our primary care practice compared to visit counts were also low. Face-to-face visits during the study outnumbered opioid prescription counts by 7 to 1, so the chance of an office visit concerning an opioid was not high. So in an all-patient survey like ours, there may be dissatisfied individuals from a perceived lack of opioids for pain management, but their collective voice may not be great enough to rise above the “noise” of satisfaction variability.
An important result of our study is that provider factors other than the numbers of opioid units or prescriptions had stronger correlations with pain management satisfaction. Provider factors such as giving clear explanations, demonstrating concern and sensitivity, and paying sufficient attention to patients correlated significantly with pain management satisfaction. Presson et al. have also demonstrated high inter-item correlation between different survey questions about provider satisfaction. The Presson study used very similar Press Ganey questions to those in our study, and they found inter-item survey pairwise correlations of 0.69–0.91 for patient satisfaction with their provider. 13 Although the patient satisfaction questions in the Presson study were very similar to five questions in our study, a pain management question was not included in the Presson study.
The significant correlation of pain management satisfaction with other provider satisfaction measures should be examined further. If this pain management measure contributes little additional value to the overall satisfaction measure due to collinearity with other satisfaction measures, perhaps it should not be asked. Given providers’ concerns about patient satisfaction, a pain management question in a patient satisfaction survey may be indirectly encouraging opioid prescribing without providing much additional value.
A strength of the study is that we used satisfaction data from a third-party source who assured the responders anonymity to encourage open responses. This third-party patient satisfaction data is also used in annual reviews of clinic staff, so it is exactly the type of data that could influence prescribing even though it is not directly tied to compensation. Thus, the patient satisfaction measures used in this study represent real-life data that healthcare systems may use as a job performance measure.
There are a number of limitations to this study. The patients surveyed were from a single primary care practice without a focus solely on pain. Due to anonymity required for the patient satisfaction survey, we did not know which or how many patients surveyed actually had pain or received an opioid prescription. The findings might be different if the only patients sampled for the satisfaction survey were those presenting specifically with a pain complaint or a request for opioids. However, this study is not intended to generalize to all practices or patients. Our primary care practice is likely representative of other primary care practices that manage a wide variety of medical conditions with pain management comprising a fraction of the office visits. Also, over half of our providers had “top box” proportions greater than 85%. The limited spread of satisfaction scores makes it more difficult to demonstrate associations with independent variables. Practices with a wider range of satisfaction scores would be less susceptible to this “ceiling” effect and may have a different result.
Another limitation is that opioid units are not a precise measure. We were unable to translate the “opioid units” into a morphine equivalent dose. However, we did capture prescription counts and also found no association with opioid prescription counts and satisfaction. Another limitation is the use of the HCC score which was designed for practices with older patients. However, the HCC score has been shown to be a significant explanatory variable for opioid prescribing. 18 Also, providers do not always prescribe exclusively for their own patients. This might change the inter-provider prescribing variation as an individual provider with low opioid unit prescribing practice patterns might occasionally prescribe for a patient with high use in another provider’s panel. Although we do not have the data for a sensitivity analysis of this possible effect, it is likely to be low since prescribers are generally wary of prescribing a large amount of opioids for patients not in their own panel. Finally, we were unable to ascertain opioid prescription “fill rates” and how much of the prescription was actually used by the patient; some of this medication could be diverted. It is difficult to know how medication diversion, lack of medication use, or unfilled prescriptions would impact results of a patient satisfaction survey.
More research is needed concerning opioid prescribing and its relationship to satisfaction scores. Providers are very concerned about their satisfaction scores and this concern likely drives some decisions about prescriptions. Zgierska et al. 24 found that 20% of providers felt their employment was threatened by patient satisfaction data, and almost half believed that pressure to obtain better scores promoted inappropriate care, including unnecessary antibiotic and opioid prescriptions, tests, procedures, and hospital admissions. In a recent study by Ebbert et al., 25 12% of clinicians reported that concern about patient satisfaction influenced decisions to prescribe opioids. Additional studies with different patient demographics, different pain prevalence, different provider types, and different provider reimbursement structures are needed to give a more complete view on the relationship between primary care patient satisfaction and opioid prescribing.
Conclusion
We observed no significant correlation between individual provider patient panel pain management satisfaction scores and their total opiod prescriptions or opioid units prescribed. However, we found a significant correlation between pain management satisfaction and other provider factors such as provider communication, provider attention, and provider engagement and empathy.
Footnotes
Acknowledgements
S.M.T.-S. and F.N. contributed to study concept; F.N., S.J.C., and S.M.T.-S. contributed to study design; F.N. contributed to data analysis and statistics and drafting the manuscript; F.N., S.J.C., S.M.T.-S., and J.O.E. contributed to final approval of the manuscript.
Declaration of conflicting interests
The author(s) declared no potential conflicts of interest with respect to the research, authorship, and/or publication of this article.
Ethical approval
Ethical approval for this study was obtained from the Mayo Clinic Institutional Review Board (IRB 15-0005148).
Funding
The author(s) disclosed receipt of the following financial support for the research, authorship, and/or publication of this article: This work was supported by Mayo Clinic.
Informed consent
Written informed consent was waived by the Mayo Clinic Institutional Review Board.