
Abstract
Objective:
Opioids are being prescribed at increasing rates in primary care practices, and among individual providers there is significant variability in opioid prescribing. Primary care practices also vary significantly in complexity of their patients, ranging from healthy patients to those with multiple comorbidities. Our objective was to examine individual primary care providers for an association between their opioid prescribing and the complexity/risk of their panel of patients (a panel of patients is a group of patients whose medical care is the responsibility of a specific healthcare provider or care team).
Methods:
We retrospectively examined 12 months of opioid prescription data from a primary care practice. We obtained counts of opioids prescribed by providers in the Mayo Clinic, Rochester, Minnesota primary care practice. For patients paneled (assigned) to family medicine and internal medicine, we used the Centers for Medicare and Medicaid Services hierarchical condition category patient risk score as a measure of patient complexity. After adjusting the opioid counts for panel patient count (to get opioid counts per patient), we used linear regression analysis to determine the correlation between the hierarchical condition category risk and the amount of opioid prescribed by individual providers.
Results:
Among our combined 103 primary care providers, opioid unit counts prescribed per patient were highly correlated with the providers’ hierarchical condition category panel risk score (r2 = 0.54). After excluding three outliers, r2 was 0.74. With and without the outliers, the correlation was very significant (p < 0.0001). Subgroup analysis of panels with hierarchical condition category ⩽ 0.45 showed no correlation of opioid prescribing volume with hierarchical condition category (r2 < 0.02; p = 0.32). Provider panels with hierarchical condition category > 0.45 showed significant correlation with hierarchical condition category (r2 = 0.26; p = 0.001).
Conclusion:
When examining differences in primary care providers’ opioid prescribing practices, the Centers for Medicare and Medicaid Services endorsed risk score (the hierarchical condition category score) can help adjust for population differences of a provider’s patients.
Keywords
Introduction
Overall, the amount of prescription painkillers dispensed in the United States has quadrupled since 1999. 1 Some have called this an opioid epidemic. 2 Deaths from prescription painkillers have also quadrupled since 1999, killing over 16,000 people in the United States in 2013, but fortunately this increasing trend has recently leveled off. 1 Of all the opioid prescriptions dispensed in the United States, primary care providers are responsible for nearly half. 3 Despite some leveling off of opioid prescribing generally, primary care providers have continued to prescribe opioids at a rate higher than several other specialties. 3 Non-physician prescribers are also now accounting for more than 11% of opioid prescriptions. 3
In the United States, many states have taken notice of this increase in opioid prescriptions. The state of Indiana created an emergency rule in 2013 which mandated a required minimum frequency of urine drug testing and face-to-face visits when prescribing opioids for chronic pain. 4 Washington State has also enacted legislation to mandate care surrounding chronic non-cancer pain.5,6 Now, almost all states either have or are in the process of planning provider searchable web-based databases for monitoring opioid prescriptions. 7 Indiana requires their physicians prescribing opioids for chronic pain to access its database, INSPECT, at least once yearly for those patients meeting certain criteria (non-terminal, non-palliative care, etc.). 4 In the state of Minnesota, there is a similar web-based service available to prescribers to monitor patients receiving controlled substances. 8 These state-sponsored databases serve to collect prescription information about controlled substance users so that patients who are getting controlled substances from multiple sources can be detected. 9
There are wide variations in opioid prescribing practices across specialties.
3
For example, a palliative care specialist might be prescribing a large amount of opioids to deal with end-of-life issues, while a primary care provider with younger and healthier patients might use opioids only for acute pain issues. Primary care itself encompasses a wide range of practices that include providers trained in internal medicine having primarily geriatric and complex patients and family medicine providers with younger and generally healthier patients. In the United States, family medicine specialists undergo several years of postgraduate training which includes the care of patients of all ages. Although some family medicine specialists perform surgical and obstetrical procedures, these procedures are generally not major. Specialists in internal medicine (internists) also have had several years of postgraduate training, but the training is restricted to adult medical conditions so that internists’ patients are generally over age 17 years. Both family medicine specialists and internists may have hospital privileges and can be involved in medical care of patients during a hospitalization. Family medicine and internal medicine trained physicians often refer to their overall group of patients as a patient panel. The US Agency for Healthcare Research and Quality defines a panel as follows:
A panel is a list of patients assigned to each care team in the practice. The care team (e.g., a physician, a medical assistant, and a health educator) is responsible for preventive care, disease management, and acute care for all the patients on its panel. This means that a patient will have the opportunity to receive care from the same clinician and his or her care team.
10
As noted above, patient panels in family medicine tend to be younger and healthier than patient panels in internal medicine.
In the United States, physicians have the academic degrees of MD or DO (Doctor of Osteopathy), but opioid prescribing is not just limited to physicians. There are nurses who have advanced training in medical practice (nurse practitioner (NP) and physician assistants (PAs)) who also can prescribe opioids, depending on individual state and federal requirements. There is little in the literature describing differences in opioid prescribing across primary care providers, but given the panel differences across internists and family medicine providers it is likely that there are differences in opioid prescribing.
With electronic records and electronic prescribing, identifying differences in opioid prescribing is not that difficult. For those practices with electronic prescribing, it is a straightforward query to the prescribing database for the number of opioid prescriptions and counts of opioid tablets, capsules, or patches by individual providers. However, explaining the variability among providers in opioid prescribing may not be that easy. To explain some of the variation in opioid prescribing, we examined how differences in the providers’ panel populations could be associated with differences in opioid prescribing.
A widely available tool for looking at differences in panel populations is the Centers for Medicare and Medicaid Services (CMS) hierarchical condition category (HCC) score. CMS developed HCCs to measure patient complexity differences between practices. The HCC is a risk adjustment model implemented in 2004 and used to adjust Medicare capitation payments to Medicare Advantage healthcare plans. The HCC is intended to risk profile healthcare plans so that plans with enrolled beneficiaries having expected higher risk would be paid more compared to plans with expected lower risk. 11 By design, higher HCC risk scores correlate with higher expected expenditures based on age and comorbidities present. As a reference for those unfamiliar with HCC scores, here are some examples: (1) 50-year-old without major medical issues has an HCC score of 0.18; (2) 57-year-old patient with a stable renal transplant has an HCC score of 0.67; (3) 73-year-old with atrial fibrillation, a cerebrovascular infarction, and anticoagulant use has an HCC score of 1.27; and (4) 85-year-old with prior 5-year history of pancreatic cancer, colon cancer, and major artery stent has an HCC score of 3.75. Because risk of expenditures positively correlates with the HCC score, institutions participating in the Medicare Advantage healthcare plan get additional compensation for taking on patients with higher HCC scores.
Although substance abuse (with opioid abuse included in the category) is one of the CMS HCCs, there is no category encompassing chronic non-cancer pain or low back pain. The HCC uses International Classification of Diseases, Ninth Revision (ICD-9) codes from billing to generate the 187 HCCs that generate the individual HCC score for the patient. Using the HCC criteria, practices can aggregate the HCC scores to give each provider a risk adjustment for their panel.
Our objective in this study was to see whether the HCC could help explain variability in opioid prescribing practices in a primary care practice.
Methods
Setting
The study took place in the primary care practice of Mayo Clinic, Rochester, Minnesota. The primary care practice has a panel of about 144,000 patients, 107,000 of whom are over age 18 years. There were over 200 primary care providers who prescribed opioids within the timeframe of the study which extended from the beginning of July 2014 through the end of June 2015. Patients in the Mayo Clinic primary care practice are assigned to primary care practice providers from pediatrics, family medicine, or internal medicine, depending on age and other conditions. We limited this study to providers in the Family Medicine and Internal Medicine practices. Family Medicine and Primary Care Internal Medicine have residents in training, NPs and PAs who all have assigned patient panels. Resident physicians, NPs, and PAs were included in the study along with staff MDs and DOs. Each provider panel has an associated HCC score which is the mean HCC of the patients in each provider’s panel. Because the internal medicine training program has significant inpatient commitments, the residents’ panels generally number fewer than 200 patients each.
The mean and median ages of patients in the 78,766 patient family medicine panel are 35.7 (standard deviation (SD): 20.7) and 34 years, respectively. The mean and median ages of patients in the 41,158 patient primary care internal medicine panel are 55.6 (SD: 18.5) and 56 years, respectively.
Opioids studied
The following medications were considered opioids for the purposes of the study: codeine, fentanyl, hydrocodone, hydromorphone, meperidine, methadone, morphine, opium, oxycodone, oxymorphone, and tapentadol. We limited this study to prescribed opioids in the Federal Drug Enforcement Agency (DEA) schedule II classification, so this did not include codeine preparations with acetaminophen which are in DEA schedule III.
Opioid prescriptions and counts of units prescribed
We examined opioid prescribing over a 12-month interval from July 2014 through June 2015. From the electronic prescription ordering database, we collected opioid prescription counts, the type of opioid, and the number of pills, patches, or milliliters of opioid prescribed. From this, we calculated the cumulative number of pills, patches, or milliliters of opioid to get the total opioid units prescribed. Opioid units were based on the pharmacy unit of dispensation to the patient. For example, a hypothetical patient who was prescribed 20 tablets of oxycodone in January, 10 ml of morphine in March and 5 patches of fentanyl in June, and no opioid prescriptions for the rest of the year would have had 35 (20 tab + 10 ml + 5 patches) opioid units prescribed in that year.
All prescriptions including opioids are generated through the electronic prescription ordering system. Because we studied only DEA schedule II drugs, no refills are allowed so the counts represented the maximum possible amount of opioid attainable from each fill.
Opioid counts were taken at the level of the provider. If a patient went to a hospital emergency department (ED) and was prescribed additional opioids by an ED specialist, then that was not captured by our data. We could not exclude cases where the providers were writing prescriptions for their absent colleague’s patients. (e.g. when a provider was on vacation). We adjusted the opioid counts for panel size by dividing by the absolute number of patients in the panel and multiplying by 1000 to get the opioid count per 1000 panel.
HCC and panel counts
The HCCs were determined by algorithms provided by the CMS. 12 An individual HCC risk adjusted score is determined for each patient based on previous billing codes that are rolled up to 187 categories. Populations can be risk adjusted by calculating the mean HCC score from all the individuals in the population. We examined each panel of primary care provider’s patients as subpopulations within the entire primary care practice. Since all primary care providers have an assigned group of patients (their panel), a mean HCC risk score of their panel of patients can be calculated and assigned to each provider.
Provider selection
Controlled substance prescribing data (as noted above) were obtained for all primary care providers staffing the family medicine and primary care internal medicine practices. This was matched with all providers who had panel and HCC data. Providers who had panel sizes fewer than 200 patients were excluded. The flow for provider selection is shown in Figure 1. Figure 1 shows that there were three outlier providers who were excluded from the final analysis as noted in Results. Figure 1 also shows the flow involved in sample selection for scatterplots of Figures 2–5.
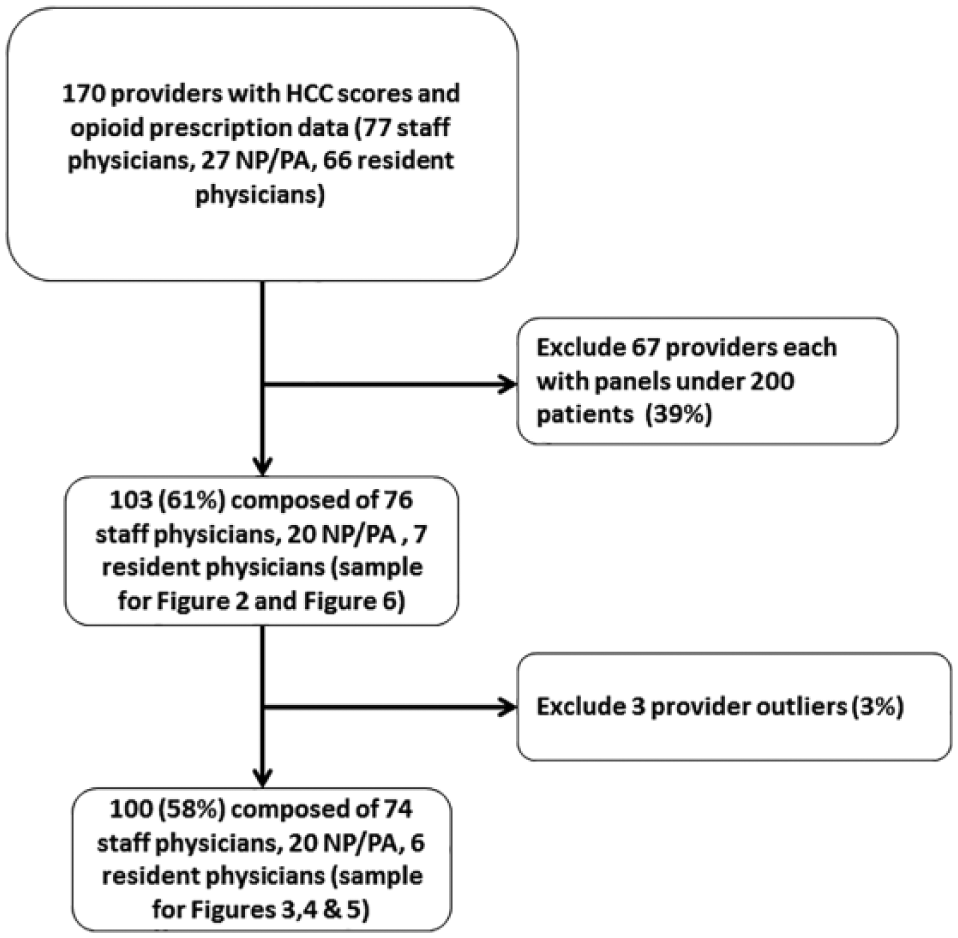
Provider selection flow.

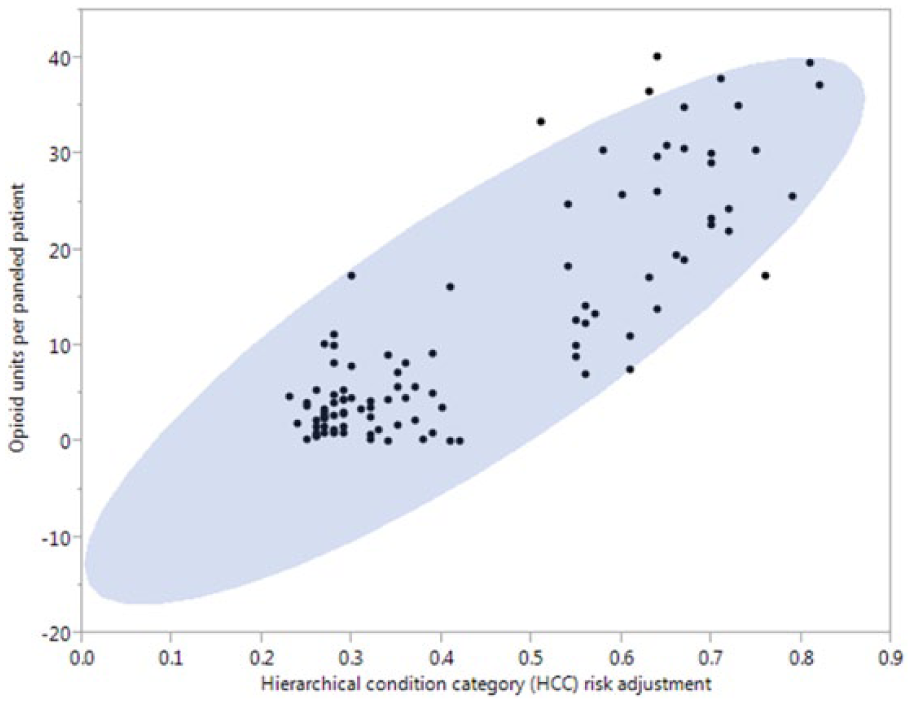
Scatterplot of 103 provider panels: opioid units prescribed per paneled patient by hierarchical condition category risk score (95% confidence ellipse).
Scatterplot of 100 provider panels (excluding three influential outliers)—opioid units prescribed per paneled patient by hierarchical condition category risk score (95% confidence ellipse).

Scatterplot of 100 provider panels (excluding three influential outliers) using nonlinear best fit curve (lambda = 0.3)—opioid units prescribed per paneled patient by hierarchical condition category risk score.

Linear regression line for 100 provider panels with 95% confidence envelope—opioid units prescribed per paneled patient by hierarchical condition category risk score.
Statistical analysis
JMP 11.0 (SAS, Cary, NC, USA) was used for the analysis. We used univariate linear regression to determine the correlation coefficients and the slopes of the least square fitted lines.
Results
The total number of opioid units prescribed per provider in 12 months in the group of 103 providers ranged from 0 to 39,093. The average number of opioid units each provider prescribed was 9193 with a median of 9755 and a SD of 8775. The number of patients in each provider panel ranged from 228 patients to 2029 patients with an average of 934 and a median of 817. Mean opioid units per 1000 patients was 13,217 (median: 7060; range: 0–90,284).
Figure 2 shows the scatterplot of each provider’s mean opioid units prescribed per patient by the providers’ HCC panel risk score. The 95% confidence ellipse shows three outlying influential points. R2 was 0.52 (p < 0.0001) for the entire 103 provider sample. Figure 3 shows the similar ellipse without the three influential points. Figure 4 shows the nonlinear best fitted spline for the 100 providers (the 103 minus the outliers) and Figure 5 shows the univariate linear regression with a 95% confidence interval for the slope. For the group of 100 (the three outliers excluded), the slope was 56,000 (CI 95%: 49,000–63,000) opioid units per thousand patient panel per HCC risk score. For the 100 providers (three outliers excluded), there was a significant correlation of opioid units prescribed to panel HCC risk score (r2 = 0.72; p < 0.0001).
Of the 100 providers used in additional analysis, there were two apparent groups noted in the scatterplot. A histogram of HCC scores illustrates how the HCC scores separated into two groups at a dividing point of 0.45 (Figure 6). There was a group of 62 providers with HCC risk ⩽ 0.45 and then another group (38) with HCC risks > 0.45. The family medicine providers (36 staff physicians, 13 NPPAs, and 6 resident physicians) accounted for 89% (55) of providers having the HCC risk score of 0.45 or below. The other 11% (7) of the group with HCC panel risk less than 0.45 were internal medicine NP/PAs. All 38 providers who had panel HCC scores greater than 0.45 were staff internists.
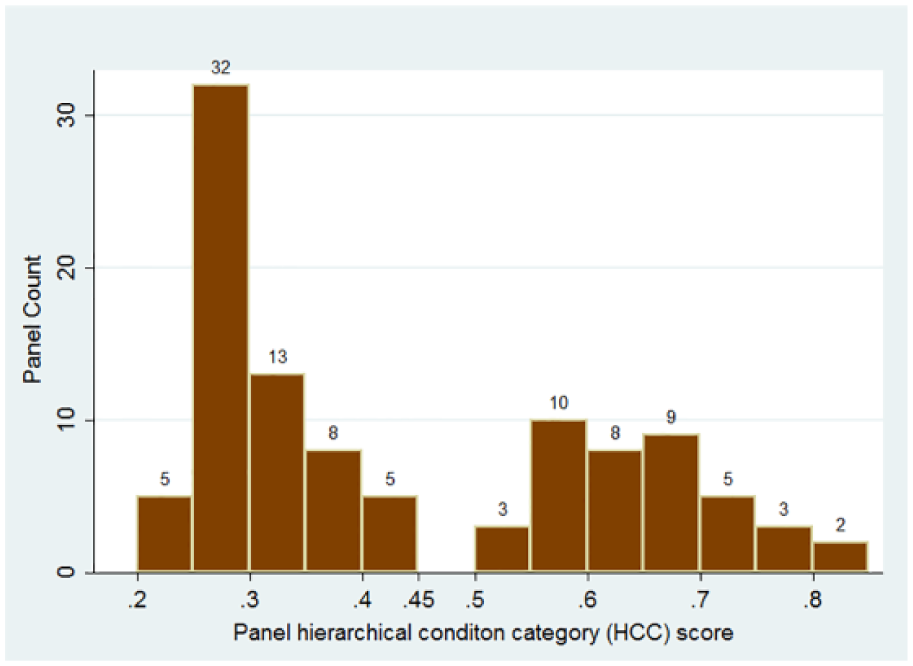
Histogram of provider panel mean HCC scores.
Subgrouping of the 100 providers by HCC of 0.45 showed that the group of providers with HCC panel risks below 0.45 (n = 62) had no significant correlation of opioid units prescribed per 1000 panel patients (r2 < 0.02, slope = 9566 opioids per 1000 panel/HCC; CI 95%: -9500–29,000, p = 0.32). For the group 0.45 or greater (n = 38), there was significant correlation of opioid prescribing with the HCC panel risk (r2 = 0.26, p = 0.001). The slope for the HCC ⩾ 0.45 group was 61,846 opioids per 1000 patient/HCC (CI 95%: 27,000–97,000).
Discussion
We found a strong correlation between a risk-adjusted measure, the CMS endorsed HCC risk score, and opioid prescribing. This is of more than just theoretical interest. With the increase in computerized prescribing, more and more practices will have the ability to access opioid prescribing practices for each provider. In addition, with the government endorsement of the HCC as a risk adjustment, this particular measure will become increasingly commonplace.
For healthcare institutions interested in examining their providers’ opioid prescribing patterns, the HCC and use of total opioids prescribed can be a way to monitor variations in prescribing patterns. As some significant outliers were discovered in our study, other practices may also have outliers worthy of further exploration. Providers with readily explainable reasons for higher opioid prescriptions would be those with a palliative care or addiction practice, or those caring for post-operative patients in the skilled care setting. Examining provider opioid prescribing practices by adjusting for patient risk may help practices identify providers who would benefit from consultation with experts in pain or narcotic addiction. Looking at outliers may be a way to identify potential problem prescribing behaviors. For our practice, adjusting opioid prescribing by the HCC risk removed enough of the variability to adequately highlight the outliers.
Our results showed some differences in opioid prescribing practices for those providers with a HCC panel risk less than 0.45, but at this risk level we did not find a significant association between the opioid volume and the HCC risk level. However, for providers with HCC panel risk scores > 0.45, there was a strong correlation with the volume of opioids prescribed. Practices composed solely of providers with low HCC risk panels may not get much if any benefit from adjusting opioid prescribing by HCC. In our practice, only the primary care internists had panels with an HCC risk greater than 0.45 except for a single internal medicine resident (panel HCC = 0.43) who was one of the three excluded outliers. As a tool for examining variability of primary care prescribing practices, adjustment of opioid prescribing practices by the HCC might best be suited for practices with a higher prevalence of complex panels as is seen in internal medicine.
Examining the overall volume of opioid prescribing (opioid units) adds another dimension to quality measures of opioid prescription practices. The use of the percent of patients on opioid agreements, urine drug testing, and numbers of early refills are additional ways of examining opioid prescribing practices.13,14 However, those particular measures address systems involved in opioid prescribing but do not necessarily help identify higher volume prescribers. We know that close to 80% of surveyed primary care providers feel pressured to prescribe something for pain. 15 By examining providers’ adjusted opioid prescribing volumes, it will enable practice leaders to provide individual feedback about opioid prescribing. This could empower some providers to look for alternative means for pain control, reducing the overall volumes of narcotic prescribing.
To our knowledge, this is the first study to analyze the variation of opioid prescribing practices by a CMS endorsed risk adjustment, the HCC. The availability of electronic prescribing to capture prescribing practices and the CMS endorsement of HCC as a complexity measure makes the HCC adjustment generalizable to a large number of primary care practices. For those practices desiring to identify higher prescribers of opioids, the risk adjustment appears to be necessary. Our study shows that over 70% of the variation in opioid prescribing in a primary care panel could be attributed to the HCC panel complexity.
Although we found a large amount of the opioid prescribing variability was associated with HCC scores, there are other factors involved in differences in prescribing. Our intent was to look at numbers that were easily obtainable in a practice to make this generalizable. A more precise and comparable measure of the opioid use is the morphine equivalent dose. However, calculating a morphine equivalent dose involves obtaining actual doses of each pill, patch, or milliliter and then multiplying the dose times the unit count times a morphine equivalent conversion factor. Using the current information in electronic prescribing, total opioid unit counts are simple to obtain; the effort to get a morphine equivalent dose requires additional steps. The HCC risk adjustment based on just a count of opioid units appears to be effective in identifying outliers as we have shown. Using this method over time could also be used to spot trends as well.
The strength of this study is that we used measures for opioids that are readily obtainable from electronic prescribing databases. The HCC has been adopted by the CMS as a risk adjustment tool and is standardized by them and accessible to all practices. It is based on billing codes that are essentially universal in the United States. If practices are not already doing HCC adjusted risks on their individual patients and panels they will probably be doing so in the near future. Another strength of this study is our diversity in provider representation (residents, NPs, PAs, Family Medicine and Internal Medicine) and panel composition.
This study has limitations. The HCC score may have limited utility in a panel with both adult and pediatric patients. We selected providers with patient panels in the outpatient setting. We do have some providers who work almost exclusively in nursing homes and other advanced care settings. These providers are likely to have significantly different opioid prescribing patterns. They also have rather small panels that are not very stable due to death and transfers among these facilities. We also noted that one of the influential outlying providers was a board-certified addiction specialist working within our practice. Having that particular provider identified as an outlier served fortuitously as a test case for the utility of this approach.
This study can serve as a benchmark for others to examine their own primary care provider opioid prescribing variability. Our study shows that trying to explain opioid prescribing variability without panel and risk adjustment will likely result in inaccurate inferences. For practices that want to ensure safe opioid prescribing practices by their primary care providers, this study shows the practical way of adjusting by panel complexity to give a more equitable comparison between providers. Our study shows that adjustments by panel count and HCC risk adjustment may be sufficient to give a good idea of who has an outlying prescribing practice.
Conclusion
The CMS HCC risk score can be used to adjust for practice variability in count of opioid units prescribed. Practices with electronic prescribing should be able to get the total opioid pill, patch, and milliliter counts prescribed by their individual providers. By adjusting for the provider’s panel risk/complexity, practices can get a better idea of providers who might need additional attention for higher volume opioid prescribing.
Footnotes
Author contribution
F.N. and S.C. contributed to study conception and design; F.N. contributed to statistical analysis and drafted the article; and F.N., S.M.T.-S., and S.C. reviewed and approved the final manuscript.
Declaration of conflicting interests
The author(s) declared no potential conflicts of interest with respect to the research, authorship, and/or publication of this article.
Ethical approval
Ethical approval for this study was obtained from the Mayo Clinic Institutional Review Board (IRB 15-0005148).
Funding
The author(s) received no financial support for the research, authorship, and/or publication of this article.