
Abstract
Background:
Only few data are available on the influence of CYP2B6 and CYP3A4/A5 polymorphisms on nevirapine plasma concentrations in the Caucasian population. Our aim was to assess the impact of CYP2B6 and CYP3A4/A5 polymorphisms on nevirapine plasma concentrations consecutively collected.
Methods:
We retrospectively analyzed clinical data of all HIV-positive patients who were followed at the Infectious Diseases Unit, DIBIC Luigi Sacco, University of Milan between January 2000 and December 2015. All patients with at least one nevirapine plasma trough concentration (NVP Cmin) determination were tested for CYP2B6 c.516 G>T, CYP3A4*22C>T and CYP3A5*3 A>G polymorphisms. Univariate and multivariate regression analyses were carried out considering NVP Cmin as the dependent variable and genetic polymorphisms and clinical characteristics as independent variables.
Results:
A total of 143 patients were evaluated. Most of them were males (61.5%) and Caucasian (92.3%). Overall, NVP Cmin varied from 1571 to 14,189 ng/mL (median = 5063 ng/mL, interquartile range = 3915–6854). The median NVP Cmin significantly differed in patients with different CYP2B6 genotypes, but did not vary in those with different CYP3A phenotypes. In the final general linear model, factors significantly associated with a higher NVP Cmin were each extra unit of T alleles of CYP2B6 rs3745274 (β = 0.328, 95% confidence interval = 0.172–0.484; p < 0.0001), older age (β = 0.362, 95% confidence interval = 0.193–0.532; p < 0.0001) and hepatitis C virus coinfection (β = 0.161, 95% confidence interval = 0.006–0.315; p < 0.041).
Conclusion:
Our study, conducted in a prevalent Caucasian population, highlighted the importance of CYP2B6 genetic variants in influencing nevirapine plasma trough concentration. Furthermore, older age and hepatitis C virus coinfection significantly increase exposure to nevirapine.
Introduction
Nevirapine (NVP), the first non-nucleoside reverse-transcriptase inhibitor introduced in clinical practice, is still included in antiretroviral regimens used in low-income countries due to its efficacy, including its use in prevention of mother to child transmission (PMTCT), good tolerability and relatively low cost. 1 In high-income countries, NVP is no more included among preferred antiretroviral regimens, but it remains a valid option in simplification strategy of selected patients due to its favorable metabolic profile.2,3
Early onset of skin rash and hepatotoxicity, which may be severe in nature, and a low genetic barrier to resistance are the principal factors that limited NVP use. 4 NVP is mainly metabolized by cytochrome P 450 2B6 (CYP2B6) and, to a lesser degree, by CYP3A isoforms. 5 Single-nucleotide polymorphisms (SNPs) in the genes encoding these enzymes have been shown to influence NVP pharmacokinetics in different ethnic populations.6,7 Furthermore, CYP3A5 is more commonly expressed in African populations and may affect NVP exposure. 8 An association between CYP2B6 polymorphisms, body weight and NVP plasma concentration has also been observed in patients followed in European countries. 9
The availability of pharmacogenetic testing opens the possibility of therapy personalization in HIV patients. The pharmacogenetic information can help to ensure the right dose for the single patient but also broader therapeutic strategies in different ethnic groups, according to the prevalence of SNPs. By now, only few data are available on the effect of CYP2B6 and CYP3A4 and CYP3A5 polymorphisms on NVP plasma concentrations in the Caucasian population.
Our aim was to assess the impact of CYP2B6 and CYP3A4/A5 polymorphisms on NVP plasma concentrations in a prevalent Caucasian population.
Methods
Clinical data of all HIV-positive patients who were followed at the Infectious Diseases Unit, DIBIC Luigi Sacco, University of Milan between January 2000 and December 2015 were retrospectively analyzed. All patients with at least one NVP plasma trough (Cmin) determination were included in the analysis. The first NVP Cmin sample was collected in 2011. Patients must be on a stable NVP-based regimen at a daily dose of 400 mg once a day and must have optimal adherence to antiretroviral therapies verified through direct questioning during every outpatient visits. Data on self-reporting adherence to antiretroviral drugs were also matched with data from our Pharmacy Department in order to verify antiretroviral drug refill, which would cover the time between two visits.
Subjects <18 years of age and those who had received NVP concomitantly with rifampicin or azoles were excluded from the study. Patients who did not reach the steady state for NVP trough concentration were excluded from the analysis. Patients’ demographic and clinical data at the time of NVP plasma trough (Cmin) determination included gender, age, ethnicity, hepatitis C virus (HCV) and hepatitis B virus (HBV) coinfection, HIV-RNA, backbone antiretrovirals, aspartate aminotransferase (AST) and alanine aminotransferase (ALT) levels.
For the pharmacokinetic analyses, blood trough samples drawn into ethylenediaminetetraacetic acid (EDTA)-containing vacutainers® were collected from all subjects close to the next NVP intake (a time window of ±30 min was directly verified by the nurse staff and considered as acceptable). NVP plasma concentrations were measured by high-performance liquid chromatography with photodiode array (PDA) detection. 10 NVP plasma concentration were classified as <3000 ng/mL (below therapeutic range), 3000–6000 ng/mL (therapeutic range) and >6000 ng/mL (above therapeutic range). This cut-off point was established accordingly to the steady-state trough concentration achieved in the pharmacokinetic curve, as previously reported.11,12
All patients were tested for CYP2B6 c.516 G>T rs3745274 (wild type: GG; variants: GT and TT), CYP3A4*22C>T rs35599367 and CYP3A5*3 A>G rs776746 polymorphisms. Genomic DNA was isolated from peripheral blood cells using an automatic DNA extraction system (Maxwell® 16 System; Promega) following the manufacturer’s instructions. The genotypes were determined by real-time polymerase chain reaction (PCR), using a panel of LightSNiP from TIB-MOLBIOL (assays based on SimpleProbe®). At the end of the amplification, a melting curve analysis was carried out (LightCycler 480; Roche).
Statistical analysis
The sample size calculation was based on the primary end-point, that is, NVP concentrations in patients with GG and GT/TT genotypes of CYP2B6 rs3745274. After assuming an approximate standard deviation in the first group of 1400 ng/mL, in the second group of 2400 ng/mL and a ratio between the two samples of 1, at least 62 patients were required for each group to evidence a minimal difference of 1000 ng/mL between the mean of the two groups. This sample estimate gave our analysis a power of 80% and a significant level of 5%. 13 Sample size had been calculated with the τ test.
NVP concentration in patients with different genotypes was compared by Kruskal–Wallis Test. For patients with multiple NVP concentration determinations, the first available value was considered. CYP2B6 c.516 G>T rs3745274 was analyzed alone, whereas CYP3A4 and CYP3A5 were analyzed combined for a more comprehensive functional evaluation.14,15
Univariate and multivariate linear regression analyses were carried out considering NVP Cmin as the dependent variable and genetic polymorphisms and clinical characteristics, such as weight, age, sex, ethnicity, HCV and HBV status and backbone antiretrovirals, as independent variables. A general linear model to analyze the effect of independent variables on NVP concentrations was also applied. NVP concentrations were log-transformed in order to comply with the model requirements.
Statistical significance was defined at two-sided p value <0.05. SAS software version 9.3 was used to perform statistical analysis. The protocol was approved by our ethics committee (Comitato Etico Interaziendale, Milano, Area 1); all subjects signed a dedicated informed consent.
Results
Patients’ characteristics
A total of 143 patients were evaluated, of whom 128 (89.5%) were drug-experienced, whereas 15 (10.5%) subjects started NVP within their first-line regimen. Most of the patients were males (61.5%) and Caucasian (92.3%) with a median age of 47.7 years (interquartile range (IQR) = 42.5–52.8 years) and a median body mass index (BMI) of 23.1 kg/m2 (IQR = 20.8–24.5 kg/m2); a total of 32 (22.4%) patients were HCV coinfected (Table 1).
Summary of patient demographics and clinical characteristics of patients included in the model.

n: number of patients; IQR: interquartile range; BMI: body mass index; ARV: antiretroviral; ABC: abacavir; AZT/DDI/D4T: zidovudine/didanosine/stavudine; E: extensive metabolizer; I: intermediate metabolizer; P: poor metabolizer; nd: not determined.
NVP plasma concentration
Overall, the patients underwent NVP Cmin determination after a median time of 82 months (IQR = 44–117 months) from NVP start. NVP Cmin varied from 1571 to 14,189 ng/mL (median = 5063 ng/mL, IQR = 3915–6854). In all, 8 patients (5.6%) showed a NVP Cmin < 3000 ng/mL, whereas 61 (42.7%) showed a NVP Cmin > 6000 ng/mL (Table 2). Patients with NVP Cmin > 6000 ng/mL were significantly older (49.3 years, IQR = 43.4–56.0) as compared to patients with NVP Cmin between 3000 and 6000 ng/mL (46.9 years, IQR = 40.7–52.2) or <3000 ng/mL (43.1 years, IQR = 36.3–46.1; p = 0.031). No significant differences were found in the rate of virological control (HIV-RNA < 37 copies/mL) at the time of NVP Cmin determination between patients with NVP Cmin < 3000 ng/mL and those with NVP Cmin = 3000–6000 ng/mL or >6000 ng/mL (87.5% vs 95.9% vs 95.1%, respectively; p = 0.499). Moreover, no differences were also observed regarding median AST and ALT levels in patients with NVP Cmin > 6000 ng/mL when compared to patients with lower NVP Cmin levels. A trend was observed in the different strata regarding HCV coinfection with a higher percentage of patients resulting HCV coinfected in patients with NVP Cmin > 6000 ng/mL when compared to patients with NVP Cmin = 3000–6000 ng/mL and NVP Cmin < 3000 ng/mL (29.5% vs 18.9% vs 0.0%, respectively; p = 0.106).
Patients’ characteristics according to NVP Cmin concentrations.

n: number of patients; IQR: interquartile range; BMI: body mass index; cps: copies; ARV: antiretroviral; ABC: abacavir; AZT/DDI/D4T: zidovudine/didanosine/stavudine; E: extensive metabolizer; I: intermediate metabolizer; P: poor metabolizer; nd: not determined; AST: aspartate aminotransferase; ALT: alanine aminotransferase.
CYP3A4*22/rs35599367 and CYP3A5*3/rs776746 are combined genotypes for comprehensive functional evaluation.14,15
Italics indicate p value with statistical significance.
The median NVP Cmin significantly differed in patients with different CYP2B6 genotypes (Figure 1). In particular, patient with GG genotypes of CYP2B6 rs3745274 showed significantly lower median NVP Cmin concentration (4553 ng/mL, IQR = 3653–6085) when compared to patient with GT (6268 ng/mL, IQR = 4200–7559) and TT (6441 ng/mL, IQR = 6311–9154) genotypes (p < 0.001). No patients with TT genotype showed NVP Cmin < 3000 ng/mL, and conversely, we observed five patients with GG and three patients with GT genotypes with subtherapeutic NVP Cmin (p = 0.001). No difference in median NVP Cmin was observed for CYP3A metabolizer (extensive: 4522 ng/mL (IQR = 3932–6135 ng/mL), intermediate: 5332 ng/mL (IQR = 3988–6852) and poor: 4840 ng/mL (IQR = 3703–7430); p = 0.572).
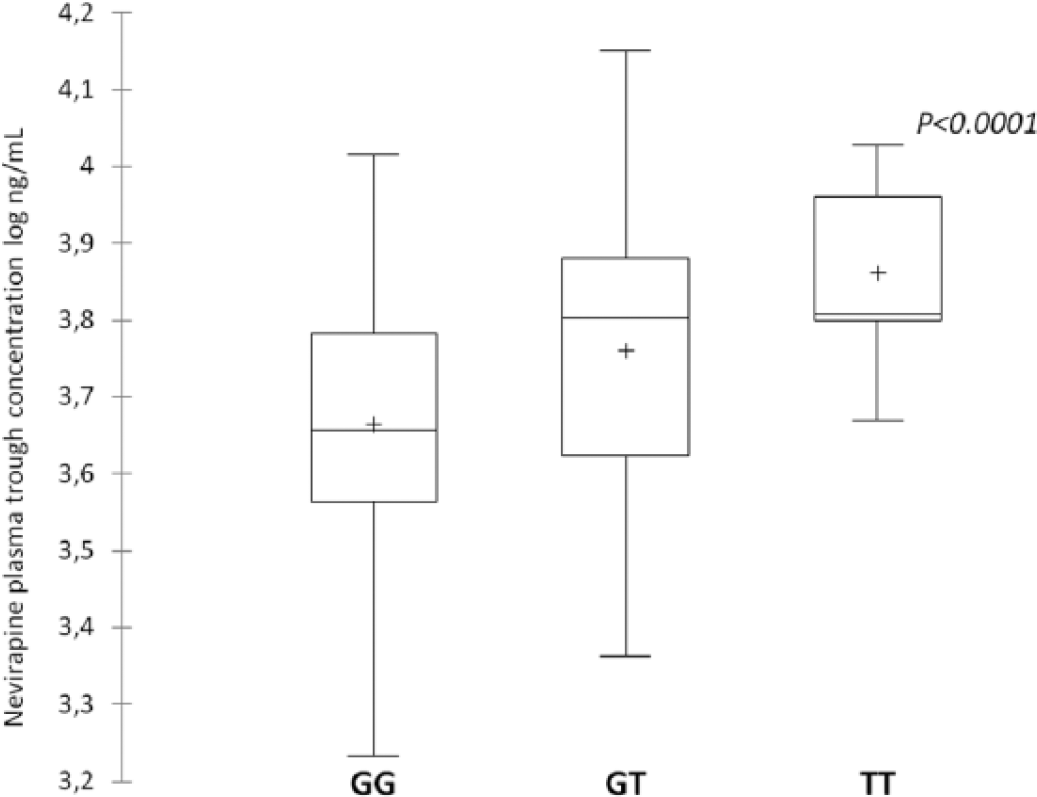
Nevirapine plasma trough concentration according to CYP2B6 516 G>T genotypes. Box and Whiskers plots represent the first quartile, the median, the third quartile, the lowest datum still within 1.5 IQR of the lower quartile and the highest datum still within 1.5 IQR of the upper quartile (+ = mean).
Linear regression model
In the final linear regression model (Table 3), factors significantly associated with a higher NVP Cmin were T allele of CYP2B6 rs3745274 (β = 0.328, 95% confidence interval (CI) = 0.172–0.484; p < 0.0001), older age (β = 0.362, 95% CI = 0.193–0.532; p < 0.0001) and HCV coinfection (β = 0.161, 95% CI = 0.006–0.315; p < 0.041). A trend was also observed for female gender (β = 0.135, 95% CI = 0.024–0.294; p = 0.096) in association with higher NVP Cmin.
Univariate and multivariable regression analyses of factors associated with NVP plasma trough concentrations.

SD: standard deviation; BMI: body mass index; ARV: antiretroviral; ABC: abacavir; AZT/DDI/D4T: zidovudine/didanosine/stavudine; TDF: tenofovir disoproxil fumarate; HCV: hepatitis C virus; HBV: hepatitis B virus; NVP: nevirapine.
Italics indicate p value with statistical significance.
Discussion
In a prevalently Caucasian population of HIV-positive patients receiving NVP-based regimens at a dose of 400 mg once a day, we found a large interindividual variability in NVP plasma concentration, a finding which is consistent with previous reports. 16
The usual target of NVP Cmin required to obtain virological control is >3000 ng/mL. 17 NVP plasma concentrations lower than this threshold may result in reduced viral control with the development of non-nucleoside reverse-transcriptase inhibitors–resistant mutations. 18 In our study, only eight patients (5.6%) showed subtherapeutic levels of NVP, and there were no significant differences in the rate of virological control at the time of NVP Cmin determination in this group of patients as compared to those with NVP Cmin within therapeutic range. This finding could be expected in a cohort of patients in stable NVP-based regimen with a long NVP treatment.
Moreover, the association of NVP concentrations and toxicity is still debated.12,19 In a study conducted in Spain, an association between increased liver transaminases and NVP Cmin concentrations greater than 6000 ng/mL was observed, 12 but other studies conducted on population of different ethnicity did not find an association between NVP Cmin and hepatotoxicity.19–21 In our cohort, we did not observe a correlation between AST and ALT levels and NVP Cmin, thus supporting the evidence that other pathogenetic mechanism unrelated to NVP concentration are involved in NVP-induced liver toxicity. 19 Although on one hand our findings support the long-term safety of NVP-based regimens also in patients with elevated Cmin concentrations, on the other hand we cannot infer about the correlation between NVP Cmin and early NVP-induced liver toxicity due to the long median time of NVP exposure at the time of NVP Cmin determination in our cohort.
The role of polymorphisms in the CYP2B6 gene in influencing NVP plasma concentrations is well established.6,7,13 Specifically, the presence of the T allele at the position c.516 of CYP2B6 has been associated with increased NVP plasma concentrations in populations of different ethnicity. 13 In agreement with previous studies, we observed a genotype-dose effect with an increment of NVP plasma concentration accordingly to the copy number in carriers of the CYP2B6 c.516 T allele. 9 None of our patients with CYP2B6 TT genotypes showed subtherapeutic levels of NVP Cmin, confirming the importance of the presence of at least one T alleles in determining NVP Cmin above the therapeutic threshold also in Caucasian patients. 9
Although CYP3A4 and CYP3A5 are involved in the metabolism of NVP, we did not find any significant association between polymorphisms of these genes (even considering their combined effect) and NVP plasma concentration, and this is consistent with the findings of previous studies. 13 CYP3A4 and CYP3A5 account for a 90% sequence homology with a relevant overlap in substrate specificity. 21 In African populations, CYP3A5 enzyme could play a considerable role in the metabolism of NVP since it is expressed to higher levels when compared to Caucasians. 8
Beyond genetic background, other patient-related factors, in particular sex, body weight and underlying liver disease, may affect NVP plasma exposure.16,22
Our data confirm the significant role of HCV infection in influencing NVP plasma levels. However, it should be considered that the effect of HCV coinfection on NVP plasma concentration may have a small impact in patient with a normal liver function.22,23 Thus, it is possible that hepatic function rather than HCV per se could represent a more reliable predictor of increased NVP plasma concentrations. 24
Similar to results of the study by Wyen et al., 7 we found a significant association between age and higher NVP plasma concentration. The possible age-related NVP overexposure has to be taken into account when NVP is used in the contest of simplification strategy in particular with the possible use of NVP in an aging population with metabolic disorders.3,25,26
We also observed a trend for female gender and elevated NVP plasma concentration, as previously found in several independent studies.18,27 Conversely, we did not observe an association with NVP exposure and body weight as previously shown in other studies. 9 This could partially be explained by the homogeneity of body weight in our cohort and by the possible link between the two variables (gender and body weight) in our model.
Our study accounts for several limitations. First, the mono-centric design may limit the generalizability of our findings. Second, the retrospective design could influence the selection of patients. In particular, we selected patients tolerant to NVP-based regimens excluding from the analysis patients who early interrupted the regimen after NVP start. Third, although our study suggests that patients on long-term effective NVP-containing regimens may be able to maintain virological suppression even with unfavorable genotypic profile and lower NVP concentrations, these results may be not generalizable to all patients, particularly those receiving NVP-based regimens as first-line therapy in whom virological failure due to subtherapeutic drug levels has been well described. Fourth, it should be considered that the use of NVP in high-income countries has been dramatically decreased in recent years, and our data apply to limited number of patients. Finally, it is unlikely that our genetic technique is going to be applied in resource-limited setting, in contrast to higher income countries. This genetic methodology could serve as proof-of-principle in further studies using newer compounds in development, in old and more recent classes.
Moreover, we evaluated only the well-known SNPs into the genes that directly affect NVP metabolism, but other SNPs or other CYPs regulatory genes may be involved.
Conclusion
Our study, conducted in a prevalent Caucasian population, reaffirms the importance of CYP2B6 genetic variants in influencing NVP plasma trough concentration. Furthermore, the importance of clinical covariates, such as older age and HCV coinfection, in determining exposure to NVP had been confirmed. Personalization of antiretroviral therapy is today reachable and overall our data support the potential of pharmacogenomics in selecting the most appropriate treatment for each patient. We acknowledge the fact that certain techniques are applied in high-resource countries which can afford them and not worldwide. This gap has to be filled and novel technologies have to be disseminated in every country where HIV-positive subjects are cared for.
Footnotes
Acknowledgements
The authors thank Mrs Tiziana Formenti for the excellent technical help.
Declaration of Conflicting Interest
The author(s) declared the following potential conflicts of interest with respect to the research, authorship, and/or publication of this article: S.R. has received research grants, consultancy payments and speaker’s fees from Bristol-Myers Squibb, Gilead, ViiV Healthcare, Merck Sharp & Dohme, ABBvie and Janssen. M.G. has received research grants, consultancy payments and speaker’s fees from Bristol-Myers Squibb, Gilead, ViiV Healthcare, Merck Sharp & Dohme, ABBvie, Janssen and Roche.
Ethics approval
Ethical approval for this study was obtained from our ethics committee (Comitato Etico Interaziendale, Milano, Area 1). The protocol number is 34969/2017.
Funding
The author(s) received no financial support for the research, authorship, and/or publication of this article.
Informed consent
Written informed consent was obtained from all subjects before the study.