
Abstract
Objectives:
Left ventricular ejection fraction can be measured by a variety of invasive and non-invasive cardiac techniques. This study assesses the relation of three diagnostic modalities to each other in the measurement of left ventricular ejection fraction: invasive contrast left ventriculography, two-dimensional echocardiography, and quantitative gated single-photon emission computed tomography.
Methods:
Retrospective chart review was conducted on 58 patients hospitalized with chest pain, who underwent left ventricular ejection fraction evaluation using each of the aforementioned modalities within a 3-month period not interrupted by myocardial infarction or revascularization.
Results:
The mean left ventricular ejection fraction values were as follows: invasive contrast left ventriculography (0.44±0.15), two-dimensional echocardiography (0.46±0.13), and gated single-photon emission computed tomography (0.37±0.10). Correlations coefficients and associated p values were as follows: invasive contrast left ventriculography versus two-dimensional echocardiography (r=0.69, p<0.001), invasive contrast left ventriculography versus gated single-photon emission computed tomography (r=0.80, p<0.0001), and gated single-photon emission computed tomography versus two-dimensional echocardiography (r=0.69, p<0.001).
Conclusion:
Our results indicate that strong positive correlations exist among the three techniques studied.
Keywords
Introduction
Left ventricular (LV) ejection fraction (LVEF) is an ejection phase index that is commonly used in the diagnosis and management of cardiovascular disease.1–4 In addition, it provides valuable prognostic information for many cardiac disorders.5–7 Multiple diagnostic techniques have been utilized to measure LVEF including invasive contrast left ventriculography (ICLV), two-dimensional echocardiography (2DE), quantitative gated single-photon emission computed tomography (gSPECT), first pass and equilibrium radionuclide left ventriculography, cardiac magnetic resonance imaging, and computed tomographic angiography.3,8–18 LVEF is routinely measured in patients with established coronary artery disease and is often obtained during the evaluation of patients with chest pain.8–18 In such patients, LVEF is frequently obtained using two or more diagnostic techniques, potentially producing redundant information about LV systolic function and increasing medical costs. In patients undergoing left heart catheterization with coronary angiography, ICLV exposes patients to additional radiation and to the risk of contrast-induced acute kidney injury.19–21 Multiple studies have compared ICLV and individual non-invasive techniques for measuring LVEF.22–41 Some have compared LVEF measurements utilizing two or three non-invasive cardiac techniques.42–58 This study retrospectively compared LVEF in patients hospitalized for evaluation of chest pain, who underwent an ICLV, 2DE and gSPECT within 3 months of each other, not interrupted by myocardial infarction or by percutaneous or surgical coronary revascularization.
Methods
Patient selection
Patients hospitalized at the Harry S. Truman Memorial Veterans’ Hospital between 1 January 2002 and 31 December 2005 for chest pain thought to be of cardiac origin who received ICLV, 2DE, and gSPECT within 3 months of each another, not interrupted by percutaneous coronary intervention or coronary artery bypass grafting identified by retrospective chart review, were considered eligible for inclusion in the study. Diabetes mellitus was defined as a fasting blood sugar >126 mg/dL. Hypertension was defined as a systolic blood pressure >140 mmHg and/or a diastolic blood pressure >90 mmHg on at least two occasions or treatment with anti-hypertensive medication. Dyslipidemia was defined as elevated low-density lipoprotein or low levels of high-density lipoprotein cholesterol. Obstructive coronary artery disease was defined as coronary stenosis >50% on coronary angiography. Peripheral arterial disease was defined as ankle brachial index values <0.90 and/or classic Rose claudication. Cerebrovascular disease was defined as ischemic stroke or transient ischemic attacks. Chronic kidney disease was defined as an estimated glomerular filtration rate <60 mL/min/1.73 m2. Patients without chest pain and those who suffered from acute myocardial infarction or who underwent percutaneous coronary intervention or coronary artery bypass grafting prior to assessment of LVEF with all three diagnostic techniques were excluded from the study, as were subjects with technically inadequate studies of LVEF.
Protocol
Each patient underwent ICLV, 2DE, and gSPECT within 3 months of each other, not interrupted by myocardial infarction or by surgical or percutaneous myocardial revascularization.
ICLV was performed during left heart catheterization with coronary angiography in the 30° right anterior oblique position. About 30–35 mL of iodinated non-ionic, iso-osmolar contrast media was injected at a rate of 12–15 mL/s. Film speed was 30 frames/s. LV end-diastolic and end-systolic volumes were measured using the method of Sandler and Dodge. 59 LVEF (%) was calculated by subtracting LV systolic volume from LV end-diastolic volume, then dividing the difference by LV end-diastolic volume. The normal range for LVEF in our laboratory is 0.55–0.74.
Echocardiographic evaluation consisted of 2DE which was performed in accordance with American College of Echocardiography guidelines using an I-E 33 Philips echocardiograph (Andover, MA). All images were obtained by a single-skilled cardiac sonographer. LV volumes were measured using modified Simpson’s rule. 60 LVEF (%) was calculated by subtracting LV volume in systole from LV volume in diastole, then dividing the difference by LV volume in diastole. The normal range for LVEF in our laboratory is 0.55–0.70.
Quantitative gSPECT assessment of LVEF was determined during myocardial perfusion imaging using Tc99m sestamibi. Data were acquired using a three-head Prism 3000 camera (Picker, Cleveland, OH) or a two-head Forte camera (Philips, Milpitas, CA). Imaging with the three-head camera consisted of a 120° rotation and 30 stops/steps with 25–40 s per stop using low energy general purpose collimators. Quantitative analysis was performed with the gSPECT analysis program from Picker. Imaging with the two-head camera consisted of a 180° rotation and 32 stops/steps within 25–40 s per stop using high resolution vertex general purpose collimators. Images were corrected for attenuation using a transmission source of Gadolinium-153. Quantitative analysis was performed using AutoQUANT software from Philips Inc. Both methods used 8 frames per cycle in the gSPECT analysis. Tc99m was the radiopharmaceutical used to determine baseline LVEF in each patient. The normal range for gSPECT LVEF in our laboratory is 0.50–0.75.
LVEF for each technique was measured by a single experienced cardiologist or nuclear medicine physician. Each individual was blinded to the measurements obtained from the other techniques.
This research was approved by the Institutional Review Board of the University of Missouri-Columbia in accordance with the principles of the Declaration of Helsinki (approval number: 1020744).
Statistical analysis
Continuous variables were expressed as mean values ± 1 standard deviation. Mean LVEF values were reported as a decimal fraction ± 1 standard deviation. Linear regression analysis using Pearson correlation coefficients was used to compare LVEF values as follows: ICLV versus 2DE, ICLV versus gSPECT, and 2DE versus gSPECT. A p value of <0.05 was required for statistical significance.
Results
Patient characteristics
A total of 279 patients were evaluated for chest pain. LVEF was measured by ICLV, 2DE, and gSPECT in 186 patients. A total of 72 patients had all three techniques performed within 3 months of each other. Of these, 58 had no myocardial infarction or revascularization procedure before completion of LVEF analysis with all three modalities. Baseline demographic and clinical characteristics of the 58 patients entered into the study are summarized in Table 1.
Patient characteristics.

Age is expressed as mean value ± 1 standard deviation.
Other characteristics are expressed as number of patients (N) and percentage of the total study population (in parentheses).
Assessment of LVEF
Mean LVEF values ± 1 standard deviation for the three modalities studied were 0.44 ± 0.15 for ICLV, 0.46 ± 0.13 for 2DE, and 0.37 ± 0.10 for gSPECT. In our laboratories, the lower limits of normal for LVEF were 0.55 for ICLV and 2DE, and 0.50 for gSPECT. Correlations among the three modalities were as follows: ICLV versus 2DE (r = 0.69, p < 0.001, Figure 1); ICLV versus gSPECT (0.80, p < 0.0001, Figure 2), and 2DE versus gSPECT (r = 0.69, p < 0.001, Figure 3).

Correlation of LVEF values derived from invasive contrast left ventriculography and LVEF values obtained from two-dimensional echocardiography.

Correlation of LVEF values derived from invasive contrast left ventriculography and those obtained using gSPECT.
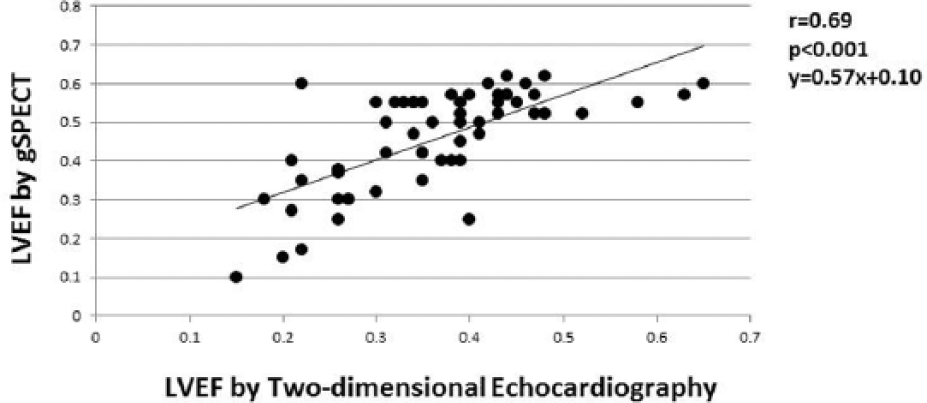
Correlation of LVEF values derived from two-dimensional echocardiography and LVEF values obtained using gSPECT.
Discussion
Accurate assessment of LVEF is important due to its prognostic value and its ability to direct pharmaceutical and device therapy, particularly in patients with coronary artery disease and in those with heart failure.1–8 Many patients with chest pain thought to be of cardiac origin undergo left heart catheterization with coronary angiography and ICLV. Witteles et al. 8 reported that ICLV was performed in 81.1% of 96,235 patients undergoing coronary angiography. ICLV increases exposure to ionizing radiation and may contribute to the development of contrast-induced acute kidney injury in at-risk patients such as those with underlying renal dysfunction, diabetes mellitus, anemia, hypotension and shock, and heart failure.8,19–21 During the course of clinical evaluation, multiple non-invasive cardiac procedures capable of generating LVEF values are frequently performed. In such patients, ICLV may provide redundant information concerning LV systolic function, if LVEF measurements obtained using non-invasive cardiac techniques are accurate and comparable to those obtained from ICLV. If so, non-invasive assessment of LVEF could be substituted for ICLV, thus reducing radiation exposure, cost, and the risk of contrast-induced acute kidney injury.
Many studies have compared LVEF values obtained from various non-invasive imaging techniques with those obtained using ICLV.22–41 Prior studies, like ours, reported mean LVEF values and binary correlations between imaging techniques.22–41
Our study demonstrated that mean LVEF values obtained from 2DE were nearly equal to those obtained from ICLV. Similar observations were reported by Murarka et al., 30 Godkar et al., 41 and Joffe et al. 29 In contrast, mean LVEF values obtained using 2DE were lower than those obtained using ICLV in studies reported by Albrechtsson et al., 28 Nichols et al., 38 and Hoffman et al. 27 In Hoffman’s 27 study, mean LVEF values were higher and more comparable to those obtained with ICLV when contrast echocardiography was employed. LVEF values from ICLV correlated positively and significantly with those obtained from transthoracic echocardiography in nearly all studies. Correlation coefficients ranged from 0.23 to 0.96, with most ranging from 0.75 to 0.80.22–41 The correlation coefficient reported in our study (0.69), while statistically significant, was among the lowest of those reported. Murarka et al. 30 reported an overall correlation coefficient of 0.36 (p < 0.001). In this study, the correlation coefficients were 0.23 (not significant) in patients with non-ischemic dilated cardiomyopathy and 0.75 (p < 0.0001) in those with ischemic cardiomyopathy. 30
Studies comparing LVEF values obtained from ICLV and gSPECT have expressed the relationship primarily in the results of linear regression analyses.22,23,36–40 Reported correlation coefficients range from 0.75 to 0.94, all of which were statistically significant.22,23,36–40 The correlation coefficient reported in this study (0.80) is in line with these results. Our study showed that gSPECT produced a lower mean LVEF value (0.37 ± 0.10) than ICLV (0.46 ± 0.13). However, the lower limit of normal for gSPECT LVEF (0.50) in our laboratory is 0.05 lower than that of ICLV. Godkar et al. 41 reported higher mean LVEF values associated with gSPECT compared to those associated with ICLV (0.54 ± 0.12 vs 0.46 ± 0.13). The reasons for this disparity are uncertain. Speculation exists that alterations in LV geometry (global and regional) and differences among various gSPECT protocols and radionuclide agents used may contribute to variability in LVEF measurement with gSPECT relative to standard right anterior oblique ICLV.
Studies comparing LVEF values obtained from 2DE and gSPECT have reported variable results.22,42–47 In a study of 109 patients, Cwaig et al. 45 reported no significant difference in mean LVEF values obtained from 2DE (0.59 ± 0.16) and gSPECT (0.58 ± 0.15). Similarly, Berk et al. 43 reported no significant difference between mean LVEF values obtained from 2DE (0.29 ± 0.08) and those obtained using gSPECT (0.28 ± 0.09) in 45 patients with dilated cardiomyopathy. Habash-Bselso et al. 23 reported a small but significant difference in mean LVEF values from 2DE (0.49 ± 0.01) and those obtained from gSPECT (0.47 ± 0.10, p = 0018). A larger disparity in mean LVEF values was noted in a study of 63 patients by Omar et al. 42 In that study, mean LVEF values were 0.56 ± 0.05 with 2DE and 0.51 ± 0.09 with gSPECT. In contrast, Mistry et al. 44 reported higher mean LVEF values with gSPECT (0.64) than with 2DE (0.56) in 50 patients. Our findings showed mean LVEF values of 0.46 ± 0.13 with 2DE and 37 ± 10% with gSPECT. This difference could be explained in part by the fact that in our laboratory, the lower limit of normal for LVEF derived from gSPECT is 0.05 lower than that of 2DE. Several studies, including ours, have reported significant positive correlations between LVEF values obtained from 2DE and gSPECT with r values ranging from 0.72 to 0.80.22,23,42–47,49,50
We found only one other study that evaluated and compared resting LVEF values determined using ICLV, 2DE, and gSPECT. In a study of 109 patients with coronary artery disease, Gholamrezanezhad et al. 22 reported the following mean LVEF values at rest: ICLV (0.42 ± 0.12), 2DE (0.45 ± 0.12), quantitative gSPECT (0.47 ± 0.15), and semi-automatically processed gSPECT (0.43 ± 0.14). All correlation coefficients were >0.63 and were statistically significant.
Our study focused on the three most commonly used modalities for measuring LVEF: ICLV, 2DE, and gSPECT. Other diagnostic techniques have produced variable results. LVEF values derived from equilibrium radionuclide left ventriculography, magnetic resonance imaging, and computed tomographic angiography imaging have, in general, correlated positively and significantly with ICLV, 2DE, and gSPECT and with one another.3,17,18,27,32,39,44,46,48–53 However, mean LVEF values derived from equilibrium radionuclide left ventriculography, magnetic resonance imaging, and computed tomographic angiography have varied substantially when compared to ICLV, 2DE, and gSPECT, lower in some studies, nearly equal in several studies, and higher in other studies.3,17,18,27,32,39,44,46,48,50,53,56
There were multiple study limitations. Although consecutive eligible patients were enrolled, the study was retrospective. All but one of the patients enrolled were middle-aged or older men and thus, the findings may not be applicable to women and younger men. Two different cameras were used to acquire gSPECT images. There were no comparisons with standard techniques such as equilibrium radionuclide left ventriculography or newer technologies such as magnetic resonance imaging. Although the study was adequately powered, a larger patient population would have imparted greater strength to the observed outcomes. Data analysis for each method was performed only once by a single different investigator for each technique. This precluded intra- and inter-observer variability analysis.
Our results indicate that there are strong positive correlations in LVEF among the three modalities employed in this study. The correlations of 2DE and ICLV (Figure 1), gSPECT and ICLV (Figure 2), and gSPECT and 2DE (Figure 3) were highly significant, all p < 0.001. This study is only the second to compare LVEF values using ICLV, 2DE, and gSPECT in the same study population. The lower mean LVEF value for gSPECT can be explained, in large part, by the fact that the lower limit of normal in our laboratory for gSPECT LVEF was 0.05 lower than that of ICLV and 2DE. It is noteworthy that the absolute value of the gSPECT LVEF measurement is determined by the sum of the components of the system: patient, camera, collimator, protocol, radiopharmaceutical, and software. Differences in methodology may contribute to variations in normal range values among individual laboratories.
In summary, our results indicate that there is strong positive correlation among the three techniques used to measure LVEF in this study. This suggests that 2DE and gSPECT can be used to accurately assess LVEF in patients undergoing coronary angiography, in patients who may be at risk of contrast-induced acute kidney injury or excessive radiation exposure, taking into account variation in normal range values among individual laboratories that may exist due to differences in methodology.
Footnotes
Declaration of conflicting interests
The author(s) declared no potential conflicts of interest with respect to the research, authorship, and/or publication of this article.
Ethics approval
Ethical approval for this study was obtained from the Institutional Review Board of the University of Missouri-Columbia: Approval number 1020744.
Funding
The author(s) received no financial support for the research, authorship, and/or publication of this article.
Informed consent
Informed consent was not sought for this study because this was a retrospective chart review study. Patients were identified by medical record number only.