
Abstract
Background:
Manipur, a north-eastern state of India, has a high incidence of intravenous drug use with an equally high prevalence of Hepatitis C virus (HCV) infection.
Objectives:
This cross-sectional study aimed to evaluate the impact of certain risk factors enhancing the susceptibility of acquiring HCV.
Design:
A total of 1008 participants from various risk groups, from nine districts across the state, were enrolled. Blood samples along with demographic data were collected from the study participants.
Methods:
HCV RNA was isolated and nested RT-PCR was performed followed by Sanger sequencing for genotyping. Phylogenetic and phylogeographic studies were further conducted.
Results:
Of the total, 493 (48.90%) samples were HCV sero-reactive. Among the sero-reactive samples, 406 (82.35%) were HCV RNA positive. In case of the subgroup PWID + HIV, sero-reactivity (82.22%) and viremia (90.54%) were observed to be exceptionally high. It was noted that HCV sero-reactivity increased four times in people living with HIV (PLHIV) who continued to inject drugs. Three HCV genotypes and eight subtypes were circulating in this study population.
Conclusion:
In PLHIV who continued to inject drugs, HCV sero-reactivity increased four-fold. About 40% of the population living with HCV belonged to genotype 6, while genotype 1 showed a noticeable decline. Phylogeographic analyses and spatiotemporal reconstructions revealed that most of the subtypes migrated from far south-east Asian countries like Thailand, Malaysia, Myanmar, and Singapore.
Keywords
Introduction
Hepatitis C virus (HCV) is a globally prevalent blood-borne virus responsible for chronic liver diseases causing cirrhosis of liver and hepatocellular carcinoma. 1 It is a single-stranded hepatotropic RNA virus with a genome size of ~9.6 kb. The WHO estimates that approximately 50 million individuals were living with chronic HCV infection as of 2022. 2 Even after the advent of all oral efficient “Direct Acting Antivirals” (DAAs), HCV remains one of the biggest threats to global health. 3 Due to its error-prone RNA-dependent-RNA-polymerase activity, HCV displays a diverse genomic variation. As of March 2022, 8 HCV genotypes and 93 subtypes are described and confirmed. 4 The generation of closely related quasispecies enables the virus to escape adaptive immunity. 5 Global prevalence studies suggest that among all HCV genotypes, the most prevalent genotypes are 1 and 3. While genotype 2 has a global prevalence, genotype 4 has an exclusive predominance in Egypt, middle-eastern and sub-Saharan countries. Genotype 5, though relatively rare is present in south and east African countries. 6 East and south east Asia has a predominance of genotype 6. 7 While genotype 7 was identified in 2015 from an emigrant of Central Africa, genotype 8 was the latest addition identified from Punjab, India.8,9 In India, there is a predominance of genotype 3 and 1. 10
HCV infection is spread via contaminated blood and blood products, sharing of needles, and injecting equipment among intravenous drug users. According to nationwide surveillance, more than 1 million PWIDs (people who inject drugs) reside in India. 11 It is estimated that 10% of all HIV infections result from intravenous drug use globally. 12 In India, one of the worst states hit by PWID-related pandemic is the north-eastern border state of Manipur. A cross-sectional survey carried out in two districts of Manipur showed a high prevalence of HCV (95%) among HIV-infected PWIDs. 13 A study regarding risk behaviors of young PWIDs reported sero-prevalence of HIV and HCV to be as high as ~75% and 98%, respectively. 14 Manipur is a small state (22,327 km2), flanked by the neighboring country of Myanmar on its east, and the states of Nagaland, Assam, and Mizoram to its north, west, and south, respectively. Its proximity to Myanmar and the porous border is known to have paved a way for illegal drug trafficking into India. The “Golden Triangle,” a region where the borders of Thailand, Myanmar, and Laos meet, serves as a conduit of drug flow that finally enters the country through the bordering states (Figure S1).
Intergenotypic recombination in HCV, or formation of chimeras is a rare event but a crucial one as it brings together diverse subtypes often causing a hindrance in DAAs therapy. 15 Due to repeated needle usage, PWIDs are prone to acquiring recombinant forms. 16 In our previous study, we explored the genomic diversity of HCV among the PWIDs subpopulation of Manipur and delineated its transmission route. 17 This study tried to explore the same geography with a larger sample size and understand changes in the genomic distribution and transmission dynamics. Any occurrence of genomic recombination was also explored. The effect of exposure to risk factors and how they influence HCV infectivity was also investigated.
Methods
Study design
This was a cross-sectional study of viral evolution and transmission dynamics. Blood samples were collected from nine districts of Manipur: Bishnupur, Chandel, Churachandpur, Imphal East, Imphal West, Senapati, Tamenglong, Thoubal, and Ukhrul as part of a sero-surveillance of HCV from November 2014 to January 2015. Demographic data such as age, gender, and exposure to risk factors were collected in a prescribed format. HIV-positive individuals were also included. The reporting of observations in this study conforms to the STROBE (Strengthening the Reporting of Observational Studies in Epidemiology) statement (Supplemental Material).
Detection of HCV antibodies
Whole blood from study participants was collected in sterile EDTA vials. HCV sero-status in blood plasma was checked with an enzyme immunoassay kit (HCV Monolisa, Bio-Rad, USA) for the presence of anti-HCV antibodies.
HCV RNA extraction and detection
Viral RNA was isolated from 140 µl of HCV sero-positive plasma with QIAamp Viral RNA Mini kit (Qiagen, Hilden, Germany) using the manufacturer’s protocol. RNA was eluted in 50 µl elution buffer and stored at −80°C. Qualitative detection of HCV RNA was performed using nested RT-PCR based on 5′ UTR of the HCV genome with previously described primers. 16 The RT-PCR reaction conditions were set as previously described. 17 PCR positive amplicons (256 bp) were electrophoresed in 1.5% agarose gel stained with ethidium bromide and visualized in a gel documentation system (Bio-Rad, USA).
HCV viral load estimation
Quantitative estimation of HCV RNA was performed using Qiagen Real-time qRT-PCR kit (QuantiFast® Pathogen RT-PCR + IC Kit) (Qiagen, Hilden, Germany). The primers and probe sequences were directed against the 5’ UTR of the genome. 18 The fourth WHO International Standard for HCV, NIBSC code 06/102, was used as standard. Viral loads in plasma were expressed as log10 international units per millilitre (log10 IU/ml).
HCV genotyping and recombination study
For deciphering HCV genotypes and identifying recombinant strains circulating in the study population, paired partial core and NS5B regions were amplified by nested RT-PCR with primers and PCR conditions as described previously. 19 Positive PCR amplicons of partial core (405 bp) and NS5B (389 bp) were gel excised and purified using the QIAquick gel extraction kit (Qiagen, Hilden, Germany). They were further processed for Sanger sequencing using Big-Dye terminator 3.1 kit (Applied Biosystems, Foster City, CA, USA) in an automated DNA sequencer 3130XL (Applied Biosystems, Foster City, CA, USA). The sequences were aligned and edited using BioEdit. Genotypes and subtypes were determined using NCBI Genotyping tool (https://www.ncbi.nlm.nih.gov/projects/genotyping/formpage.cgi).
Phylogenetic analysis
To study the evolutionary lineage of HCV strains in this study population, representative phylogenetic trees were constructed using 110 partial core and 57 NS5B sequences using MEGA X. 20 The reference sequences were downloaded from the HCV database set of NCBI genotyping tool. Representative sequences were first aligned with the references using Clustal Omega (inbuilt in MEGA X). The best-fit model for the dataset was inferred using an inbuilt model predictor and a suitable Maximum Likelihood tree was constructed using the Kimura two-parameter model. 21 The tree with the highest log likelihood (−5229.88) is shown. The percentage of trees in which the associated taxa clustered together is shown next to the branches. Initial tree(s) for the heuristic search were obtained automatically by applying Neighbor-Join and BioNJ algorithms to a matrix of pairwise distances estimated using the Maximum Composite Likelihood (MCL) approach, and then selecting the topology with superior log likelihood value. A discrete Gamma distribution was used to model evolutionary rate differences among sites (five categories (+G, parameter = 0.4653)). The rate variation model allowed for some sites to be evolutionarily invariable ((+I), 22.33% sites). There was a total of 300 positions in the final dataset. Evolutionary analyses were conducted in MEGA X. 20
Phylogeography
To understand the route of transmission of rare genotypes in this study, Bayesian phylogeny was performed using the BEASTv1.10.4 package. 22 A Maximum Clade Credibility (MCC) tree was constructed using reference sequences downloaded from NCBI; 300 bps of partial core gene (nucleotides 342–641 of the NCBI reference sequence NC_004102) was used for the analysis. Nucleotide substitution model and site heterogeneity were selected as described previously. 17 A relaxed, uncorrelated lognormal clock was selected as the molecular clock model. The Markov Chain Monte Carlo was run for 10 million states and sampled after every 10,000 states. For achieving a reasonable effective sample size, the BEAST output was analyzed in Tracer. The final tree was built with the help of TreeAnnotator; 10% of the total iterations were used as burn-in. The tree was visualized and edited using FigTree. The final phylodynamic reconstruction was rendered using SpreaD3v0.9.6. 23
Statistical analysis
Risk behavior of the demography, HCV sero-reactivity and viremia across different parameters were studied and chi-square test of independence was conducted for each. Viral load variation was studied by one-way ANOVA test and values were represented as mean ± SD. p-Values ⩽ 0.05 were considered statistically significant.
Results
Demographic data
A total of 1008 individuals from nine districts of Manipur were broadly divided into six groups based on risk behavior. The first group consisted of 502 PWIDs. The second group was of 45 individuals who had a spouse who injected drugs. The third group had 90 individuals living with HIV who were drug users. Individuals undergoing blood transfusion, kidney dialysis and chronic liver disease (CLD) patients formed the fourth group (n = 59). People living with HIV (PLHIV; n = 95) was the fifth group. The sixth category comprised individuals with no information about risk factor exposure (n = 217). In total, this study had 751 (74.50%) males and 257 (25.49%) females with a mean age of 35.2 ± 9.18 years (Table 1).
District, age group, and gender-wise distribution of study population.
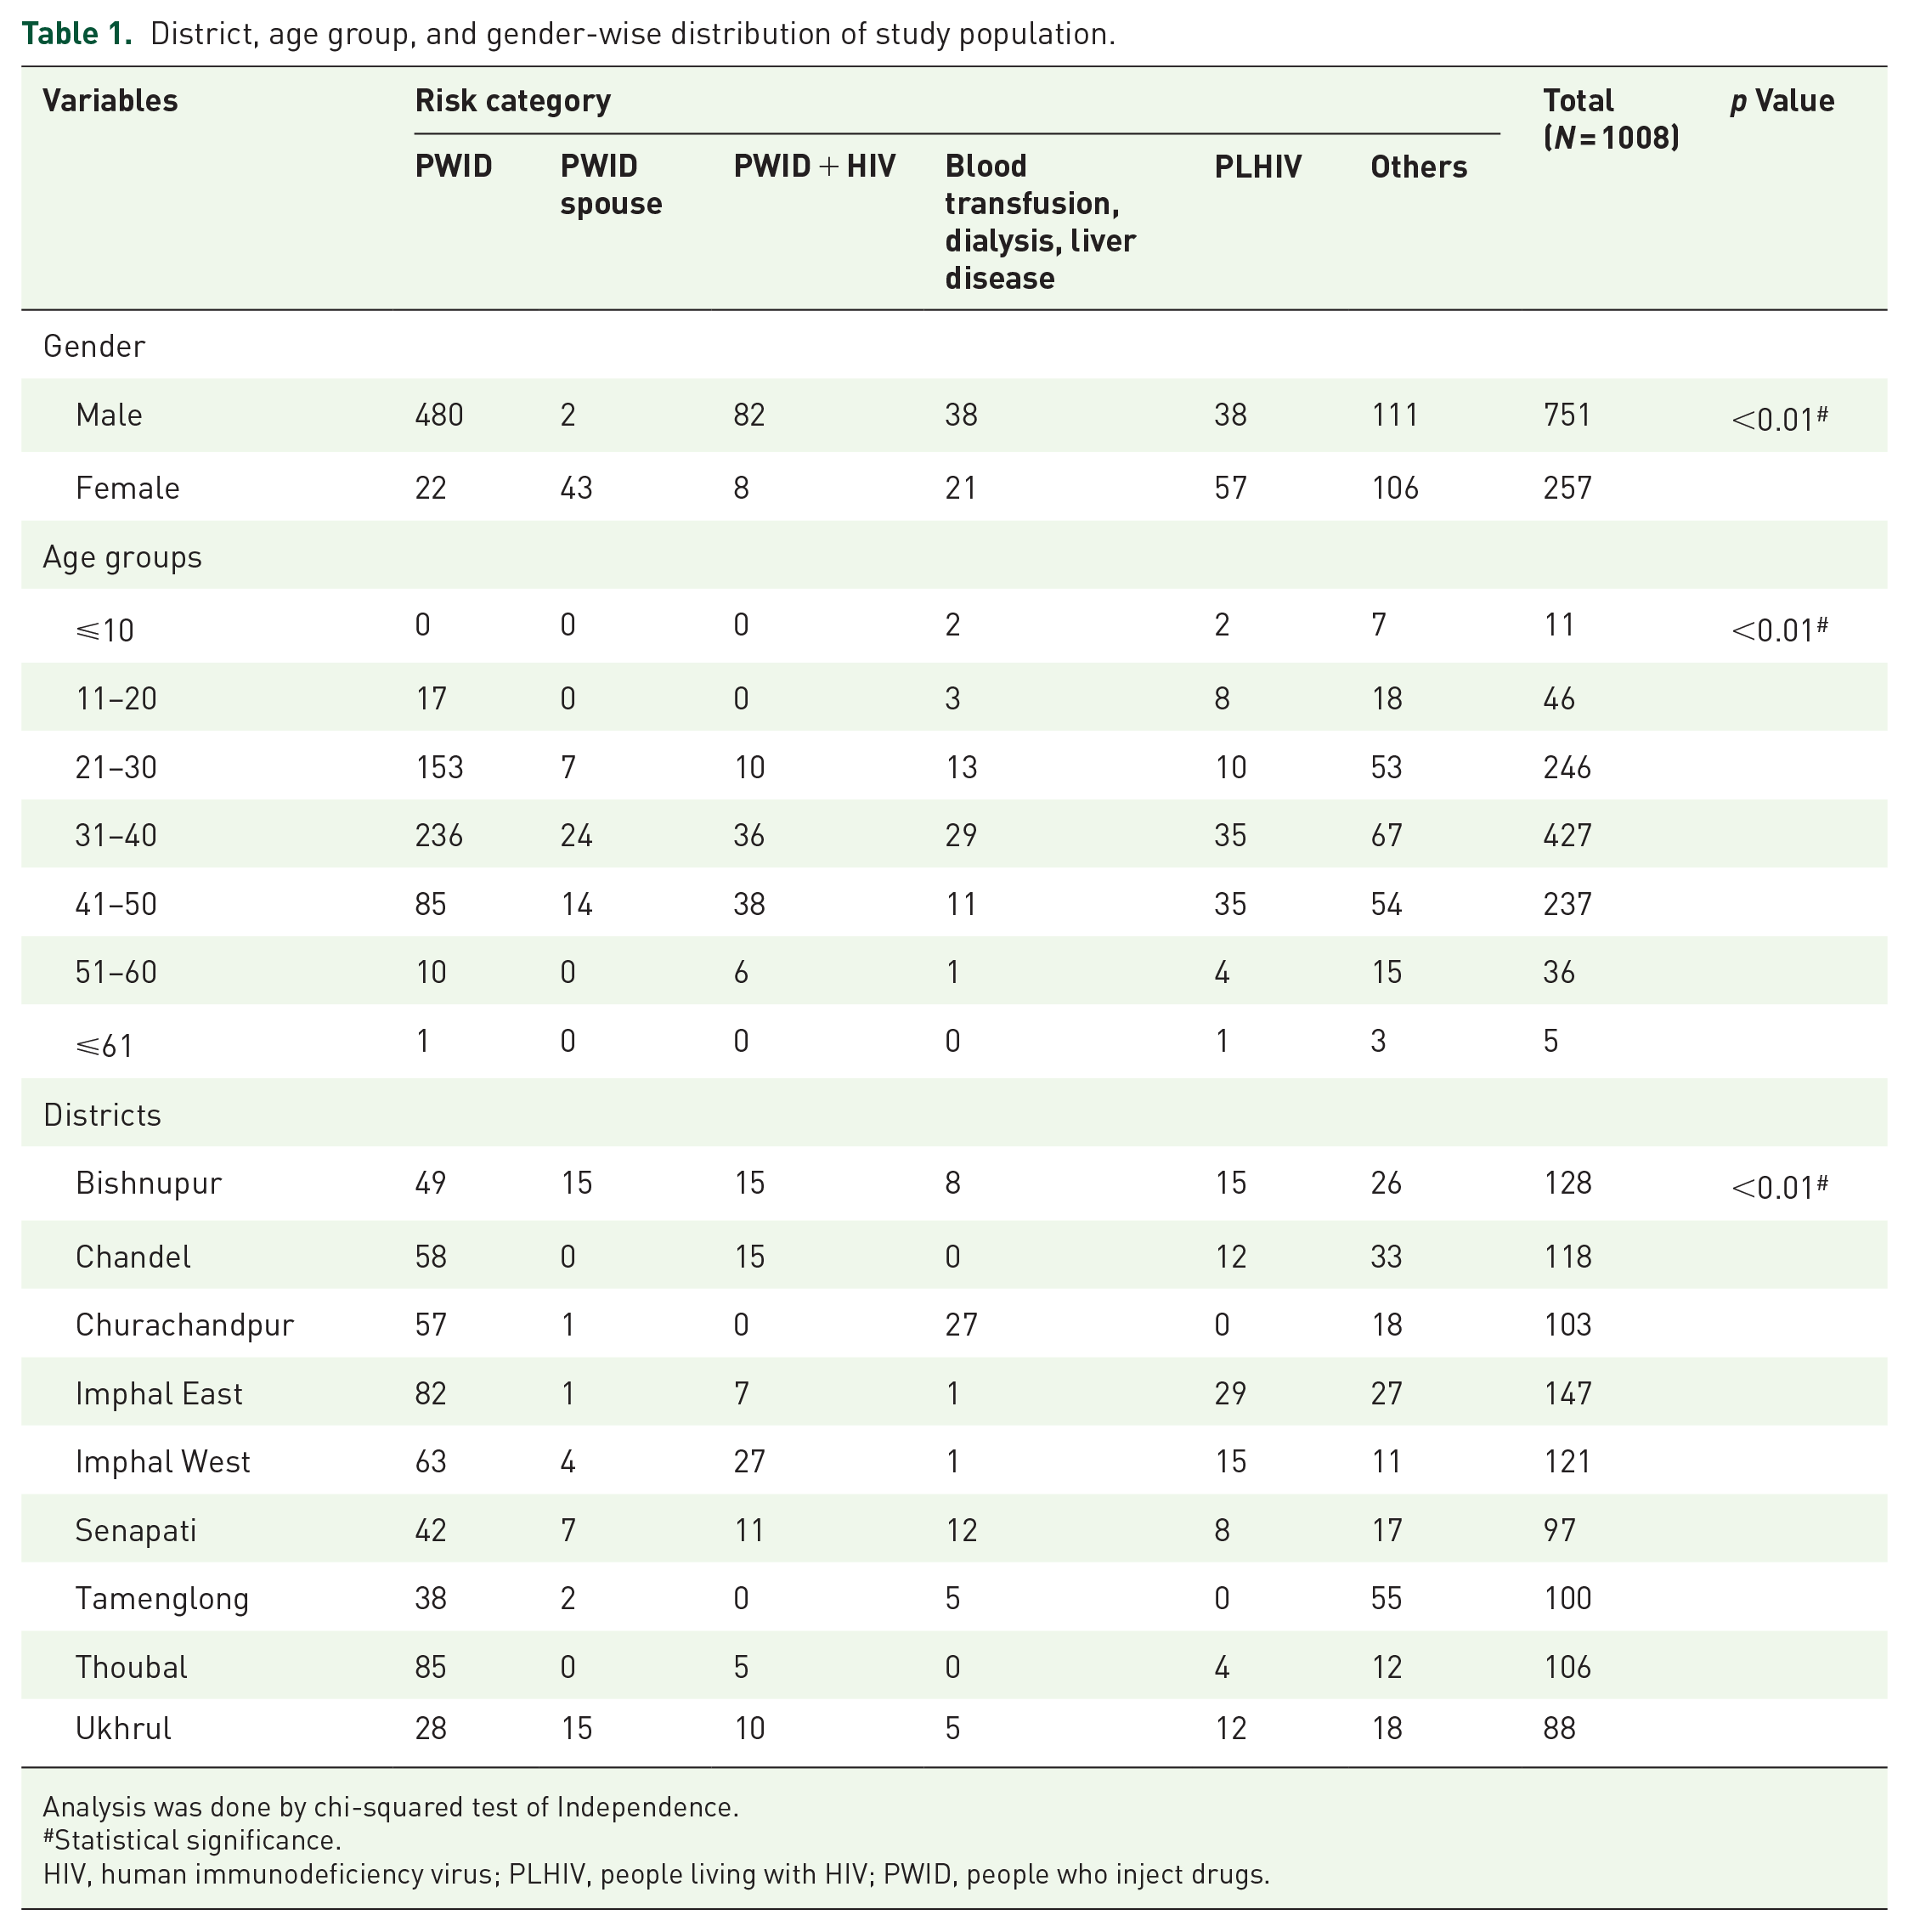
Analysis was done by chi-squared test of Independence.
Statistical significance.
HIV, human immunodeficiency virus; PLHIV, people living with HIV; PWID, people who inject drugs.
HCV sero-prevalence and active infection
Out of 1008 blood samples, overall HCV sero-reactivity was observed in 493 (48.90%) samples. Considering this rate as the average sero-reactivity for our study population, comprising of different risk groups, HCV sero-reactivity exhibited due to each risk behavior was further understood. The highest sero-reactivity was observed in PWID + HIV group (82.22%) followed by PWIDs (64.34%). Moderate HCV sero-reactivity was observed in the PLHIV (22.10%) and PWID spouse (24.44%) subgroups. The fourth group showed a moderately high HCV sero-reactivity (44.06%). Of the 493 HCV sero-reactive samples, 406 (82.35%) were HCV RNA positive. Highest RNA positivity (viremia) was also observed in the PWID + HIV subgroup (90.54%). More than 80% viremia was observed in all categories except the “others/unknown” group (Table 2 and Table S1).
Gender, age-group, and district-wise distribution of HCV sero-reactivity in the study population.
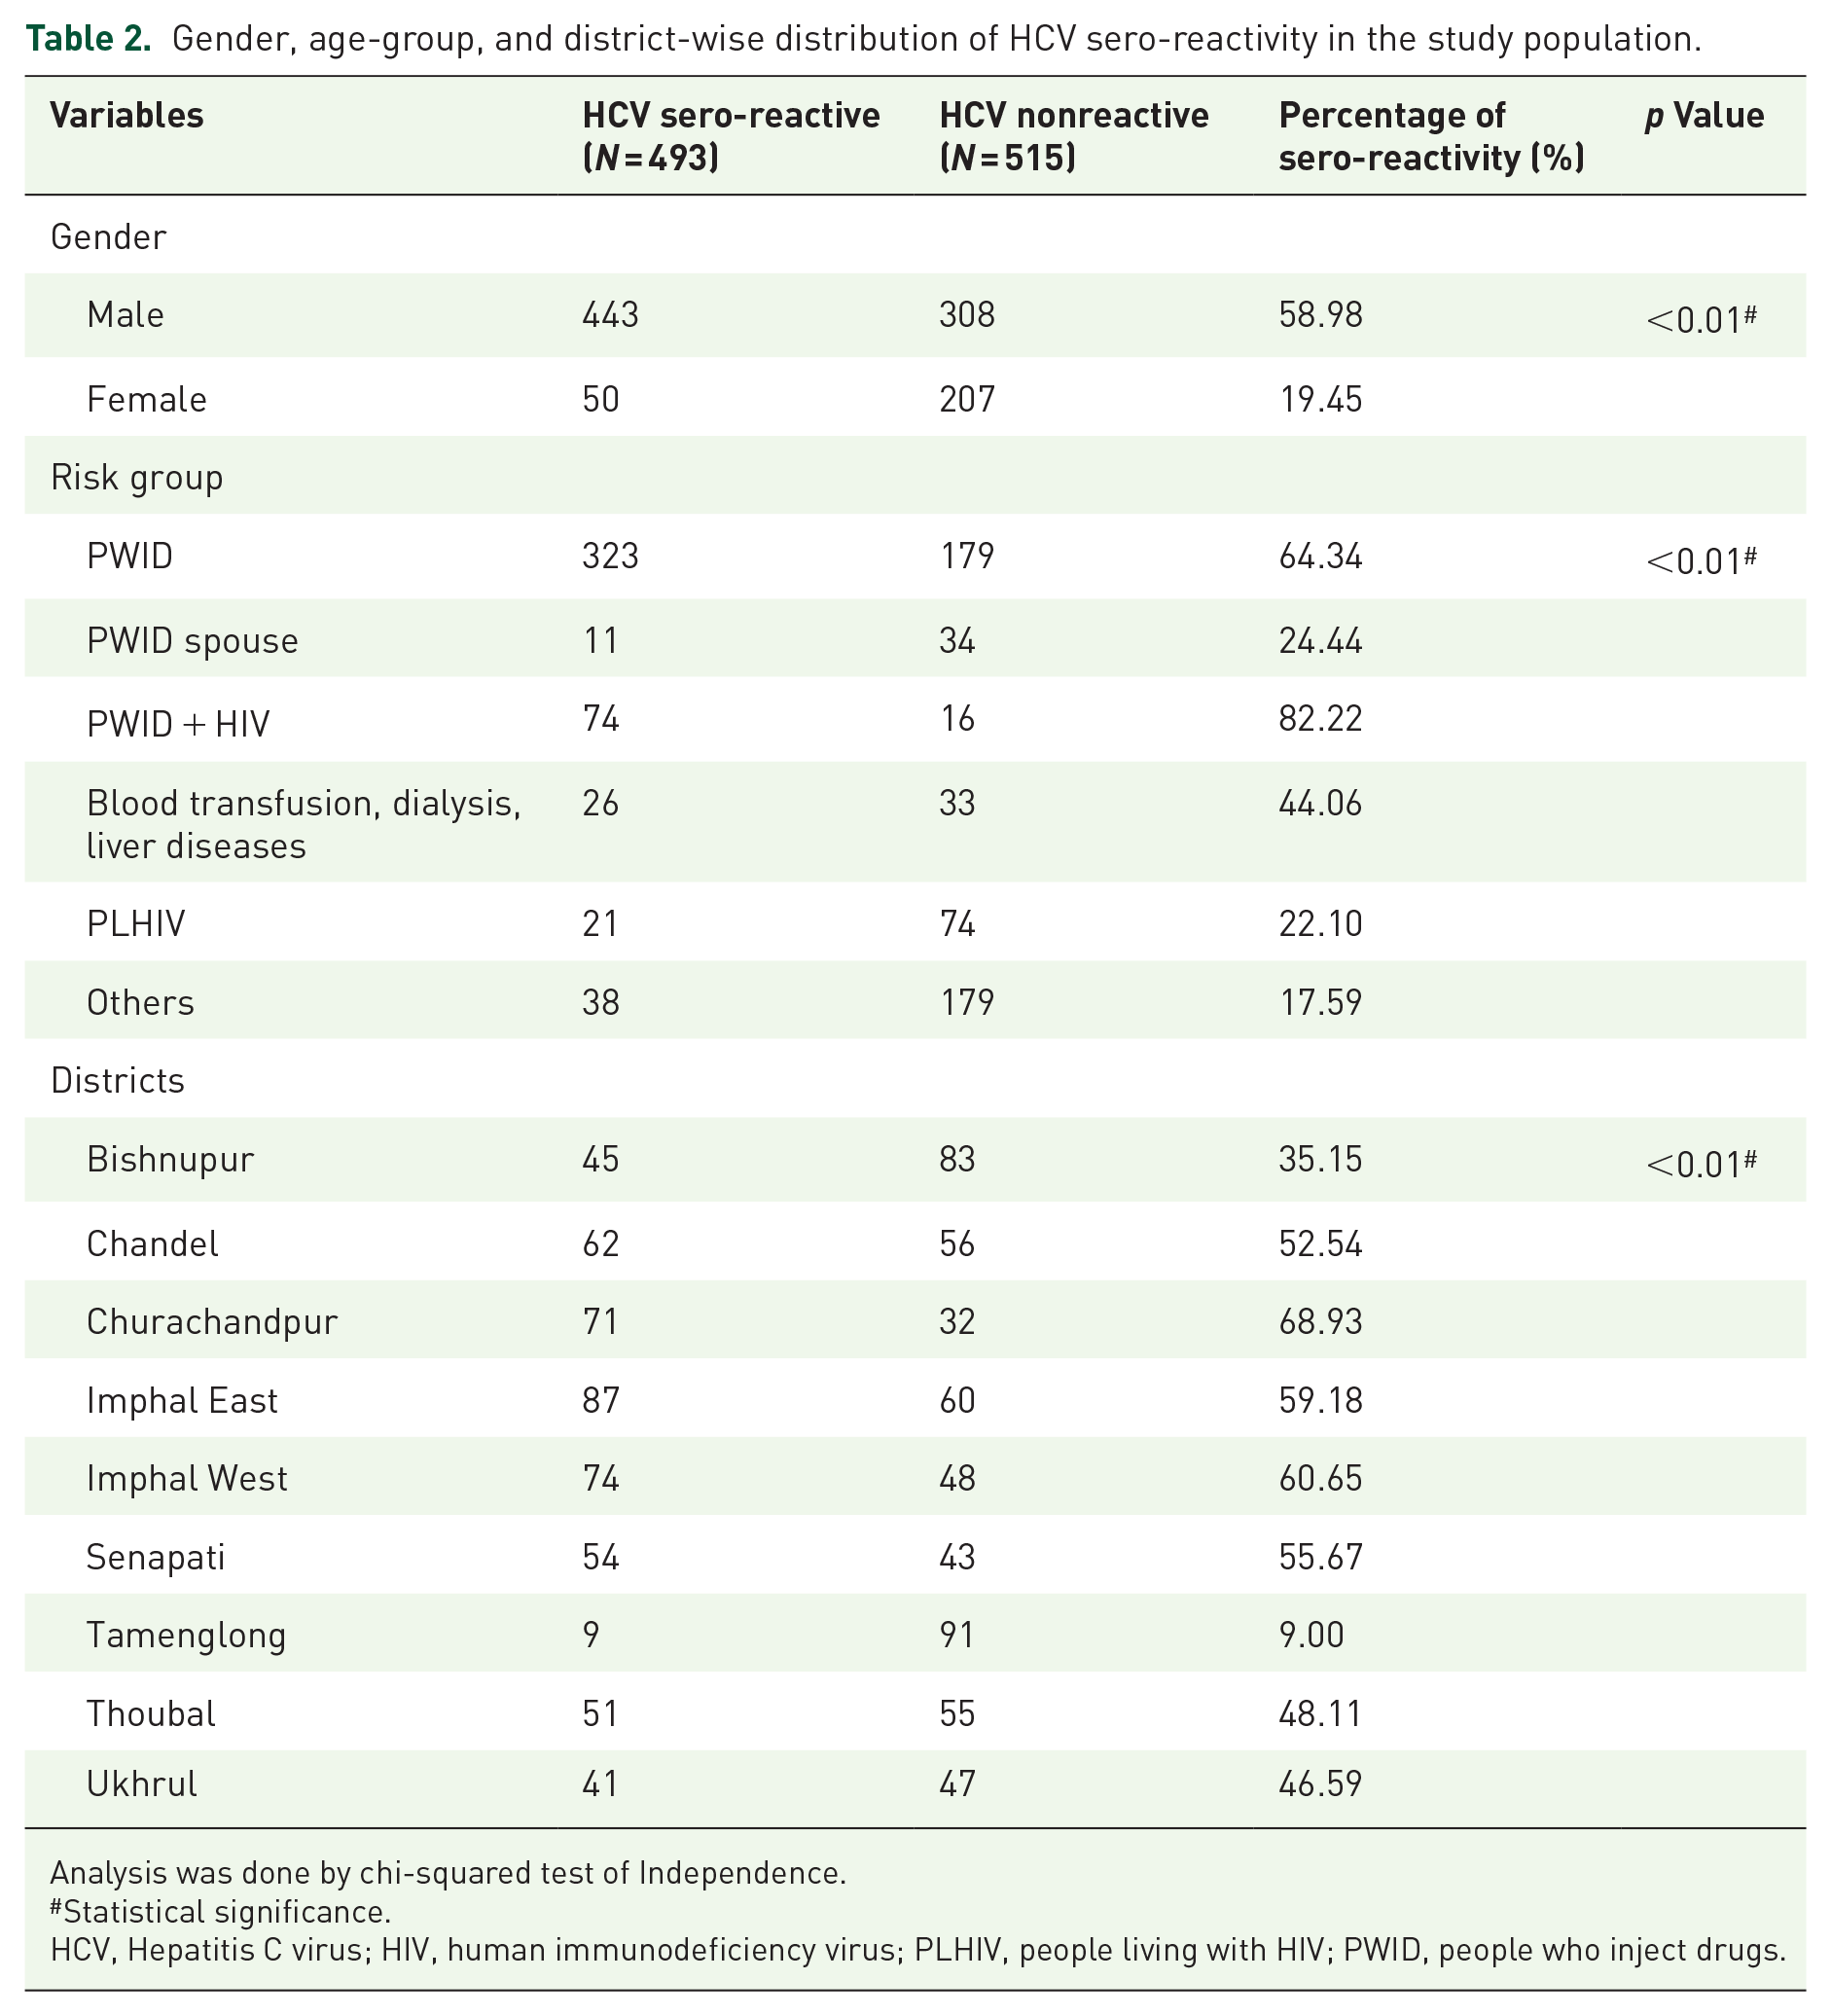
Analysis was done by chi-squared test of Independence.
Statistical significance.
HCV, Hepatitis C virus; HIV, human immunodeficiency virus; PLHIV, people living with HIV; PWID, people who inject drugs.
HCV viral loads
HCV viral loads in plasma were expressed as log10 International Units/ml. The viral loads (mean ± SD) observed among males (5.108 ± 0.50) was greater than that in females (4.892 ± 0.51). The viral loads observed among different subtypes were 5.562 ± 0.29 (1a), 5.695 ± 0.33 (1b), 5.436 ± 0.12 (3b), 5.667 ± 0.12 (3g), 5.721 ± 0.15 (3i), 5.289 ± 0.38 (6n), 5.680 ± 0.19 (6v), and 5.515 ± 0.14 (6xa). With respect to risk factor, viral loads of PWIDs (5.128 ± 0.12) and PWID + HIV (5.077 ± 0.54) groups were slightly higher than PWID Spouse (4.749 ± 0.64) and Blood Transfusion History (BTH), CLD, dialysis (4.939 ± 0.67) category (Table S3).
HCV genotype distribution
Of the 406 HCV RNA-positive samples, 172 partial core and 99 partial NS5B amplicons were sequenced by sanger sequencing. Three major genotypes and eight subtypes were circulating in the population. The circulating genotypes were 1, 3, and 6. More specifically, the following subtypes were found: 1a (6.29%), 1b (5.23%), 3b (36.04%), 3g (4.65%), 3i (7.55%), 6n (20.93%), 6v (2.32%) and 6xa (16.86%) (Figure 1(a)). Paired sequence analysis of core and NS5B regions did not reveal any discordant genotypes. The sequences reported in this study are deposited in GenBank with the following accession numbers: MZ014484-MZ014491, MZ076532-MZ076537, MZ189244-MZ189247, MZ231037-MZ231046, MZ328129-MZ328155, MZ368711-MZ368739 and MZ505084-MZ505099, MZ869831-MZ869834, MZ969640-MZ969645, OM525723-OM525733, OM654278-OM654306, OM654294-OM654301, ON156334-ON156344, ON125365-ON125369.

(a) Bar chart showing the overall distribution of HCV genotypes in our study population. (b) Map showcasing the nine districts (highlighted with colors) that were sampled in our study. Pie charts depict HCV genotype distribution across the districts.
Phylogenetic and phylogeographic analysis
Representative phylogenetic trees for partial core and NS5B (Figure 2(a) and (b)) regions were constructed wherein local isolates clustered with the reference strains used for each genotype. The bootstrap values are shown next to the nodes. MCC trees were constructed for genotypes 1a, 1b, 6n, 6v, 6xa, and 3b for partial core gene using reference sequences from south-east Asian countries (Figure 3(a), (c), (e) and Figures S1(A), S1(C), and S2(A)). All the isolates of genotype 1a clustered with references from Thailand, while 1b isolates clustered with those from Malaysia. Isolates of genotype 3b and 6n clustered with references from Myanmar, while those of 6xa clustered with references from Singapore and Thailand. 6v sequences clustered with those from Thailand. The default rate of substitution is defined against each tree. The spatial diffusion maps generated by SpreaD3 show the path of transmission. The circular polygons of each location depict the local intensity of virus spread at any given time point (Figure 3(b), (d), (f) and Figures S1(D), S2(B)).

(a) Representative phylogenetic tree of 110 partial core sequences. References used are: 1a (M62321; AF511950); 1b (D90208 M58335); 1c (D14853; AY051292); 1d (KJ438768); 1e (KC248194); 1g (AM910652); 1h (KC248198); 1i (KJ439772); 1j (KJ439773); 1k (KJ439774); 1l (KC248193); 1m (KJ439778); 1n (KJ439775); 1o (KJ439779); 2a (AB047639); 2b (AB661382); 2c (JX227949); 2d (JF735114); 2e (JF735120); 2f (KC844042); 2i (DQ155561); 2j (HM777358); 2k (AB031663); 2l (KC197235); 2m (JF735111); 2q (FN666428); 2r (JF735115); 2t (KC197238); 2u (JF735112); 2v (MW041295); 3a (D17763; JN714194); 3b (JQ065709; KC844044; KF292050; D49374); 3d (KJ470619); 3e (KJ470618); 3g (JF735123; JX227954); 3h (JF735121; JF735126); 3i (FJ407092; JX227955); 3k (D63821); 4a (Y11604); 4b (FJ462435); 4c (FJ462436); 4d (DQ418786); 4f (EF589161); 4g (FJ462432); 4k (FJ462438); 4l (FJ839870); 4m (fJ462433); 4n (FJ462441); 4o (FJ462440); 4p (FJ462431); 4q (FJ462434); 4r (FJ462439); 4s (JF735136); 4t (FJ839869); 4v (HQ537009); 4w (FJ025856); 5a (AF064490); 6a (Y12083; AY859526); 6b (D84262); 6c (EF424629); 6d (D84263); 6e (DQ314805); 6f (DQ835760); 6g (D63822); 6h (D84265); 6i (DQ835770); 6j (DQ835769); 6k( D84264); 6l (EF424628); 6m (DQ835763; DQ835765); 6n (DQ278894; EU246937); 6o (EF424627); 6p (EF424626); 6q (EF424625); 6r(EU408328); 6s (EU408329); 6t (EU246939); 6u (EU246940); 6v (EU798761; FJ435090); 6w (DQ278892); 6xa (EU408330; EU408331; EU408332); 6xb (JX183552; KJ567645); 6xc (KJ577651); 6xd (KM252789); 6xe (JX183557); 6xf (KJ562646); 6xg (MH492361); 6xh (MG879000); 6xi (JX183549); 6xj (MZ171127); 7a (EF108306); 7b (KX092342); and 8a (MH590698). The colored symbols next to the taxon labels denote the respective subtypes with respect to the references. (b) Representative phylogenetic tree of 57 partial NS5B sequences. References used are: 1a (M62321; NC_004102); 1b (EU781827); 1c (D14853; AY051292); 1d (KJ439768); 1e (KJ439769); 1g (KJ439770); 1h (KC248199); 1i (KJ439772); 1j (KJ439773); 1k (KJ439774); 1l (KC248197); 1m (KJ439782); 1n (KJ439781); 1o (MH885469); 2a (AB047639); 2b (AB030907); 2c (D50409); 2d (JF735114); 2e (JF735120); 2f (KC844050); 2i (DQ155561); 2j (JF735113); 2k (AB031663); 2l (KC197240); 2m (JX227967); 2q (FN666429); 2r (JF735115); 2t (KC197238); 2u (JF735112); 2v (MW041295); 3a (D17763; AF046866); 3b (JQ065709; D49374); 3d (KJ470619); 3e (KJ470618); 3g (JF735123; JX227954); 3h (JF735121); 3i (FJ407092); 3k(JF735122); 4a (Y11604); 4b(FJ462435); 4c (FJ462436); 4d (DQ418786); 4f (EF589161); 4g (FJ462432); 4k (FJ462438); 4l (FJ839870); 4m (FJ462433); 4n (FJ462441); 6a (AY859526); 6b (D84262); 6c (EF424629); 6d (D84263); 6e (DQ314805); 6f (DQ835760); 6g (D63822); 6h (D84265); 6i (DQ835770); 6j (DQ835769); 6k (D84264); 6l (EF424628); 6m (DQ835767); 6n (DQ278894; EU246937); 6o (EF424627); 6p (EF424626); 6q (EF424625); 6r (EU408328); 6s (EU408329); 6t (EU246939); 6u (EU246940); 6v (EU798761; FJ435090); 6w (EU643834); 6xa (EU408330; EU408331); 6xb (KJ567645); 6xc (KJ567651); 6xd (KM252789); 6xe (KM252792); 6xf (KJ567646); 6xg (MH492361); 6xh (MG879000); 6xi (MZ504973); 6xj (MZ171127); 7a (EF108306); 7b (KX092342); and 8a (MH590698) The colored symbols next to the taxon labels denote the respective subtypes with respect to the references.
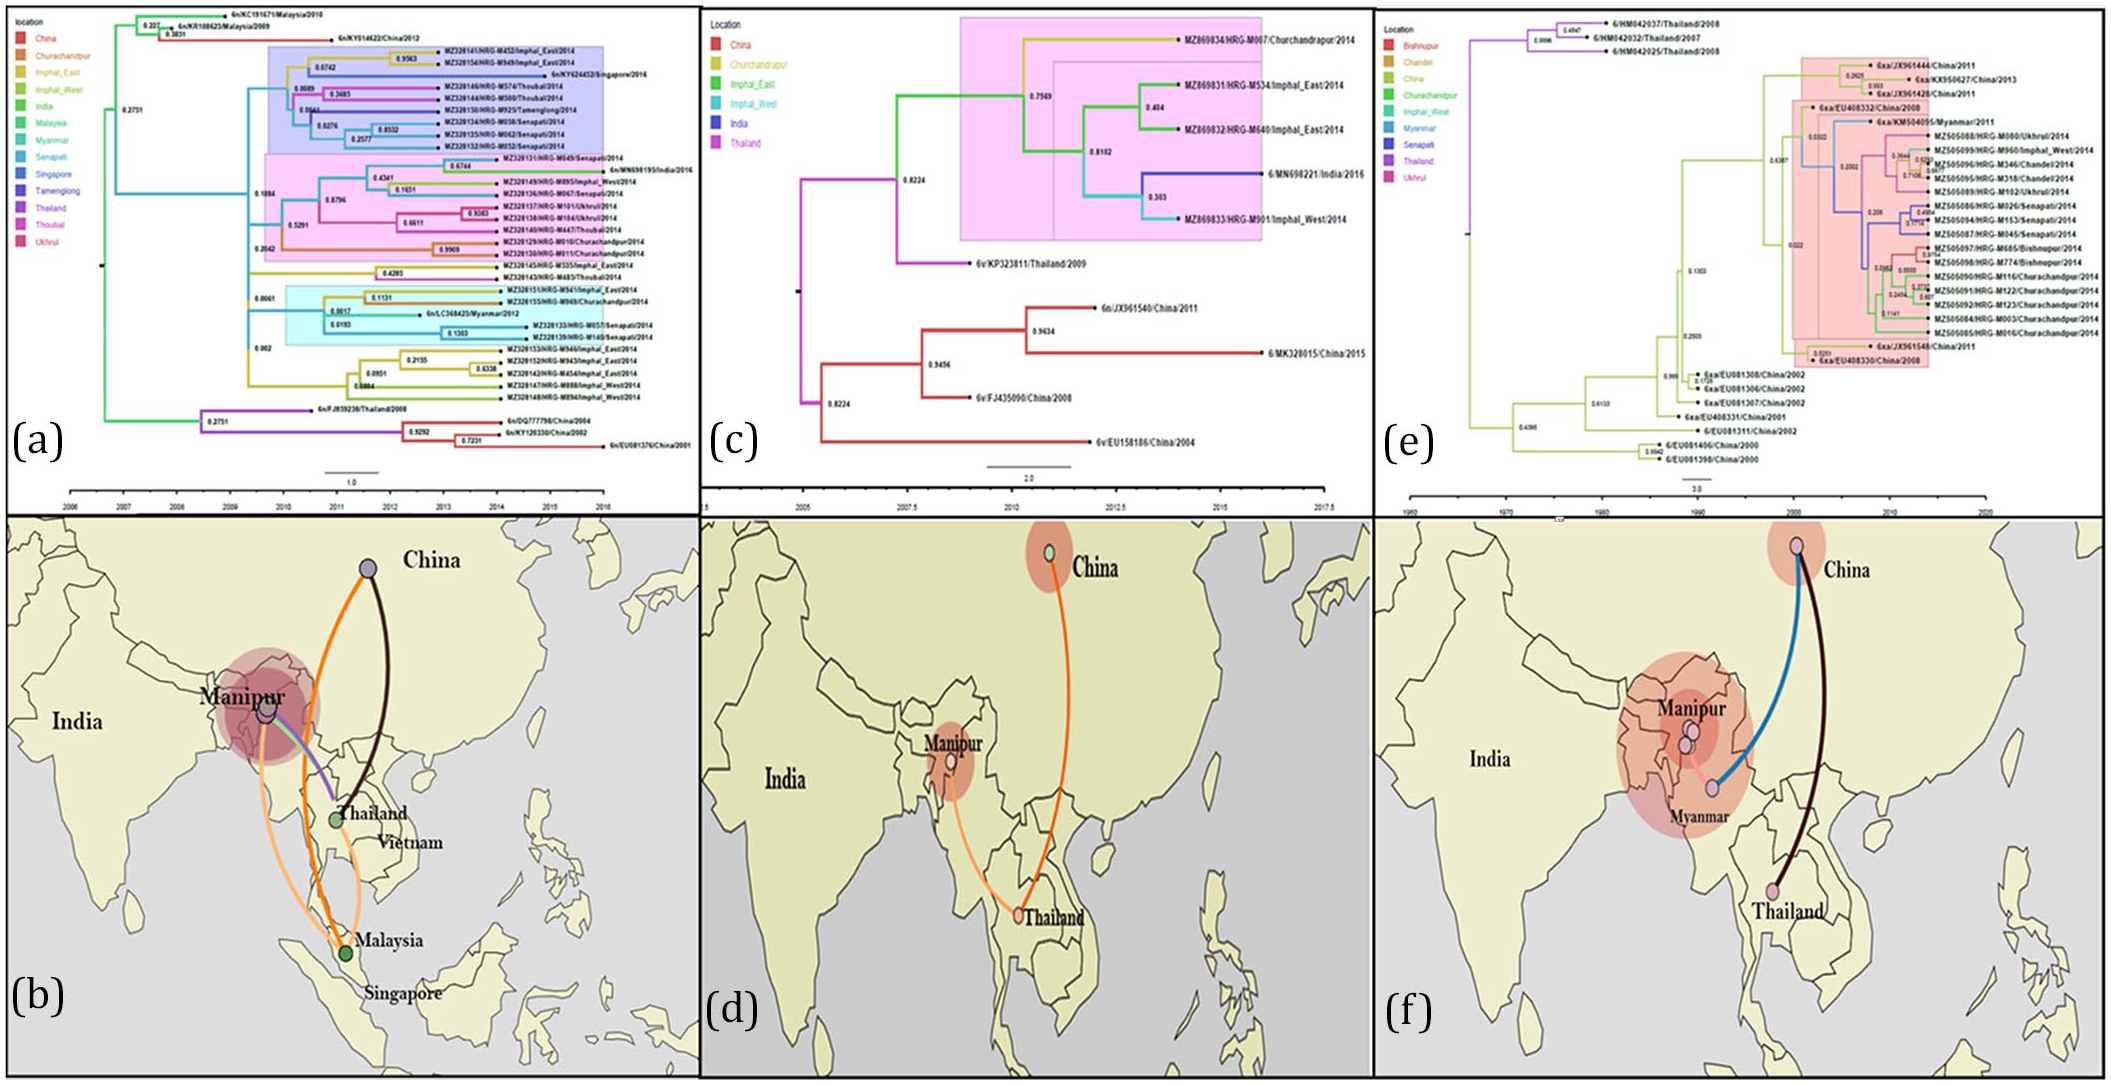
(a) Maximum clade credibility tree of genotype 6n, partial core gene (nucleotides 342–641 of the NCBI reference sequence NC_004102) was constructed using references from China: (KY014622, DQ777798, KY120330, EU081376); Thailand (FJ85928); India (MN698195); Singapore (KY624452); Myanmar (LC368423). The local sequences, annotated with prefix HRG clustered with the strains from Myanmar and Singapore denoted here in blue. (b) Phylogeographic diffusion of genotype 6n strains visualized by Spread3. (c) Maximum clade credibility tree of genotype 6xa, partial core gene (nucleotides 342–641 of the NCBI reference sequence NC_004102) was constructed using references from China: (EU408330, EU408332, JX961444, JX961548, KX950627, JX961428, EU408331, EU081306, EU081307, EU081308, EU081311, EU081406, EU081398); Myanmar (KM504095); Thailand (HM042032, HM042037, HM042025). The local sequences, annotated with prefix HRG clustered with strains from Myanmar and China denoted here in blue. (d) Phylogeographic diffusion of genotype 6xa strains visualized by Spread3. (e) Maximum clade credibility tree of genotype 6v, partial core gene (nucleotides 342–641 of the NCBI reference sequence NC_004102) was constructed using references from China: (EU158186, FJ435090, MK328015); Thailand (HM042037, HM042025); India (MN698221). The local sequences, annotated with prefix HRG clustered with the clade from Malaysia denoted here in blue. (f) Phylogeographic diffusion of genotype 6v strains visualized by Spread3.
Discussion
Globally, most of the studies on PWIDs have estimated the HCV prevalence to be about 50%–90%. 24 HCV-HIV coinfection rates among PWIDs are also high and a cause for concern as co-infection is more debilitating than mono-infection. 25 HCV impacts the survival of PLHIVs by interfering with the action of antiretroviral therapy (ART) and enhances liver damage and cirrhosis. 26 HCV disease progression is accelerated in people with HIV, because of the hepatotoxicity caused by ART. 25 In this study, 95 individuals were PLHIVs and 90 individuals were intravenous drug users living with HIV (PWID + HIV). Through this study, we aim to understand how different risk factors increase the chance of an active HCV infection. Intravenous drug usage is generally more common in males than in females. 7 In this study, a similar observation was noticed, wherein, males showed more drug usage than females (p-value < 0.01) (Table 1). Across different age groups, it was observed that risk behavior does vary (p-value < 0.01).
Previously, many studies have established that intravenous drug injection is a potent means of acquiring HCV infection. 16 In this study, the highest HCV sero-reactivity was observed among PWID + HIV (82.22%). This group was heavily dominated by males (95.61%). The PWID spouse (n = 45) subgroup consisting mostly of females (95.55%) showed HCV sero-reactivity of 24.44%. A study involving 600 spouses of Chronic Hepatitis C patients reported that 2% of them became positive for anti-HCV. 27 HCV is a well-known TTI (Transfusion Transmissible Infection). 28 Moderately high HCV sero-reactivity was observed among the blood transfusion, dialysis, and liver disease subgroup population (44.06%). Overall, HCV sero-reactivity is heavily influenced (p-value < 0.01) by the involvement of risk factor (Table 2). With respect to gender, higher HCV sero-reactivity was observed among males (58.98%) than in females (19.45%) (p-value < 0.01). This might be the result of the contrast in risk behavior (Table 1). HCV viremia, on the contrary, does not vary significantly across risk groups (p-value: 0.53) (Table S1).
It was observed that chances of acquiring HCV infection in individuals living with HIV increased almost four times (22.10% in PLHIVs and 82.22% in PWID + HIV) if they kept injecting drugs (Table 2). PWID + HIV also showed the highest viremia among all other risk groups (90.54%) (Table S1). This calls for better reach of opioid substitution therapies (OST) and needle syringe programs. A harm reduction initiative in Manipur and Nagaland not only reports substantial outcomes of OST but also reports several cases of therapy dropout. 29 There is a lack of awareness among PWIDs about their HIV sero-status and only 18% HIV-positive PWIDs are on ART in Asia. 30
In cross-border transmissions, proximity to shared borders is a determining factor for disease spread. There are 16 administrative districts in Manipur and blood samples for this study were received from 9 of them. While Churachandpur, Chandel, Ukhrul, Senapati, and Tamenglong lie in hilly areas, Bishnupur, Thoubal, Imphal East, and Imphal West lie in valley regions. 31 Risk behavior across the nine districts showcased a stark variation where more drug usage was observed in the districts of Imphal East, Imphal West, and Thoubal (p-value < 0.01). The highest HCV sero-reactivity was observed in Churachandpur (68.93%) which interestingly shares international borders with Myanmar. The lowest HCV sero-reactivity was observed in the Tamenglong district (9.00%) which lies internally and shares borders with Assam and Nagaland away from international borders. Moderately high HCV sero-reactivity was observed in Imphal East (59.18%) and Imphal West (60.65%) although they do not share international borders (p-value < 0.01) (Table 1). HCV viremia did vary across the nine districts, the highest being in Imphal West (90.41%) and the lowest in Tamenglong (44.44%) (p-value: 0.018) (Table S1).
HCV genotypes are genetically diverse, genotype 6 being the most diverse having 33 subtypes to date. 4 A previous study from this laboratory involving PWID participants from Manipur in 2007 reported that genotype 3 (54.79%) was the prevalently circulating genotype followed by genotype 1 (31.50%) and 6 (13.68%). 17 This study reveals a shift in the genotype distribution pattern. Although genotype 3 (47.67%) is still the major circulating genotype, there is a significant increase in genotype 6 (40.11%) and it seems to be rapidly replacing genotype 1 (11.62%). It was also observed that HCV genotypes did not vary among the different districts of isolation (p-value: 0.17) (Figure 1(b)) but differed among the two genders (p-value: 0.01) and risk categories (p-value: 0.03) (Table S2).
There has been documentation of genotype 6 in Manipur and other north-eastern states of India like Mizoram and Meghalaya. 32 In our previous study of Manipur, HCV subtypes 6h and 6k were found to be in circulation in low numbers. 17 The three prevalent subtypes identified in this study, 3b (36.04%), 6xa (16.86%), and 6n (20.93%), have made their way through cross-border transmission. Phylodynamic reconstruction of each genotype revealed their route of migration. In case of subtype 6xa, it has originated from Thailand, migrated to Malaysia, and finally entered Manipur through the porous border shared with Myanmar. HCV subtype 6n isolates cluster with strains from Myanmar.
Genotype 3a, otherwise prevalent in eastern India has completely effaced from the circulation. Among genotype 3 variants, subtype 3b continues to predominate and its phylodynamic reconstruction revealed that it originated from China and made its way into India through Myanmar.
This study has highlighted interesting observations about the genotype distribution of HCV among high-risk groups and their cross-border transmission but has certain limitations. The Manipuri population is comprised of almost 35 ethnic tribes, having a high predominance of intravenous drug use. Unfortunately, the ethnicity of our participants is not known. The participants (N = 1008) enrolled in this study were screened for HCV sero-reactivity and further observations were made based on this sample size. Since we performed no additional sample size calculation, the results are not representative of the state of Manipur. Another caveat is a lack of information regarding the type, duration, and pattern of drug usage. Lastly, a dearth of reference sequences, especially of genotype 6 may have led to a biased approach to their Bayesian inference of phylogeny.
Conclusion
This is one of Manipur’s largest HCV genomic diversity studies, involving over 1000 participants. This cross-sectional study evaluated the impact of specific risk factors that increase susceptibility to HCV acquisition and influence the distribution of genotypes and subtypes of this hepatotropic virus. The analysis of risk factors associated with infection spread gives us an idea about the potency of each mode of transmission. The study revealed the circulation of three HCV genotypes (1, 3, and 6) and eight subtypes (1a, 1b, 3b, 3g, 3i, 6n, 6v, and 6xa). Furthermore, a shift in the genomic distribution was observed where genotype 6 outnumbered genotype 1. The results provide new insights into the HCV genomic diversity scenario of Manipur. Strengthening intervention of proper measures to prevent injection-drug use-influenced HCV, as well as HIV, is of utmost importance.
Supplemental Material
sj-docx-1-tai-10.1177_20499361251351302 – Supplemental material for Emergence of HCV genotype 6 and its new variants among intravenous drug users in Manipur, a north-eastern state of India
Supplemental material, sj-docx-1-tai-10.1177_20499361251351302 for Emergence of HCV genotype 6 and its new variants among intravenous drug users in Manipur, a north-eastern state of India by Raina Das, Supradip Dutta, Sagnik Bakshi, Aritra Biswas, Shreyasi Nath, Moumita Majumdar, Priya Verma, Upasana Baskey, Shanta Dutta and Provash Chandra Sadhukhan in Therapeutic Advances in Infectious Disease
Supplemental Material
sj-docx-2-tai-10.1177_20499361251351302 – Supplemental material for Emergence of HCV genotype 6 and its new variants among intravenous drug users in Manipur, a north-eastern state of India
Supplemental material, sj-docx-2-tai-10.1177_20499361251351302 for Emergence of HCV genotype 6 and its new variants among intravenous drug users in Manipur, a north-eastern state of India by Raina Das, Supradip Dutta, Sagnik Bakshi, Aritra Biswas, Shreyasi Nath, Moumita Majumdar, Priya Verma, Upasana Baskey, Shanta Dutta and Provash Chandra Sadhukhan in Therapeutic Advances in Infectious Disease
Footnotes
Acknowledgements
We thank all our participants for their contribution to this study. We are also thankful to the Indian Council of Medical Research (ICMR) for providing the infrastructure necessary to perform this study.
Declarations
Supplemental material
Supplemental material for this article is available online.
References
Supplementary Material
Please find the following supplemental material available below.
For Open Access articles published under a Creative Commons License, all supplemental material carries the same license as the article it is associated with.
For non-Open Access articles published, all supplemental material carries a non-exclusive license, and permission requests for re-use of supplemental material or any part of supplemental material shall be sent directly to the copyright owner as specified in the copyright notice associated with the article.