
Abstract
Background:
Drug-induced cognitive disorder (DICD) is a harmful adverse event influenced by individual factors such as age, gender, and weight. These characteristics make regression models with drug selection, such as Lasso regression, more appropriate than disproportionality analysis for mining the FDA Adverse Event Reporting System (FAERS) data. However, focusing solely on the drugs with the highest risk signals may underestimate the drugs with moderate risk signals.
Objectives:
To develop a novel method for evaluating drug-associated DICD risk signals that addresses key limitations of existing approaches—specifically, the underestimation of drugs with non-top risk signals and the challenges posed by sparse data across numerous candidate drugs.
Design:
An agglomerative clustering-based model (ACM) was developed to stratify drugs by risk signals of DICD, and its performance was compared with conventional Lasso logistic regression.
Methods:
In the ACM, drugs with similar risk levels were grouped into clusters, preserving information by avoiding the exclusion of drugs with moderate risk signals. Model performance was assessed using both receiver operating characteristic analysis and decision curve analysis.
Results:
The ACM model outperformed Lasso logistic regression. Finasteride was identified in the first cluster of DICD risk signals, consistent with Lasso regression. However, Carbidopa/Levodopa, Topiramate, and Clonazepam were identified in the second cluster of DICD risk signals, which were not detected by Lasso regression.
Conclusion:
By moving beyond an exclusive focus on drugs with top risk signals, the ACM workflow demonstrated superior predictive performances and provided a more comprehensive assessment of drug-related risk signals. This approach facilitates the detection and evaluation of drugs with moderate risk signals, enhancing their applicability in clinical practice.
Plain language summary
This study focuses on Drug-induced Cognitive Disorder (DICD), a harmful side effect affecting patients’ quality of life. Traditional methods often overlook the drugs with moderate risk signals. To address this gap, we developed agglomerative clustering-based model (ACM) to better assess drug-related risk signals in the FAERS database.
ACM groups drugs into different risk levels based on similarities in DICD risk signals, improving accuracy compared to older methods like Lasso regression. Finally, the study identified Finasteride in the first cluster of DICD risk signals, confirming previous findings. Importantly, it also flagged Carbidopa/Levodopa, Topiramate, and Clonazepam in the second cluster of DICD risk signals, which were missed by Lasso regression.
ACM outperformed Lasso regression in estimating DICD risks and provided a more comprehensive tool for clinicians. By highlighting both drugs with high risk signals and moderate risk signals, this approach supported safer prescribing practices. Future studies could explore how these findings impact patient care and drug development.
Keywords
Introduction
In recent years, drug-induced cognitive disorder (DICD) has attracted significant attention from healthcare professionals, patients, and regulatory agencies. 1 Cognitive disorders, ranging from mild cognitive decline to severe dementia, can significantly impact patients’ quality of life and functional independence. Moreover, some drugs may cause DICD gradually over time, making it difficult to detect during phase II and III clinical trials 2 due to the limited follow-up period. Given that DICD represents a slow, drug-related process, 3 it necessitates a prolonged observational period—an approach that is particularly amenable to implementation through post-marketing surveillance. As a result, post-marketing drug surveillance has become increasingly important in identifying drugs that pose a risk of DICD as a complementary measure. The Adverse Event Reporting System (AERS) databases like the FDA Adverse Event Reporting System (FAERS) database, the Vigibase database of World Health Organization, the Europe’s Eudravigilance, and others play a crucial role in post-marketing drug surveillance by promptly collecting Adverse Drug Reaction (ADR) reports and identifying adverse event (AE) signals.
Disproportionality analysis is widely used to detect AE-drug signals and identify drugs associated with DICD risk.4,5 However, cognitive disorders are influenced by factors such as age and gender, which can introduce biases into disproportionality measures since these individual factors are not accounted for. Therefore, in this study, regression models incorporating gender, weight, and age as covariates were used to evaluate the risk of DICD associated with various drugs.
Regression models have been validated as an effective approach for identifying risky drugs in the FAERS database while controlling for individual effects.6–8 In logistic regression models, the inclusion of drugs results in a large-scale set of sparse dummy variables, necessitating an effective dimension-reduction method. Lasso logistic regression has been employed to reduce the dimensionality of these sparse variables, yielding models with strong predictive performance. 9 In addition, machine learning methods are increasingly being applied to FAERS data mining. 10 However, current machine learning approaches for identifying drugs associated with specific AEs primarily focus on the drugs with the highest risk signals, limiting their applicability in clinical practice. Specifically, drugs that do not rank among the drugs with the highest risk signals for DICD should not be assumed to be free of risk signals. Models that only report the drugs with the highest risk signals may underestimate the drugs with moderate risk signals, because drugs with moderate risk signals were excluded from these models.
This challenge has highlighted the need for a comprehensive model that not only includes the drugs with the highest risk signals but also provides a graded assessment of all potential risky drugs. Such a model would enable the creation of a risk grading table for clinical practice, allowing healthcare providers to assess the relative risk of DICD for each drug and make informed decisions to mitigate the DICD risk.
Therefore, in this study, we propose an agglomerative clustering-based model (ACM) to classify drugs associated with DICD risk. This modeling strategy clusters all potential risky drugs into different risk levels instead of focusing solely on the highest risk drugs. ACM offers a more comprehensive overview, enabling the identification of DICD risk levels for each drug in a systematic and informative manner.
Methods
Preliminary signals detection
This study was a retrospective analysis based on the FAERS database. Data were extracted from the FAERS database, which spanned from the first quarter of 2004 to the third quarter of 2024. The dataset comprised the following types of data:
DEMO: Contains patient demographic and administrative information, with a single record for each event report.
REAC: Includes all Medical Dictionary for Regulatory Activities (MedDRA)-coded terms for reported AEs.
DRUG: Provides drug/biologic information for all medications reported in connection with the event.
OUTC: Details patient outcomes related to the event.
RPSR: Indicates the sources of event reports.
THER: Records the start and end dates of drug therapies for the reported medications.
INDI: Lists all MedDRA-coded terms for indications and diagnoses associated with the reported drugs.
Following the FDA’s recommendations, duplicate records were removed. If multiple records shared the same case ID, only the record with the most recent FDA date (fda_dt) and the highest primary ID was retained. A secondary de-duplication process was performed to eliminate any remaining records with identical primary IDs.
AEs listed in the REAC file were coded using preferred terms (PTs) according to the MedDRA, version 27.1. “Cognitive Disorder” was selected as the research term for this study. Drugs associated with DICD were categorized based on their roles—primary suspect, secondary suspect, concomitant, or interaction. Cases were included in the analysis only if the drug was listed as the primary suspect for DICD. Finally, records lacking complete data on age, gender, or weight were excluded from the analysis. Records with an age over 100 years or a weight larger than 150 kg were removed.
A preliminary signal detection was conducted using disproportionality analysis, which was based on a two-by-two contingency table, as shown in Table 1.The ROR is calculated as

Two-by-two table is used in disproportionality analysis.

The drugs preliminarily identified were selected based on the following criteria:
The lower bound of the reported odds ratio (ROR) was greater than 1.
The drugs with only a few records may cause the model to deteriorate. To improve the stability of the logistic regression model, the number of reported cases was greater than 200.
The p value, adjusted using the Bonferroni correction in both the Chi-square test and Fisher’s exact test, was less than 0.05.
The reporting of this study based on the FAERS database conformed to the READUS-PV statement 11 (See Table S1).
Agglomerative clustering-based model
To reduce model complexity, ACM was developed to perform dimensionality reduction in the FAERS database mining process by grouping drugs with similar risk levels into clusters. Ultimately, numerous isolated risky drugs were consolidated into a few distinct risk grades.
The ACM process began by transforming all preliminary risk-signal drugs, identified using the ROR from Section “Preliminary signals detection,” into dummy variables to construct an initial full logistic regression model. This model also included patient demographic factors such as gender, age, and weight. Initially, each preliminary risk-signal drug was treated as an independent cluster.
The clustering process proceeded as follows:
Clusters with the greatest overlap in their 95% CIs were merged into a single cluster. The 95% CI overlap was calculated as the difference between the upper limit of the smaller coefficient and the lower limit of the larger coefficient. The overlap of CIs was calculated for each pair of these drugs, and the two drugs with the largest overlap were merged. Only one pair was merged per iteration.
The logistic regression model was updated after each merging step.
The agglomerative clustering process continued until the 95% CIs of the coefficients for all clusters no longer overlapped.
By merging drugs with similar coefficient values in the logistic regression model, the drugs were classified into various risk grades. The workflow of the entire clustering process is illustrated in Figure 1.

The workflow of the ACM construction.
The Akaike information criterion (AIC) was used to select the optimal ACM. The lower AIC value indicated the better model. When the AIC values were close among models, we suggested to select the simplest model.
For comparison, a Lasso regression model was also constructed, with hyperparameter selection performed using 10-fold cross-validation. The performance of ACM family and Lasso family was evaluated using the receiver operating characteristic (ROC) curve and the decision curve analysis (DCA) curve. In cross-validation, the hyperparameter tuning (such as cluster of number in ACM and lambda in Lasso) was performed on the train-folds, and the test-folds were only used for prediction. The ROC and DCA were constructed by the predictions in test-folds in each iteration. Both the ACM and the Lasso regression models were adjusted by gender, age, and weight of the patients. All the indications were transformed from PTs into high-level group terms (HLGTs) by MedDRA version 27.1. The indications were also used to adjust the model in both the ACM and the Lasso regression models. Due to the PT of indications being too minute to be used as covariates, we transform the PT into HLGT. In this study, the top 15 HLGT of indications covered 81.5% records, so the top 15 were used as covariates.
Statistical analysis
Data cleaning and disproportionality analysis were conducted using the R software (version 4.2.2). Lasso logistic regression models were implemented using the glmnet package (version 4.1-6). A p value less than 0.05 was considered statistically significant.
Results
Preliminarily risky drugs
In all, 21,838,627 AE reports were found from 2004Q1 to the 2024Q3 in the FAERS database. After the removal of the replicated AE reports based on Section “Preliminary signals detection,” a total of 18289374 AE reports were retained. A total of 1251 drugs were initially identified as primary suspects for DICD from these 40,665 AE reports. Following preliminary signal detection using disproportionality analysis as described in Section “Preliminary signals detection,” 32 drugs were selected as the preliminary risk-signal drugs, as shown in Figure 3. The 2,053,657 AE reports associated with the 32 preliminary risk-signal drugs were extracted to construct the logistic regression model. Before constructing the logistic regression model, the reports were removed if they lacked complete information (about gender, weight, age, or indications), had a weight of >150 kg, recorded gender other than male/female, or recorded age <1 year. Finally, 173,600 AE reports were retained. The basic information of these patients is shown in Figure 4 and Table 2. As a result, the top 15 indications covered 81.5% of the reports. Therefore, it was reasonable to remove the other indications. All of the steps of data cleaning were shown in Figure 2.
Demographic information of the data used to construct the ACM model.

ACM, agglomerative clustering-based model.

Workflow of data cleaning before ACM model construction.

Volcano plots of drugs with risky signal for DICD; ROR; p adjust, p value after Bonferroni correction.
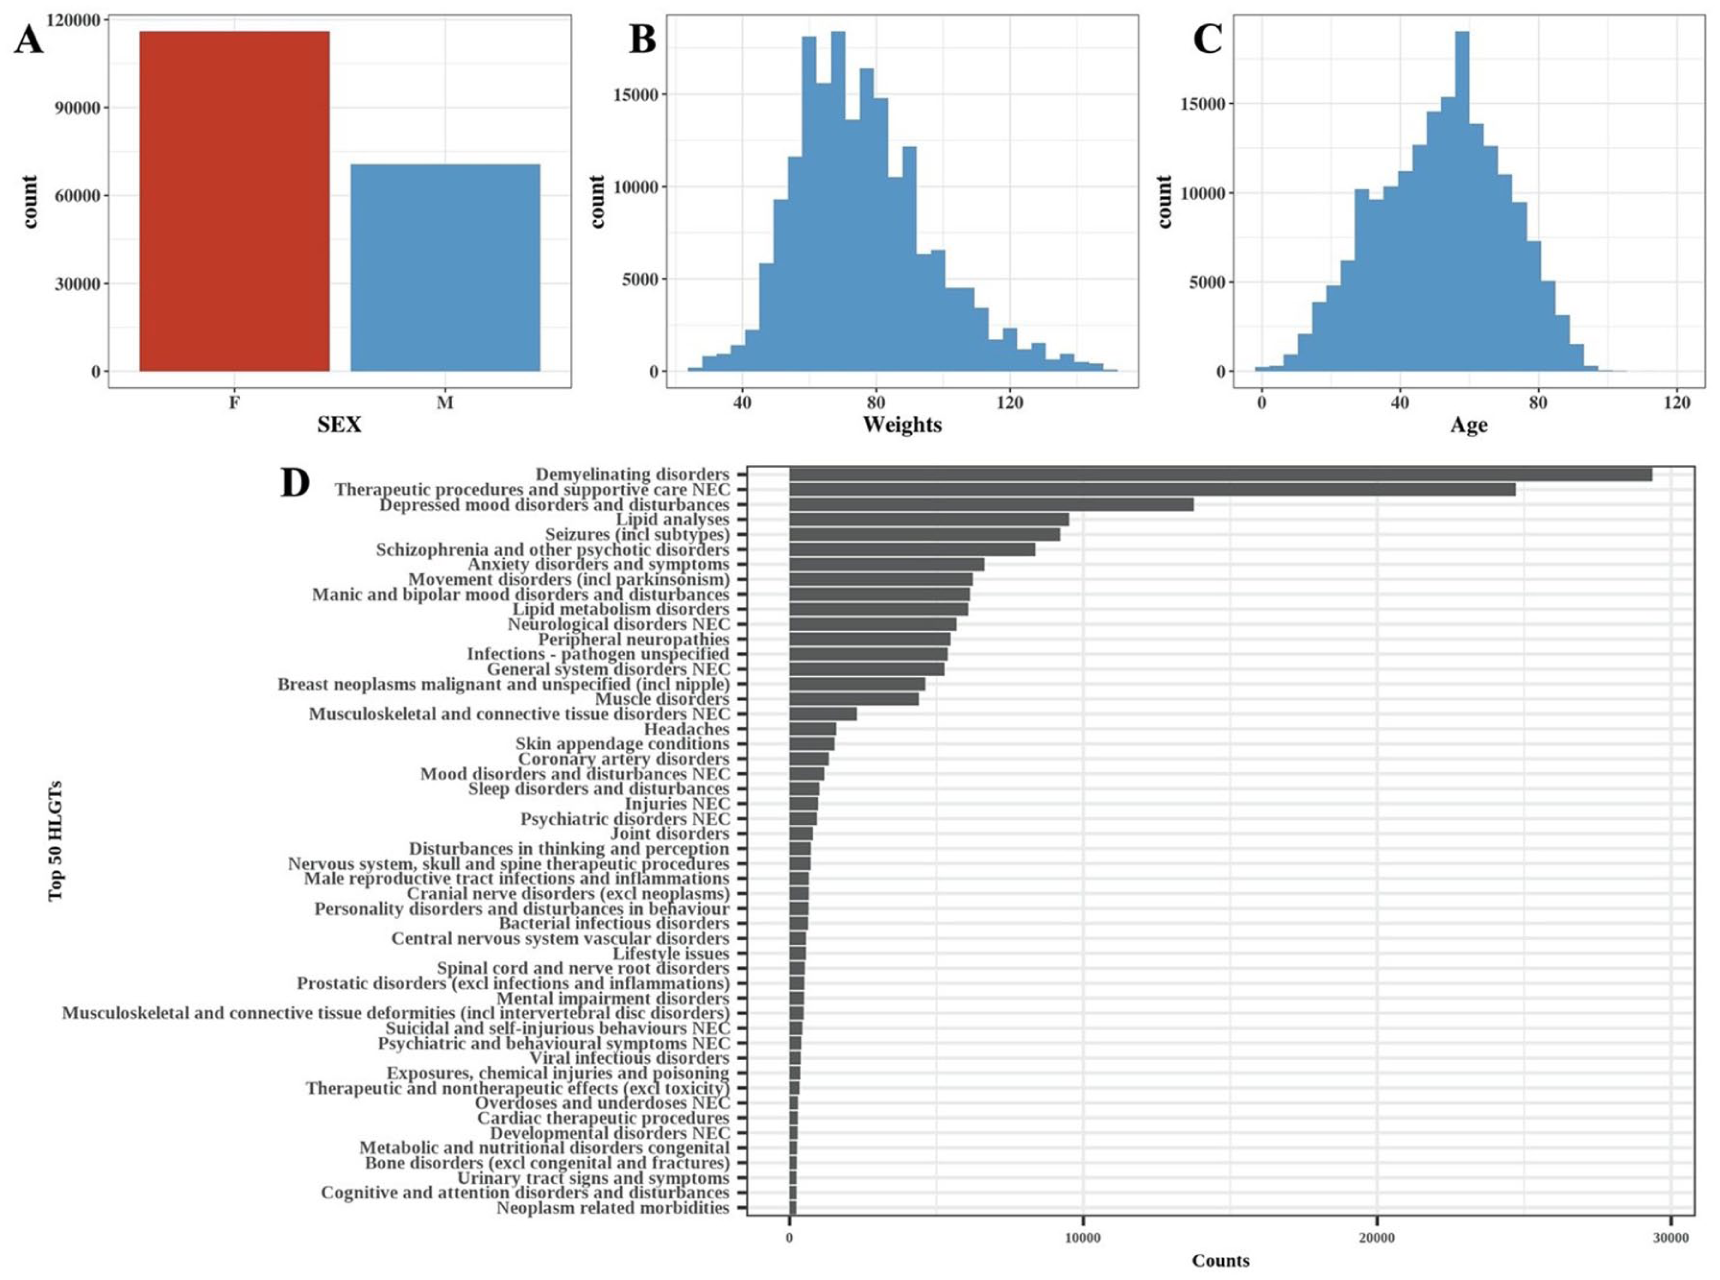
Basic information of patients: (a) Gender distribution, (b) weight distribution, (c) age distribution, and (d) counts of the top 50 HLGs of indications.
Results of ACM
As shown in Figure 5, the AIC value decreased as the risk-signal drugs were progressively clustered into fewer groups. As a result, the AIC values were close for 5–8 clusters. Thus, the final model was determined when the number of clusters was 5 because it was the simplest model with lowest AIC criteria (Figure 6).

AICs within the process of ACM. To provide a holistic assessment of DICD risk, the results of the best ACM model were visualized in Figure 6. The identified drugs were classified into five distinct risk-signal levels for DICD.

Results of the agglomerative clustering-based model and the Lasso regression model.
For the Lasso regression model, the optimal hyperparameters were selected using 10-fold cross-validation. The results of this process are presented in Figures S1 and S2.
Notably, Finasteride was identified as a drug in the first cluster of DICD risk signals both in the ACM and the Lasso regression models. However, the Lasso logistic regression model retained only the highest risk-signal drug, potentially overlooking drugs with moderate (non-top) risk signals. By contrast, the ACM successfully identified and categorized several drugs in the second cluster of DICD risk signals, including Carbidopa/Levodopa, Topiramate, Clonazepam, and Pimavanserin. The drugs in other risky-signal clusters were also graded but not listed here due to space limitations.
Performance of the models
The ROC curve, constructed using 10-fold cross-validation, was employed to compare the ability of signal evaluation of the models. As shown in Figure 7, the AUC for the ACM was significantly higher than that of the Lasso logistic regression model (Z = 12.061, p value <0.001).

(a) ROC curves of the Lasso regression model and ACM. (b) DCA curves of the Lasso regression model and ACM.
In addition, DCA was also performed to further evaluate the discrimination ability of DICD signals from ACM. The results indicated that the ACM consistently outperformed the Lasso regression model across a range of threshold probabilities.
Discussion
DICD is considered a harmful AE that impairs the quality of life and functional independence of patients. Post-marketing drug surveillance for DICD, based on the FAERS database, plays a crucial role in drug safety monitoring. However, DICD is influenced by factors such as age, gender, and weight, which can introduce potential biases in disproportionality analysis. While logistic regression models account for these individual effects, the complex, sparse dummy variable structure can limit their application in FAERS data mining. The Lasso regression framework has been validated as an effective method for reducing the complexity of sparse dummies. However, Lasso regression tends to exclude drugs with lower or moderate risk signals for DICD, leading to the potential underestimation of these drugs with moderate risk signals.
In this study, we designed the ACM to categorize all potential risky drugs for DICD into a range of risk grades. The results showed that Finasteride, identified as a drug in the first cluster of DICD risk signals, was consistently recognized in both the ACM and the Lasso regression models, highlighting the ACM’s ability to identify drugs with high-risk signals. Furthermore, ACM also identified drugs such as Carbidopa/Levodopa, Topiramate, Clonazepam, and Pimavanserin in the second cluster of DICD risk signals that were excluded by the Lasso regression model. This demonstrated that the ACM provided more comprehensive information than Lasso regression. In addition, both the ROC and DCA analyses indicated the ACM outperformed the Lasso regression model. However, our model was designed for signal stratification rather than clinical prediction, so the ACM was not suggested in clinical prediction.
Finasteride was selected in the first cluster of DICD risk signals by both the ACM and the Lasso regression model. This finding aligns with previous reports, confirming its association with DICD in both post-marketing surveillance using the FAERS database 12 and a survey study involving 131 generally healthy men. 13 Carbidopa/Levodopa was identified in the second cluster of DICD risk signals by the ACM, though it was excluded in the Lasso regression model. A retrospective observational study in Japan has shown that Levodopa treatment is associated with DICD, 14 and a data mining study focusing on electronic health records identified Levodopa as a high-hazard drug linked to Alzheimer’s disease. 15 This supports the notion that Levodopa is indeed related to DICD.
Similarly, Topiramate, which was also identified in the second cluster of DICD risk signals by the ACM, has been reported to cause memory impairment and cognitive dulling in review studies. 16 A systematic review also indicated that Topiramate’s risk of DICD was significant across all trials, though not significant in epilepsy trials. 17 Clonazepam has been shown to cause AEs, including DICD, sleep disorders, and exacerbation of mood and anxiety disorders. 18
When comparing the first and the second clusters of DICD risk signals, it is important to note that DICD is often considered a part of Post-Finasteride Syndrome, 19 but is only specifically associated with Carbidopa/Levodopa, Topiramate, and Clonazepam—not typically classified as a standalone AE. Therefore, the risk signals associated with Finasteride (the first cluster of DICD risk signals) were higher than those of Carbidopa/Levodopa, Topiramate, and Clonazepam, which were categorized in the second cluster of DICD risk signals. This confirms that the grading for risk signals proposed by the ACM was reasonable and consistent with clinical findings. Besides, the drugs with lower risk signals of DICD were also graded instead of being removed directly, as with Lasso regression. Thus, the ACM framework, as designed in this study, was proven to be more informative than the models focusing solely on top risk drugs. However, our conclusion was based on pharmacovigilance signals rather than clinical evidence. It should be emphasized that no direct evidence supporting the DICD risk of Finasteride was higher than that of other drugs.
Moreover, the biological relationship between Finasteride and DICD has been supported by animal experiments, which suggest that 5α-reductase inhibitors like Finasteride alter acetylcholinesterase activity, potentially leading to DICD. 20 However, the mechanisms for drugs identified in the second cluster of DICD risk signals, such as Carbidopa/Levodopa, Topiramate, and Clonazepam remain unclear. These drugs affect the central nervous system, which could contribute to DICD, although the strength of this effect may vary based on individual sensitivity. Thus, these drugs were appropriately clustered into the second cluster of DICD risk signals by the ACM framework.
Limitations
Limitations of the ACM framework should also be considered. First, the data were derived from the FAERS database, which is subject to underreporting, duplicate reports, and inaccuracies due to the self-reporting nature of the system. Thus, our model can only estimate the relative risk via risk-signals rather than the absolute risk level. Second, the incompleteness of certain data in the FAERS database, such as information on drug dosages or preexisting conditions of patients, may introduce biases, which were common problems in regression models. Our ACM method was based on the relative risk signals rather than the absolute risk level, enabling our method to be more robust against these biases. However, it should be acknowledged that the clusters derived by ACM were based on risk signals rather than the risk level, which should be estimated by strict clinical studies with scientifically rigorous designs. The clusters derived from ACM should not be considered as the true clinical risk directly. Although the ROC and DCA were constructed, these results only support the better ability of ACM in signal discrimination rather than supporting the clinical predictions. Besides, the ROC and DCA were only used to compare the model family rather than supporting a specific model. Third, to reduce the heterogeneity in logistic regression, we used only a single cognitive disorder PT. However, using only a single PT may miss the information about the related cognitive PTs. Our ACM method was not validated by other ADRs, and some methodological criteria may be arbitrary, such as the definition of the target PT (whether to combine the related PTs) and the criteria of preliminary drugs with risk signals (whether the number of AE reports should be larger than 200). Thus, the robustness of our method against these methodology parameters was required in the further study. Moreover, some more advanced methods, such as machine learning, were not compared with our method due to the differences in the objectives. Thus, the robustness and the generalizability of our method required further investigation. Lastly, the odds ratios derived from the ACM do not represent the risk levels directly, as they are based on dummy variables and do not account for the total population using the drugs with DICD risk signals. Consequently, these odds ratios from ACM represent relative risk rather than absolute risk. Therefore, while ACM is effective for grading the relative risk-signals of DICD into clusters and discovering potential drugs with risk-signals of DICD, it cannot provide precise risk levels for individual drugs. Further clinical studies would be necessary to estimate the precise risk levels or risk differences for these drugs with DICD risk signals.
Conclusion
In this study, the ACM workflow was designed to address the complex, sparse dummy structure in logistic regression for FAERS data mining. As a result, the predictive performance of the ACM outperformed that of Lasso regressions. In addition, ACM combines drugs with DICD risk signals into a limited number of risk-signal grades, rather than excluding drugs with non-top risk signals of DICD, making it a more informative approach. The ability of ACM to evaluate the grade of risk signals of drugs without top risk signals enhances its applicability for signal evaluation for DICD in clinical practice, allowing for more comprehensive assessments of drug safety.
Supplemental Material
sj-docx-1-taw-10.1177_20420986261438241 – Supplemental material for Agglomerative clustering-based drugs graded for the risk signals of drug-induced cognitive disorder: a study on the FAERS database
Supplemental material, sj-docx-1-taw-10.1177_20420986261438241 for Agglomerative clustering-based drugs graded for the risk signals of drug-induced cognitive disorder: a study on the FAERS database by Bo Lv, Junping Han, Yunli Yu and Yuedong Li in Therapeutic Advances in Drug Safety
Footnotes
References
Supplementary Material
Please find the following supplemental material available below.
For Open Access articles published under a Creative Commons License, all supplemental material carries the same license as the article it is associated with.
For non-Open Access articles published, all supplemental material carries a non-exclusive license, and permission requests for re-use of supplemental material or any part of supplemental material shall be sent directly to the copyright owner as specified in the copyright notice associated with the article.