
Abstract
Background:
Warfarin is commonly initiated post-cardiac surgery to reduce the risk of intracardiac thrombus formation. Studies have found that sensitivity is increased after cardiac surgery and anticoagulation is subsequently difficult to manage. This study set out to identify clinical markers of increased warfarin sensitivity in patients after cardiac surgery, and build a model that can predict warfarin sensitivity, and improve safety in this setting.
Methods:
The study was an observational, retrospective cohort design. Clinical parameters including left ventricular ejection fraction (LVEF), cross-clamp time, age, serum albumin and C-reactive protein concentrations were collected from consenting patients who had undergone cardiac surgery and were prescribed postoperative warfarin. The warfarin dose index (WDI) was calculated for each patient from their international normalized ratio (INR) and warfarin dose, as a measure of sensitivity.
Results:
A total of 41 patients were recruited to the study. Logarithmically transformed WDI (log WDI) significantly correlated with LVEF, cardiopulmonary bypass (CPB) time, cross-clamp time, baseline INR and co-administration of amiodarone (p < 0.05). When added to a linear regression model, LVEF and cross-clamp time produced a model that accounted for 41% of the variance in log WDI (R2 = 0.41), p = 0.0002). Applying a log WDI cutoff value of −0.349 discriminated between patients who develop an INR > 4 and those who do not, with a sensitivity of 75% and a specificity of 70%.
Conclusions:
This single-centre study has highlighted two risk factors for increased warfarin sensitivity post-cardiac surgery. Further research is needed to confirm these findings in a wider, more diverse population, and to validate this model.
Keywords
Introduction
Warfarin is an anticoagulant medication used for the treatment and prevention of thromboembolic disorders, such as deep vein thrombosis and pulmonary embolism. 1 It inhibits the enzyme vitamin K epoxide reductase (VKOR), blocking the formation of reduced vitamin K, which is necessary for the synthesis of the clotting factors II, VII, IX, X, and of the anticoagulants protein C and protein S. 2 There is wide interpatient variability in the response to warfarin, and as a consequence, dosing needs to be tailored to individual patients. Factors that are known to affect warfarin response include diet, co-administration of interacting drugs and single nucleotide polymorphisms for the genes that code cytochrome P450 isoenzyme CYP2C9 and VKOR. 1
Another factor which is increasingly recognized as affecting the sensitivity to warfarin is a recent history of cardiac valve surgery. Studies have found that in the initial postoperative period following valve replacement, certain patients show an exaggerated response to warfarin when compared with nonsurgical patients.3–5 The sensitivity appears to be prolonged, and can lead to poor control in the 3-month period after valve replacement. 6 However, after this period, sensitivity is thought to return to normal. There is therefore a critical window for potential harm, especially during the period of warfarin loading. There is variation in this population however, and while some patients show increased sensitivity to warfarin, others do not. A universal, bespoke dosage regimen in this population may therefore be inappropriate.
Theories for the increased sensitivity include myocardial dysfunction and fluid overload during surgery, which has been hypothesized to lead to hepatic congestion which then may affect warfarin metabolism or the synthesis of clotting factors.3–7 As warfarin is 99% bound to plasma proteins (mainly albumin), hypoalbuminemia, caused by an inflammatory response or haemodilution as a consequence of cardiopulmonary bypass (CPB), may also be implicated.3,4,8 Interacting drugs commonly used after cardiac surgery are also expected to influence sensitivity.9–11 In studies looking at factors influencing sensitivity in this patient group, baseline international normalized ratio (INR), serum albumin, amiodarone and antimicrobial prophylaxis have been identified as risk factors.3,9,12,13
Despite studies finding increased sensitivity in patients after cardiac valve surgery, and the identification of various factors that may contribute to altered response, guidance on dosing in this patient group remains limited, and, as a consequence, anticoagulation is poorly managed. A recent study by Roberts and colleagues investigated the implementation of a warfarin dosing protocol after valve surgery, suggesting a 30% reduction in warfarin doses in all patients. However, this strategy, while reducing the risk of bleeding complications, may leave some nonsensitive patients under-anticoagulated, and at risk of thrombus formation. 14 Another study by Meijer and colleagues developed a specific dosing algorithm after valve surgery. Despite improving the individual time in therapeutic range, patients in the algorithm group spent more time with a supratherapeutic INR compared with the nonalgorithm group. 15 Identifying clinical and biochemical markers that are associated with increased postoperative sensitivity, and then incorporating them into a risk prediction tool could therefore aid the personalization of dosing in this setting and minimize the risk of over-anticoagulation and the associated risk of bleeding.
The published evidence of increased sensitivity is currently limited to patients that have undergone cardiac valve surgery, however, many of the hypotheses to explain the increased sensitivity are pertinent to patients undergoing other types of cardiac surgery, for example, coronary artery bypass graft. Here, damage to the myocardium as a result of ischaemia during aortic clamp may lead to an acute deterioration in left ventricular function, and hepatic congestion, and altered sensitivity to warfarin. The purpose of the current study was therefore to identify clinical and biochemical markers of increased warfarin sensitivity in patients that have undergone a range of cardiac surgeries, and to build a model that could, after validation, be used to predict the risk of warfarin sensitivity in the immediate postoperative period. The model could also be used to provide guidance on warfarin dosing.
Methods
The study was a noninterventional, retrospective cohort study. It received approval from the National Health Service Research Ethics Service, UK (REC approval number: 15/EE/0082). Data were collected as a convenience sample, between April 2015 and September 2015, from consenting patients.
Inclusion criteria
Inpatient admission following cardiac surgery (not limited to valve repair/replacement)
Prescribed postoperative warfarin
Over 18 years of age
Capacity to consent as determined by the patients’ ability to retain and understand the information given on the patient information sheet.
Exclusion criteria
Acute or chronic liver failure as determined from the patient’s medical history and preoperative liver function tests
Baseline INR > 1.5.
Data collection
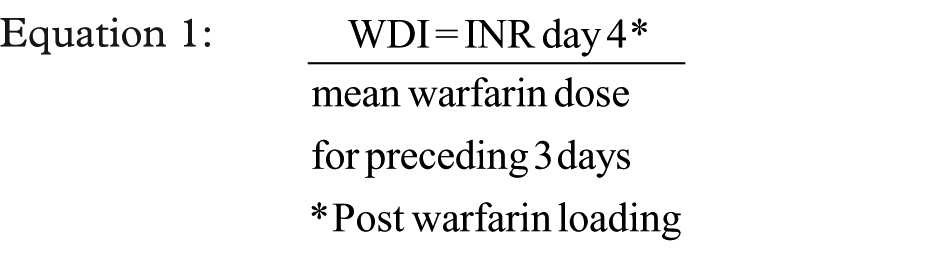
Participants were given a patient information sheet prior to surgery and enrolled in the study towards the end of their inpatient stay after they had recovered. The following data were then collected for each participant: demographics, type of surgery, CPB time, cross-clamp time, urea and electrolytes (U&Es), C-reactive protein (CRP), liver function tests (LFTs), INR, left ventricular ejection fraction (LVEF), concurrent medication prescribed, medication history, warfarin dose, indication and target INR. The warfarin dose index (WDI) was used as an outcome measure for warfarin sensitivity (Equation 1). 13 The WDI is a well-established measure of sensitivity during both warfarin initiation, and maintenance stages. The index normalizes the patient’s clotting time (INR) at day 4 following commencement of warfarin loading, to mean dose over the preceding 3 days.
Statistical power calculation
Sample size was calculated using the ‘pwr’ package in R (version 3.2.1). For a final linear regression model with between 3–5 predictor variables, a sample of 35–42 patients was required to detect a large effect (F2 = 0.35) with α = 0.05 and β–1 = 0.80. For the same number of predictors (3–5) and an F2 = 0.15 (medium effect) a sample size of 77–91 patients was required. We anticipated that our predictors would have a medium to large effect and so our target sample size was set to 35–50.
Statistical model
We built a linear regression model using the log10 of the WDI (log WDI) as our dependent variable, and factors hypothesized to alter warfarin sensitivity as our predictor variables. To determine which of the predictor variables collected should be included in our first iteration of the model we performed a series of correlations between these variables and log WDI. A Pearson correlation was used for continuous variables that (1) demonstrated a normal distribution and (2) had no significant outliers.10,11 For variables with a significant (p < 0.05) Shapiro–Wilk test, or where there were extreme outliers in the sample, a Spearman Rank test was performed.11,16 For dichotomous predictor variables a point-biserial correlation was performed after assessing normality and homogeneity of variance.10,17 Correlation coefficients are reported as r (Pearson’s), ρ (Spearman’s) and ρpb (Pearson’s point-biserial). Variables with a p-value ⩽0.15 were then added to a linear regression model with log WDI as the dependent variable. A significance level of p < 0.05 was accepted as statistically significant.
In describing continuous data with a normal distribution, mean ± standard deviations were used. For continuous data that were not normally distributed, the median and interquartile ranges (IQR) was presented. Our final model was tested for the following assumptions of linear regression: independence of errors, collinearity, normal distribution of errors, linearity and heteroscedascity.10,11,15,17–21 The British Society of Echocardiography Guidelines were used to categorize LVEF into groups. 22
Receiver operating characteristics curves, area under the receiver operator curves (AUROC), and sensitivity and specificity values were calculated using Graphpad Prism 6.0. Youden’s index was calculated as: (sensitivity + specificity) − 1. The AUROC and Youden’s index were used to determine an appropriate cutoff value for log WDI to predict INR ⩾ 4 during an inpatient stay with maximum sensitivity and specificity.
Data analysis was conducted with SPSS version 22.0, Graphpad Prism 6.0, and R.
Results
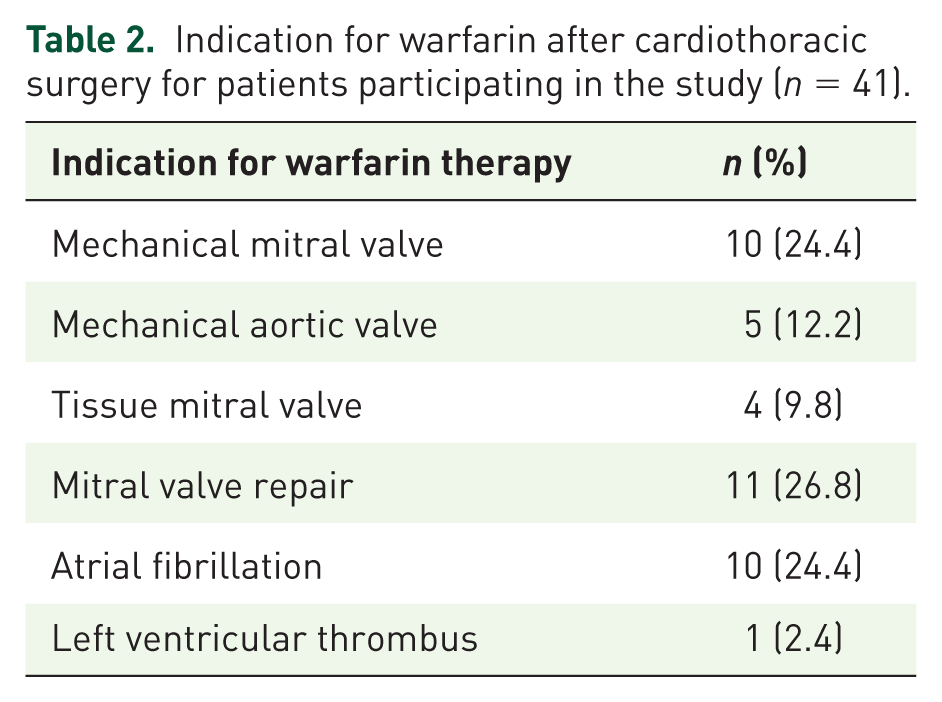
Out of 55 patients admitted for cardiac surgery and initiated on warfarin during the study period, 41 patients were eligible for inclusion in the study. Of these, 35 patients had a complete dataset and were included in the final model (Figure 1). A breakdown of baseline demographic details is found in Table 1. Patients received postoperative warfarin for a range of indications including atrial fibrillation, mechanical mitral valve replacement, and mitral valve repair (Table 2). Of the 35 patients included in the final model, 31 were admitted for valve-related surgery, and 4 for nonvalve-related surgery. Nonvalve-related surgery included coronary artery bypass graft, atrial ablation, and surgical treatment of atrial myxoma and left atrial appendage occlusion.
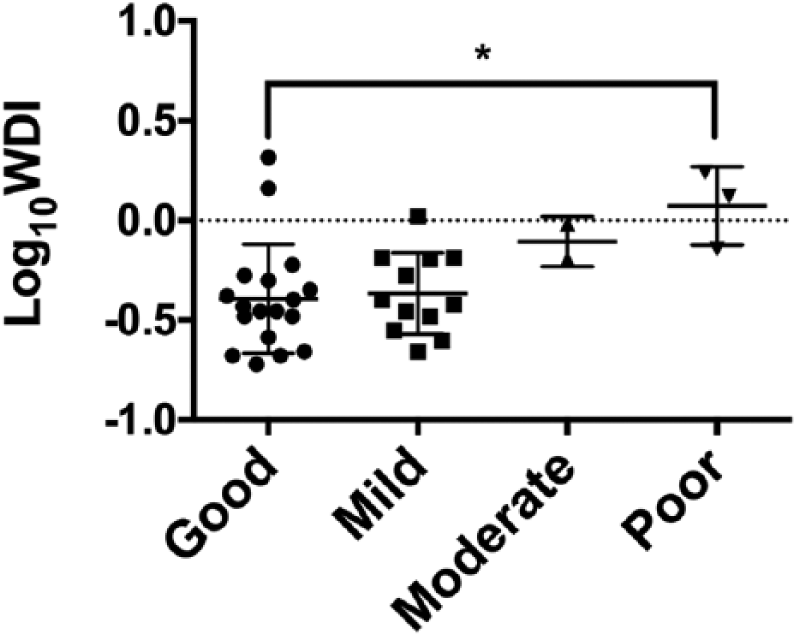
Differences between warfarin sensitivity (log WDI) and categories of LVEF for patients undergoing cardiothoracic surgery and participating in the study (n = 41). The category of LVEF was assigned according to the British Society of Echocardiography Guidelines 19 : Good = ⩾ 55%, mild = 45–54%, moderate = 36–44% and poor = ⩽ 35%. Outliers are denoted by circular dots, indicating 1.5 times the box length and extreme outliers are denoted by * indicating three times the box length. Kruskal–Wallis test, * p < 0.05.
Characteristics of participants initiated on warfarin after cardiothoracic surgery who consented to participate in the study (n = 41). One patient was an emergency admission so a preoperative weight was not documented (in this case the first weight after surgery was used). Data are presented as the mean ± standard deviation unless otherwise stated.
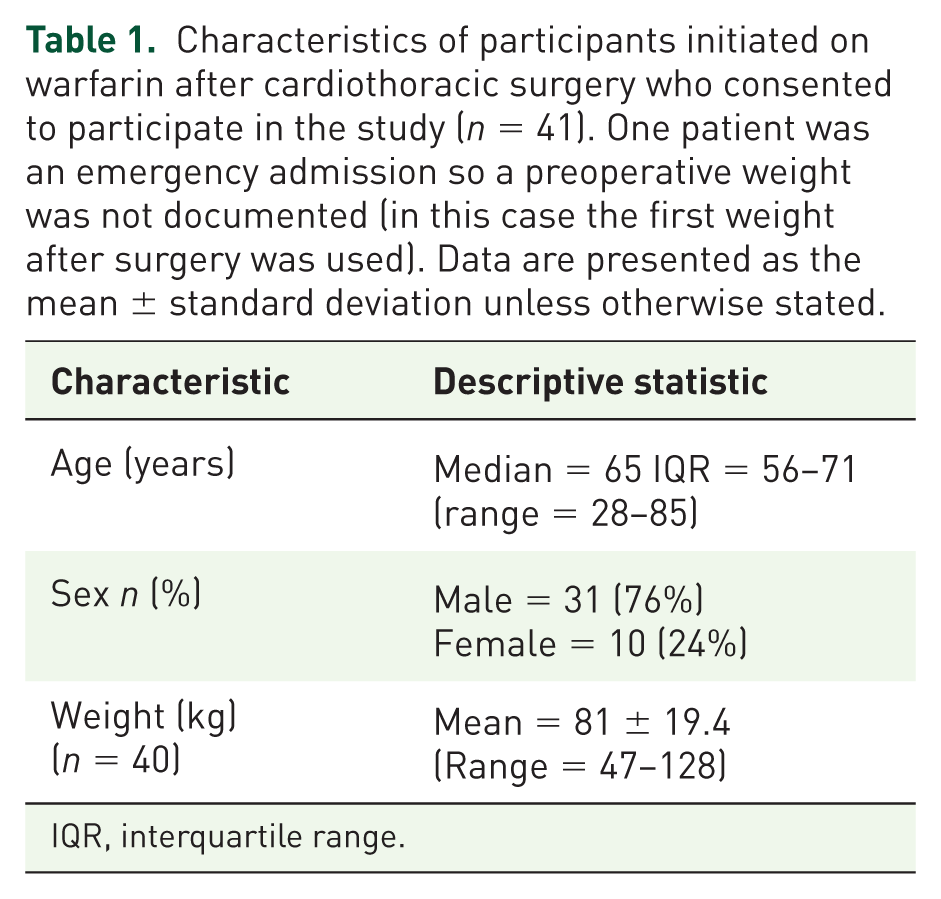
IQR, interquartile range.
Indication for warfarin after cardiothoracic surgery for patients participating in the study (n = 41).
Dosing and INR ranges
Warfarin was started a median of 1 day after surgery (IQR = 1–3, range 0–18 days) and took a median of 5 days to reach the therapeutic range (IQR 4–7 days, range 3–21 days). Over the first 3 days of loading a median dose of 4 mg daily was used (IQR 3–5 mg). The median cumulative dose to achieve therapeutic range was 20 mg, (IQR 13.0–27.5 mg).
Overall, 15 (37%) patients had an INR value which exceeded the patient’s target therapeutic range for a median of 2.5 days (IQR 2–4.5 days, range 1–6 days) and of these, 12 (80%) patients had an INR > 4.0. Overall, one patient had vitamin K administered to reverse an INR of 7.5. During the study 10 (24%) patients had a total of 39 doses omitted due to the INR exceeding the therapeutic range. Discharge was delayed in four patients (10%) due to the INR being below the therapeutic range and one patient had a delayed discharge due to the INR being too high. Comparing valve and nonvalve-related surgery patients, 9/31 in the valve-related surgery group, and 3/4 in the nonvalve-related surgery group developed an INR > 4 during loading with warfarin after surgery.
Bivariate correlation
To identify variables to enter in the first iteration of our model, we performed a series of statistical correlation tests between log WDI and predictor variables (supplementary material). From these correlations we identified LVEF, CPB, cross-clamp time, baseline INR, and the co-administration of amiodarone and omeprazole as potential predictors. Other factors that have previously been associated with warfarin sensitivity, such as age, sex and weight were not significantly correlated with log WDI in this sample (ρ = 0.019, p = 0.907 age; rpb = 0.056, p = 0.728 sex; r = −0.068, p = 0.676 weight) and therefore were not included in the model.
Linear regression
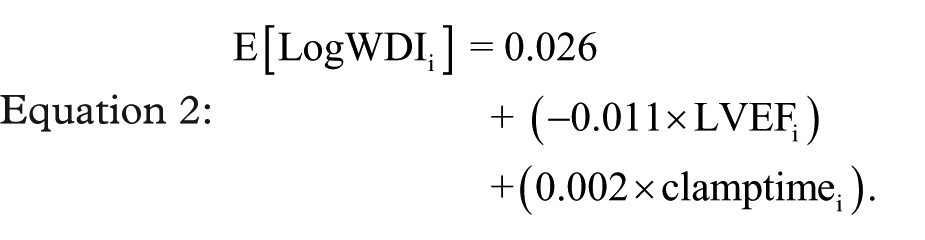
Initially the predictors identified were added to the linear regression model as single variables. As single predictors of sensitivity LVEF, cross-clamp time, CPB time and the addition of amiodarone (n = 20/41) all had statistically significant changes in the F ratio, F (1,33) = 15.87, p = 0.00035, F (1,39) = 4.817, p = 0.034, F (1,39) = 4.665, p = 0.037 and F (1,39) = 4.743, p = 0.036 respectively. As a single predictor LVEF accounted for 32.5% of variability in the model (R2 = 0.325, adjusted R2 = 0.304, n = 35, Figure 2) and when combined with cross-clamp time the model accounted for 41% of the variance (R2 = 0.41, adjusted R2 = 0.373, n = 35). The combination of LVEF and length of cross-clamp time provided the best fit of the data (Table 3). The addition of amiodarone (F change = 1.307, p = 0.261), or CPB time (F change = 2.858, p = 0.101) to LVEF did not significantly improve the model. The equation for our final model is shown in Equation 2, in which E[LogWDIi] is the expected values of LogWDIi.
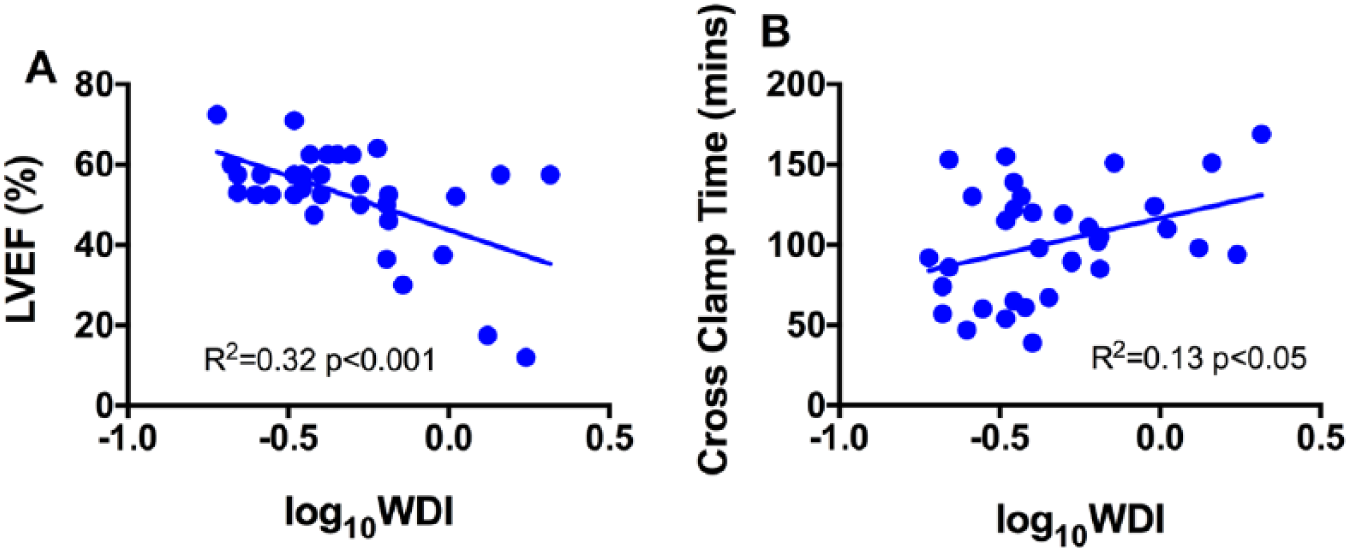
Scatter plots demonstrating the relationship between the two variables: LVEF (R2 = 0.32, p < 0.001) and cross-clamp time (R2 = 0.013, p < 0.05), and warfarin sensitivity (logWDI).
Linear regression model of predictors of log WDI with 95% confidence intervals reported in parentheses. Confidence intervals and standard errors (SE) based on 1000 bootstrap samples. Model 1 contains LVEF and Model 2 contains LVEF and length of cross-clamp time. R2 = 0.33 for model 1 and delta R2 = 0.085 for Model 2 (p = 0.040).
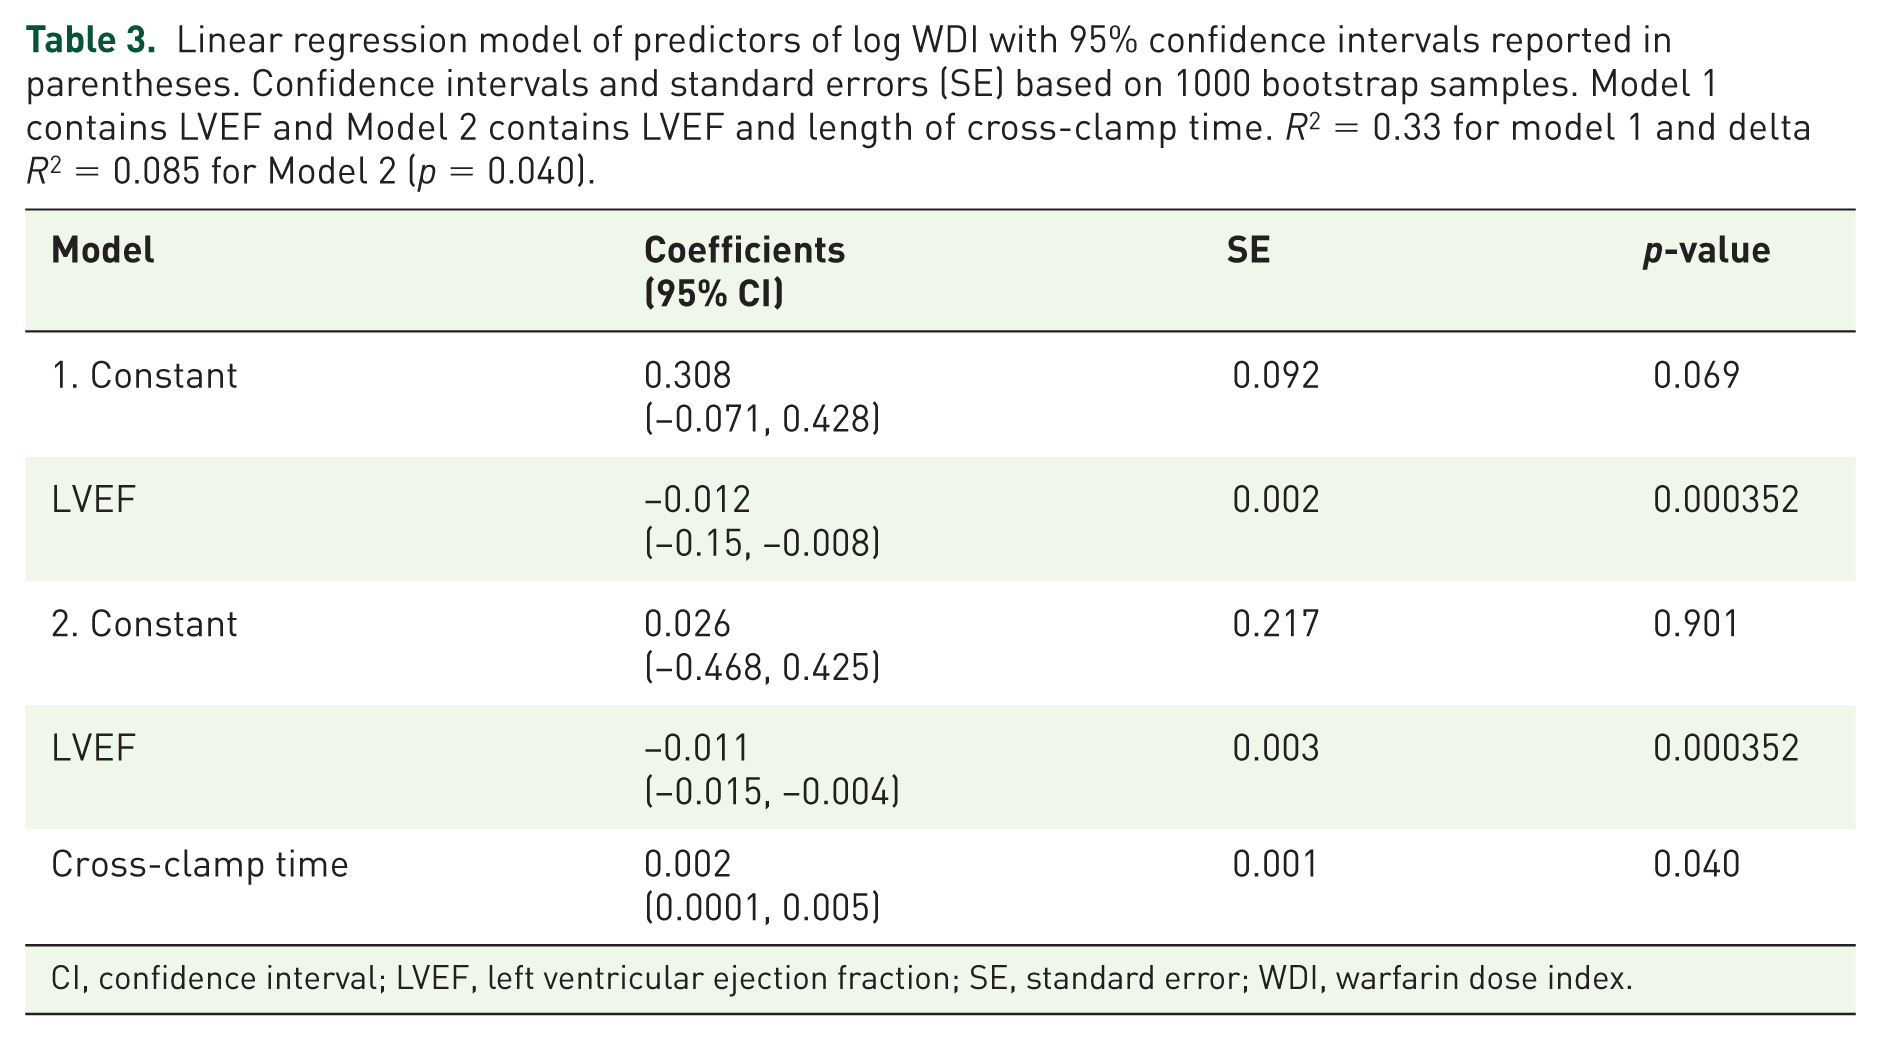
CI, confidence interval; LVEF, left ventricular ejection fraction; SE, standard error; WDI, warfarin dose index.
Model assumptions
Independence of residuals was confirmed with a Durban–Watson test = 2.607. There was a small correlation between LVEF and cross-clamp time (r = .130) but assessment of collinearity was acceptable (Variance Inflation Factor (VIF)= 1.017). There was a normal distribution of the residuals as confirmed with a frequency histogram and a P-P plot. From visual inspection of a plot of standardized predicted values against standardized residuals there was no evidence of non-linearity or heteroscedasticity. To detect outliers, the standardized residuals were set at ± 3 (z score = 2.56), which all were below this range. The leverage value calculated was 0.086 and two cases had values greater than twice this value but the Cooks distances conformed to the accepted criteria so none of the data points would exert a high influence over the regression line.
Clinical predictors
LVEF: 18 (51%) patients had good LVEF, 12 (34%) mild LVEF, 2 (6%) moderate LVEF and 3 (9%) poor LVEF. Log WDI was statistically significantly different among the groups (p = 0.033, n = 35, Kruskal–Wallis).
Using the model to predict patients who develop INR > 4 during stay
Using a patient’s LVEF and cross-clamp time to predict log WDI may be of benefit to clinicians who are initiating warfarin, as it could, for example, be used to calculate the mean daily loading dose required to reach a target INR by day 4. This may not however be practical in a busy ward situation, and may introduce a focal point for medication error due to the multi-step nature of the calculation required to determine a loading dose. It may therefore be more useful to use the model to categorize patients as either high risk, or low risk; those individuals deemed high risk should then be loaded more cautiously with warfarin. To use the model in this way, we must first identify a ‘cutoff’ value in the ‘predicted’ log WDI above which there is high sensitivity and specificity for detecting high-risk individuals. High-risk individuals in this case were considered those patients who had developed an INR ⩾ 4 during their inpatient stay. From our dataset we categorized patients according to whether they had developed an INR ⩾ 4, and then calculated their ‘predicted’ log WDI using Equation 2. This allowed us to construct a receiver operating characteristics (ROC) curve to determine an appropriate cutoff value (Figure 3).
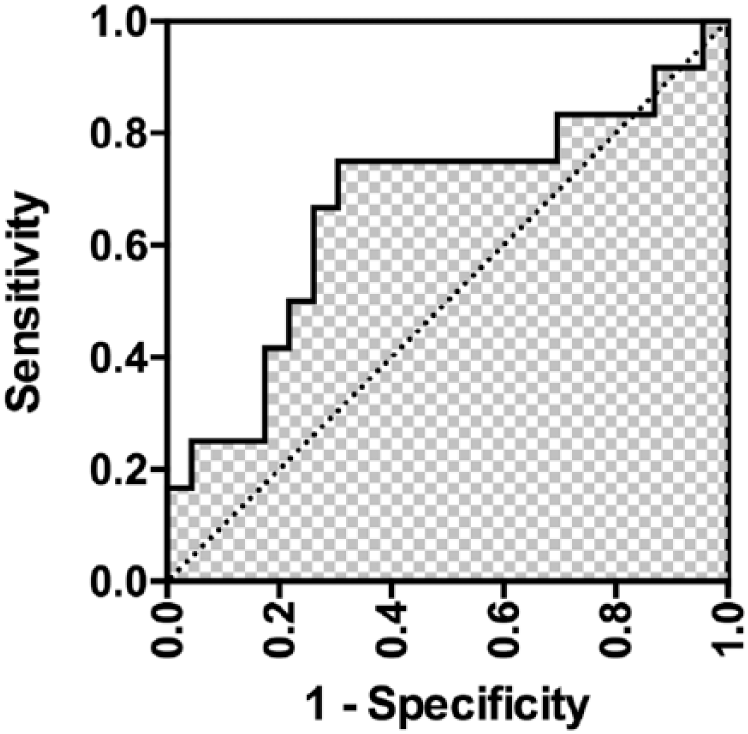
ROC curve showing the sensitivity and 1-specificity values for a range of predicted log WDI cutoff values. The area under the ROC was found to be 0.70 (p = 0.05).
From our study, 12/35 patients had an INR of ⩾4 during their inpatient stay. We identified a predicted log WDI cutoff value of −0.380 from our ROC curve (area under ROC = 0.7 (0.5–0.9), Figure 2). Using this cutoff value, we correctly identified, retrospectively, 9/12 patients who went on to develop a peak INR > 4 during their inpatient stay (sensitivity 75%), and 17/23 patients with a peak INR < 4 during inpatient stay (specificity 70%). Youden’s index, which is a measure of the accuracy of our model, was calculated as J = 0.45, and the positive predictor, and negative predictor values as 56% and 85% respectively.
Discussion
This study aimed to build a model to predict warfarin sensitivity in patients undergoing cardiothoracic surgery, using a range of routinely available clinical variables. In doing so we discovered that compromised cardiac function and the time spent on clamp increased the risk of developing sensitivity to warfarin after surgery.
During the study, 37% of patients exceeded their target INR range. Of these, 29% had an INR > 4.0. For this population, these results are comparable with other studies looking at warfarin response after cardiac surgery, where between 38% and 48.8% of patients exceeded the therapeutic range3,5 and 25% patients had an INR ⩾ 4.0 in the induction period. 4 While there is no current guideline for dosing patients after surgery in the UK, the range of dosing used was consistent for the majority of patients over the first 3 days of loading, with a median of 4 mg daily (IQR 3–5 mg). While other studies have suggested dosing all patients at lower doses, 7 or applying a dosing algorithm to reduce the risk of high INRs during this period, this could result in delayed discharges due to sub therapeutic INRs. Therefore, a targeted, individualized approach to dosing would be advantageous, in terms of the patient experience, safety, and healthcare associated costs.
Of the factors hypothesized to be associated with increasing warfarin sensitivity, LVEF had a large effect size (r = 0.57) and a statistically significant negative correlation associated with increased response to warfarin. CPB time, amiodarone and baseline INR were also found to have statistically significant positive correlations with the outcome measure, all with medium effect sizes. However, when added to our regression model, they did not increase the explanatory power of LVEF in predicting warfarin sensitivity. This study was not powered to assess this further.
Heart failure
The negative relationship between LVEF and warfarin sensitivity is perhaps counterintuitive: warfarin is a low extraction drug, and elimination is not considered to be dependent upon hepatic blood flow, 23 which is compromised in heart failure (a low LVEF). However, there are reports of an association between heart failure and increased response to warfarin in the literature, although some of these studies are older and problematic. For example, some used prothrombin time rather than INR 24 as a measure of warfarin efficacy, the parameters of which can vary between laboratories.
There are also conflicting findings between whether dose requirements are altered because of decompensated heart failure, or if the effect also manifests for stable heart failure. 24 A small study (n = 63) looking for factors affecting the maintenance dose in Hong Kong Chinese patients, found that chronic heart failure (n = 6) negatively correlated with warfarin dosage requirement (r = −0.26, p = 0.025). 25 Doecke and colleagues (1991) also found that stable chronic heart failure was associated with increased response to warfarin during initiation. 26
Del Campo and colleagues (2015) found warfarin sensitivity (WDI) to be significantly increased during exacerbations of heart failure and chronic obstructive pulmonary disease (COPD) when compared with periods of disease stability. 27 The heart failure group had significantly greater sensitivity at admission compared with the COPD and control groups but there was no difference in sensitivity between the groups during periods of disease stability. This would indicate a transient change, relating to the exacerbation, which supports the theory relating to increased sensitivity for decompensated disease. Significantly more patients presented with INR ⩾ 4 in New York Heart Association (NYHA) class 3 and 4 compared with NYHA class 1 and 2 (41% versus 7% respectively p = 0.028), indicating increased sensitivity with worsening function as found in this study.
Theories relating to proposed mechanisms for increased response in heart failure exacerbations relate to either the pharmacodynamic effect on clotting factor synthesis, or proposed pharmacokinetic mechanisms of reduced warfarin metabolism or clearance. As the liver is the site of synthesis for vitamin K-dependent clotting factors, a decrease in synthesis due to hepatic congestion has been suggested. 24
Cardiopulmonary bypass time, cross-clamp time and warfarin sensitivity
Cardiopulmonary bypass is the use of an extracorporeal circuit to maintain circulation to the body during cardiothoracic surgery. 28 A cross-clamp is placed across the aorta to isolate the coronary circulation and can, in some circumstances lead to hypoxic damage of the myocardium, although various techniques are used to mitigate this. 28 Increasing length of cross-clamp time and CPB time were both found to be significantly correlated with increasing warfarin sensitivity and may be related to ensuing damage. However, other studies in this patient group did not find any relationship between CPB times in either of their cohorts when looking at warfarin sensitivity,10,13 but may be related to differences in surgical procedures or patient demographics.
Both prolonged CPB and cross-clamp time are associated with increased morbidity and mortality following cardiothoracic surgery. There is evidence that during the period of the cross-clamp, myocardial ischaemia induces a systemic inflammatory response syndrome (SIRS). 29 Proinflammatory cytokines, including interleukin (IL)-6, tumour necrosis factor α (TNF-α), IL-1 and endotoxin are released as part of the SIRS response, thought to result from the exposure of blood to the artificial surface of the bypass circuit.29–30 Cytokines, such as IL-1, IL-6, TNF-α and interferon have all been shown to have an effect on drug metabolism. 31 Production of cytokines, which may be responsible for the down regulation of individual CYP450 isoforms has been proposed as a mechanism for significant decreases in CYP450 related drug metabolism in critically ill patients with SIRS.32–33 Peak CRP was investigated in this study as a marker of inflammation but did not significantly correlate with log WDI, having a small effect size. As IL-6 seems to be implicated in both drug metabolism and the systemic inflammatory response from CPB this would appear to be a more useful indicator of this effect and worth investigating in the future.
Amiodarone
Amiodarone was the only interacting drug which correlated with warfarin sensitivity in this study; however, it failed to reach significance when included in our model. One possible reason for this could be the temporal trajectory over which the interaction occurs. If we were to conduct the study over a longer period for example, we may find this predictor plays a more prominent role in our model.
Limitations
A patient’s response to warfarin therapy can be affected by various factors, including diet (vitamin K intake), genotype, and co-prescribed interacting drugs. While we included major interacting drugs in our model, we did not collect data on genotype, or diet. Doing so may have improved our model. However, with respect to genotype, this is a factor which is not routinely screened for in the UK, and its inclusion in this model may have meant that using it as a risk prediction, or dosing tool would not be practical.
One further limitation includes the small sample size, and use of a single site for recruitment. Despite the small numbers of patients, out study was powered to identify predictor variables that had a medium, and hence clinically important effect size. Nevertheless, further research is required to confirm these preliminary findings, and validate our model in a more diverse patient population.
Conclusion
In this study, we found that 37% of patients had an INR above their therapeutic range and 29% had an INR ⩾ 4.0, which can lead to patient harm and delay discharge from hospital. We identified two clinical markers that contributed to increased postoperative sensitivity to warfarin in patients that had undergone a range of valve-related and nonvalve-related cardiac surgery. These were LVEF and length of cross-clamp time. By adding these to a linear regression model, they accounted for 41% of the variance in response to warfarin in the initial loading period in this cohort. Application of a log WDI cutoff value of −0.380 was able to successfully identify 75% of patients with and INR ⩾ 4. It should be noted however that this is a single-centre study, and further research is required to confirm these findings in a more diverse patient population, and rule out the influence of confounders. However, once validated, our model could be used to predict patients that are sensitive to warfarin following cardiothoracic surgery, and provide guidance of a suitable loading dose to achieve a target INR. This could reduce the risk of over-anticoagulation in the early postoperative stages and lead to significant improvements in the dosing of this population.
Footnotes
Funding
The author(s) disclosed receipt of the following financial support for the research, authorship, and/or publication of this article: This study was supported by a Masters in Clinical Research studentship funded by the National Institute of Health Research, UK.
Conflict of interest statement
We confirm that there are no actual or potential conflicts of financial interest with any of the authors, or the authors’ respective institutions.