
Abstract
Background:
The global burden of diabetes is increasing worldwide. The aim of the study was to investigate the trends in use of antidiabetic medicines among older New Zealanders between 2005 and 2013, and to perform a separate analysis by age, sex, ethnicity, district health board domicile and socioeconomic deprivation index.
Methods:
The study population included individuals’ aged 65 years and older living in New Zealand (NZ) captured in the pharmaceutical collections. Repeated cross-sectional analysis of population-level dispensing data was conducted from 1 January 2005 to 31 December 2013. Linear regression model using a gamma link function was used to estimate prevalence ratios and trends between 2005 and 2013. The main outcome measure was the prevalence of antidiabetic medicines in older New Zealanders.
Results:
The prevalence of antidiabetic medicines in older New Zealanders increased by 17.6% between 2005 and 2013. Individuals in the 70–74 age group had the highest utilization of each of the classes of antidiabetic medicines and those aged ⩾85 had the lowest utilization. Among the antidiabetic class of medicines, utilization of sulfonylureas was highest and alpha-glucosidase inhibitors the least. The utilization of thiazolidinediones increased over the study period. In 2013, insulin isophane and insulin glargine were the most common insulin analogues used. Insulin use was high in those aged ⩾85 years across the entire study period. The utilization of metformin increased gradually throughout the study period (by 43.9% in 2013 compared with 2005).
Conclusion:
This population-level study showed an increase in utilization of antidiabetic medicines in older people in NZ from 2005 to 2013; however, the increase does not seem to parallel the proportional increase in prevalence of diabetes for the study period. Improving access to newer antidiabetic medicines in line with emerging evidence should be a consideration for decision makers.
Introduction
Diabetes is widely acknowledged to be a worldwide epidemic and a common comorbidity in old age [King et al. 1998; Millar and Young, 2003]. In 2010, diabetes was the seventh leading cause of death in the United States (US), and the prevalence in older Americans aged 65 and older in 2012 remains high, at 25.9% [American Diabetes Association, 2014]. The disease has a severe impact on mortality and morbidity because of its association with long-term macrovascular and microvascular complications [Fox et al. 2004; Narayan et al. 2006; Deshpande et al. 2008]. In accordance with the 2014 New Zealand (NZ) Virtual Diabetes Register, there are over 257,700 out of 4,596,700 people living in NZ who have been diagnosed with diabetes [Virtual Diabetes Register, 2014]. Based on the estimates from NZ diabetes surveillance, the prevalence of diagnosed type 2 diabetes was projected to increase by approximately 45% over the decade from 2001 to 2011 [New Zealand Ministry of Health, 2007]. Diabetes is common among Māori and Pacific Islanders and the prevalence of diabetes is two to three times higher in Pacific people compared with the total NZ population [Tukuitonga, 2013; New Zealand Ministry of Health, 2014a].
A population-level study conducted in older people in Nova Scotia found an overall increase in antidiabetic medicine utilization between 1993 and 1999 [Morningstar et al. 2002]. In their study, the utilization of insulins had increased from 66% in 1993 to 96% in 1995 and the use of second-generation sulfonylureas (SU) and metformin (MET) increased from 8% in 1993 to 20% in 1999, while utilization of alpha-glucosidase inhibitors showed an increase of 4% within 3 years from 1996 to 1999 [Morningstar et al. 2002]. In a cross-sectional noninstitutionalized population-level study conducted in the US, more than 80% of older people with diabetes were treated with antidiabetic medicines, from which 39.4% were with SU, 36.8% with MET, 18.7% with thiazolidinediones (TZD) and 17.3% with insulin [Yeh et al. 2011].
The NZ Guidelines Group recommends diabetes management based on targeted glycemic control: HbA1c 50–55 mmol/mol. According to the guideline, MET is recommended as a first-line drug therapy, SU and TZD as second-line (dipeptidyl peptidase-4 inhibitor may be an alternative) and insulin as third-line drug therapy (dipeptidyl peptidase-4 inhibitor and glucagon-like peptide-1 agonist are possible alternatives) [New Zealand Guidelines Group, 2011]. The International Diabetes Federation also recommends similar treatments as followed in NZ [International Diabetes Federation, 2016]. The treatment of diabetes and its complications in older people is a significant public health problem. The utilization of antidiabetic medicines in older people has not been previously investigated in NZ. Examining utilization of antidiabetic medicines at a population level is of importance to promote quality use of medicines and guide health policy.
The aim of this study was to investigate the trends in use of antidiabetic medicines among older New Zealanders from 2005 to 2013 and to perform a separate analysis by age, sex, ethnicity, district health board (DHB) domicile and socioeconomic status.
Materials and methods
Approval to undertake this study was provided by the Human Ethics Committee of the University of Otago, NZ (approval number HD14/34).
Data source and study population
Pharmaceutical Claims Data Mart (Pharms) is used by the Pharmaceutical Management Agency (PHARMAC) and the Ministry of Health of NZ to administer payment to pharmacists for dispensing medicines that are publicly funded, under the national medicines budget managed by PHARMAC [Pharmaceutical Management Agency, 2015]. The Pharms dataset includes residents and citizens living in NZ and individual dispensing records are encrypted using a seven-digit alphanumeric National Health Index number which enables individual records to be linked with other national health data collections whilst protecting the identity of the individuals. Each dispensing includes: date of dispensing, medicine name, administration route, strength of units, total number of units to be taken daily, frequency and quantity supplied. Pharms also captures data on patient demographics such as sex, date of birth, ethnicity and DHB domicile. Further details of the pharms dataset are described elsewhere [Nishtala et al. 2014; Nishtala and Salahudeen, 2015; Salahudeen et al. 2015].
The DHBs were established in 2001 by the NZ government, through the Ministry of Health, with defined geographical areas based on age, sex, ethnicity, deprivation status, specific annual population size and past use of health services. Currently, 20 health boards are publicly funded and function both as funding and planning units for provision of drugs and health services [New Zealand Ministry of Health, 2016].
The study population included all individuals’ aged 65 years and older living in NZ captured in the Pharms dataset from 1 January 2005 through 31 December 2013. Individuals with missing data in one or a combination of the following variables: age, sex, medicine dose, medicine strength were excluded from the analyses. The Social Deprivation Index is a measure of socio-economic status calculated for small geographic areas in NZ. The Social Deprivation Index is calculated at meshblock level with a population of around 60–110 people and built up to the relevant geographic scale using weighted average census usually resident population counts [New Zealand Ministry of Health, 2014b]. Socioeconomic status was measured using the NZ Deprivation Index (NZDep), the index ranges from 1 to 10. A score of 1 indicates that people are living in the least deprived 10% (decile) of NZ. A score of 10 indicates that people are living in the most deprived 10% of NZ [New Zealand Ministry of Health, 2014b].
Exposure to antidiabetic medicines
Antidiabetic class of medicines were defined as per the WHO Collaborating Centre for Drug Statistics Methodology anatomic, therapeutic and chemical (ATC) classification system [WHOCDSM, 2013]. The five subsidized classes of antidiabetic medicines available in NZ are alpha-glucosidase inhibitors (acarbose), MET, insulins, SU and TZD. The newer classes of antidiabetic medicines including dipeptidylpeptidase-4 (DPP-4) inhibitors, glucagon-like peptide-1 and sodium-glucose co-transporter 2 (SGLT2) inhibitors are not subsidized in NZ. The two combination medicines available in NZ, MET plus saxagliptin and MET plus sitagliptin, are also not subsidized and hence excluded from the study. A complete list of subsidized antidiabetic medicines available in NZ is depicted in the online Supplementary table 1.
Defined daily dose per thousand older people per day
The defined daily dose (DDD) for a medicine is a weighted utilization measure that corresponds to the mean maintenance daily dose when used to describe the number of older people on a defined standard daily dose (formulation not factored) per thousand older people per day (TOPD). The mathematical formula is given as: DDD = ∑ ((W*Q) / (ATCDDD)), where ∑ is the weighted sum of individual dispensings, W is the strength of medicine, Q is the quantity and ATCDDD is the defined dose for a medicine fixed by World Health Organization Collaborating Centre (WHOCC) [WHOCDSM, 2013]. Utilization measures and use rates by year, age, sex, ethnicity, deprivation score and DHBs were measured as DDD per TOPD. DDDs were computed for each antidiabetic medicine consumed by an individual, yearly, per annual population size of NZ from 2005 to 2013.
Statistical analysis
A descriptive statistical analysis was performed using SPSS (version 22.0; SPSS Inc., Chicago, IL, USA). Differences in antidiabetic medicine utilization across age groups, sexes, ethnic groups and DHBs domicile were examined between 2005 and 2013. A generalized linear regression model using a gamma link function was used to estimate prevalence ratios (PRs) of antidiabetic medicines in DDD between 2005 and 2013 using sex, age groups, ethnicity, NZDep, antidiabetic medicine class and DHB domicile as categorical variables. A p value of <0.05 was considered as statistically significant.
The trends in use of antidiabetic medicines between 2005 and 2013 normalized for sex, age group, and ethnicity and DHB populations and are represented in graphs.
Results
Regression analysis
The overall trend in the prevalence of antidiabetic medicines use in older New Zealanders increased by 17.6% from 2005 to 2013. Table 1 shows prevalence ratios of antidiabetic medicines in DDD among the study population and antidiabetic medicine classes, year, sex, age groups, ethnicity, NZDep score and DHBs as categorical variables. Individuals in the 70–74 age group had the highest utilization of all antidiabetic medicine classes and those aged ⩾85 had the least utilization. In relation to ethnicity, Pacific islanders reported highest utilization of acarbose [PR 1.04; 95% confidence interval (CI) 0.98–1.11] and MET (PR 1.06; 95% CI 1.05–1.07) and the Middle Eastern and Latin American and African (MELAA) reported highest utilization of TZD (PR 1.10; 95% CI 0.98–1.24) and SU (PR 1.05; 95% CI 1.01–1.10). Among the DHBs, Southern DHB reported the highest utilization of acarbose (PR 1.42; 95% CI 1.17–1.72), West Coast for (PR 1.16; 95% CI 1.05–1.29) and Mid Central for SU (PR 1.25; 95% CI 1.23–1.278); see online Supplementary table 2. The prevalence ratio of antidiabetic medicine utilization reported highest among the most deprived individuals as compared with the least deprived. Among the antidiabetic medicine classes, the prevalence ratio of TZD (PR 1.90; 95% CI 1.74–2.08), SU (PR 1.07; 95% CI 1.05–1.08) and MET (PR 1.11; 95% CI 1.10–1.12) was highest in the study population and insulins (PR 0.86; 95% CI 0.84–0.88) found to be the lowest for 2013 compared with 2005 (Table 1).
Prevalence of antidiabetic medicine utilization in the older New Zealand population.
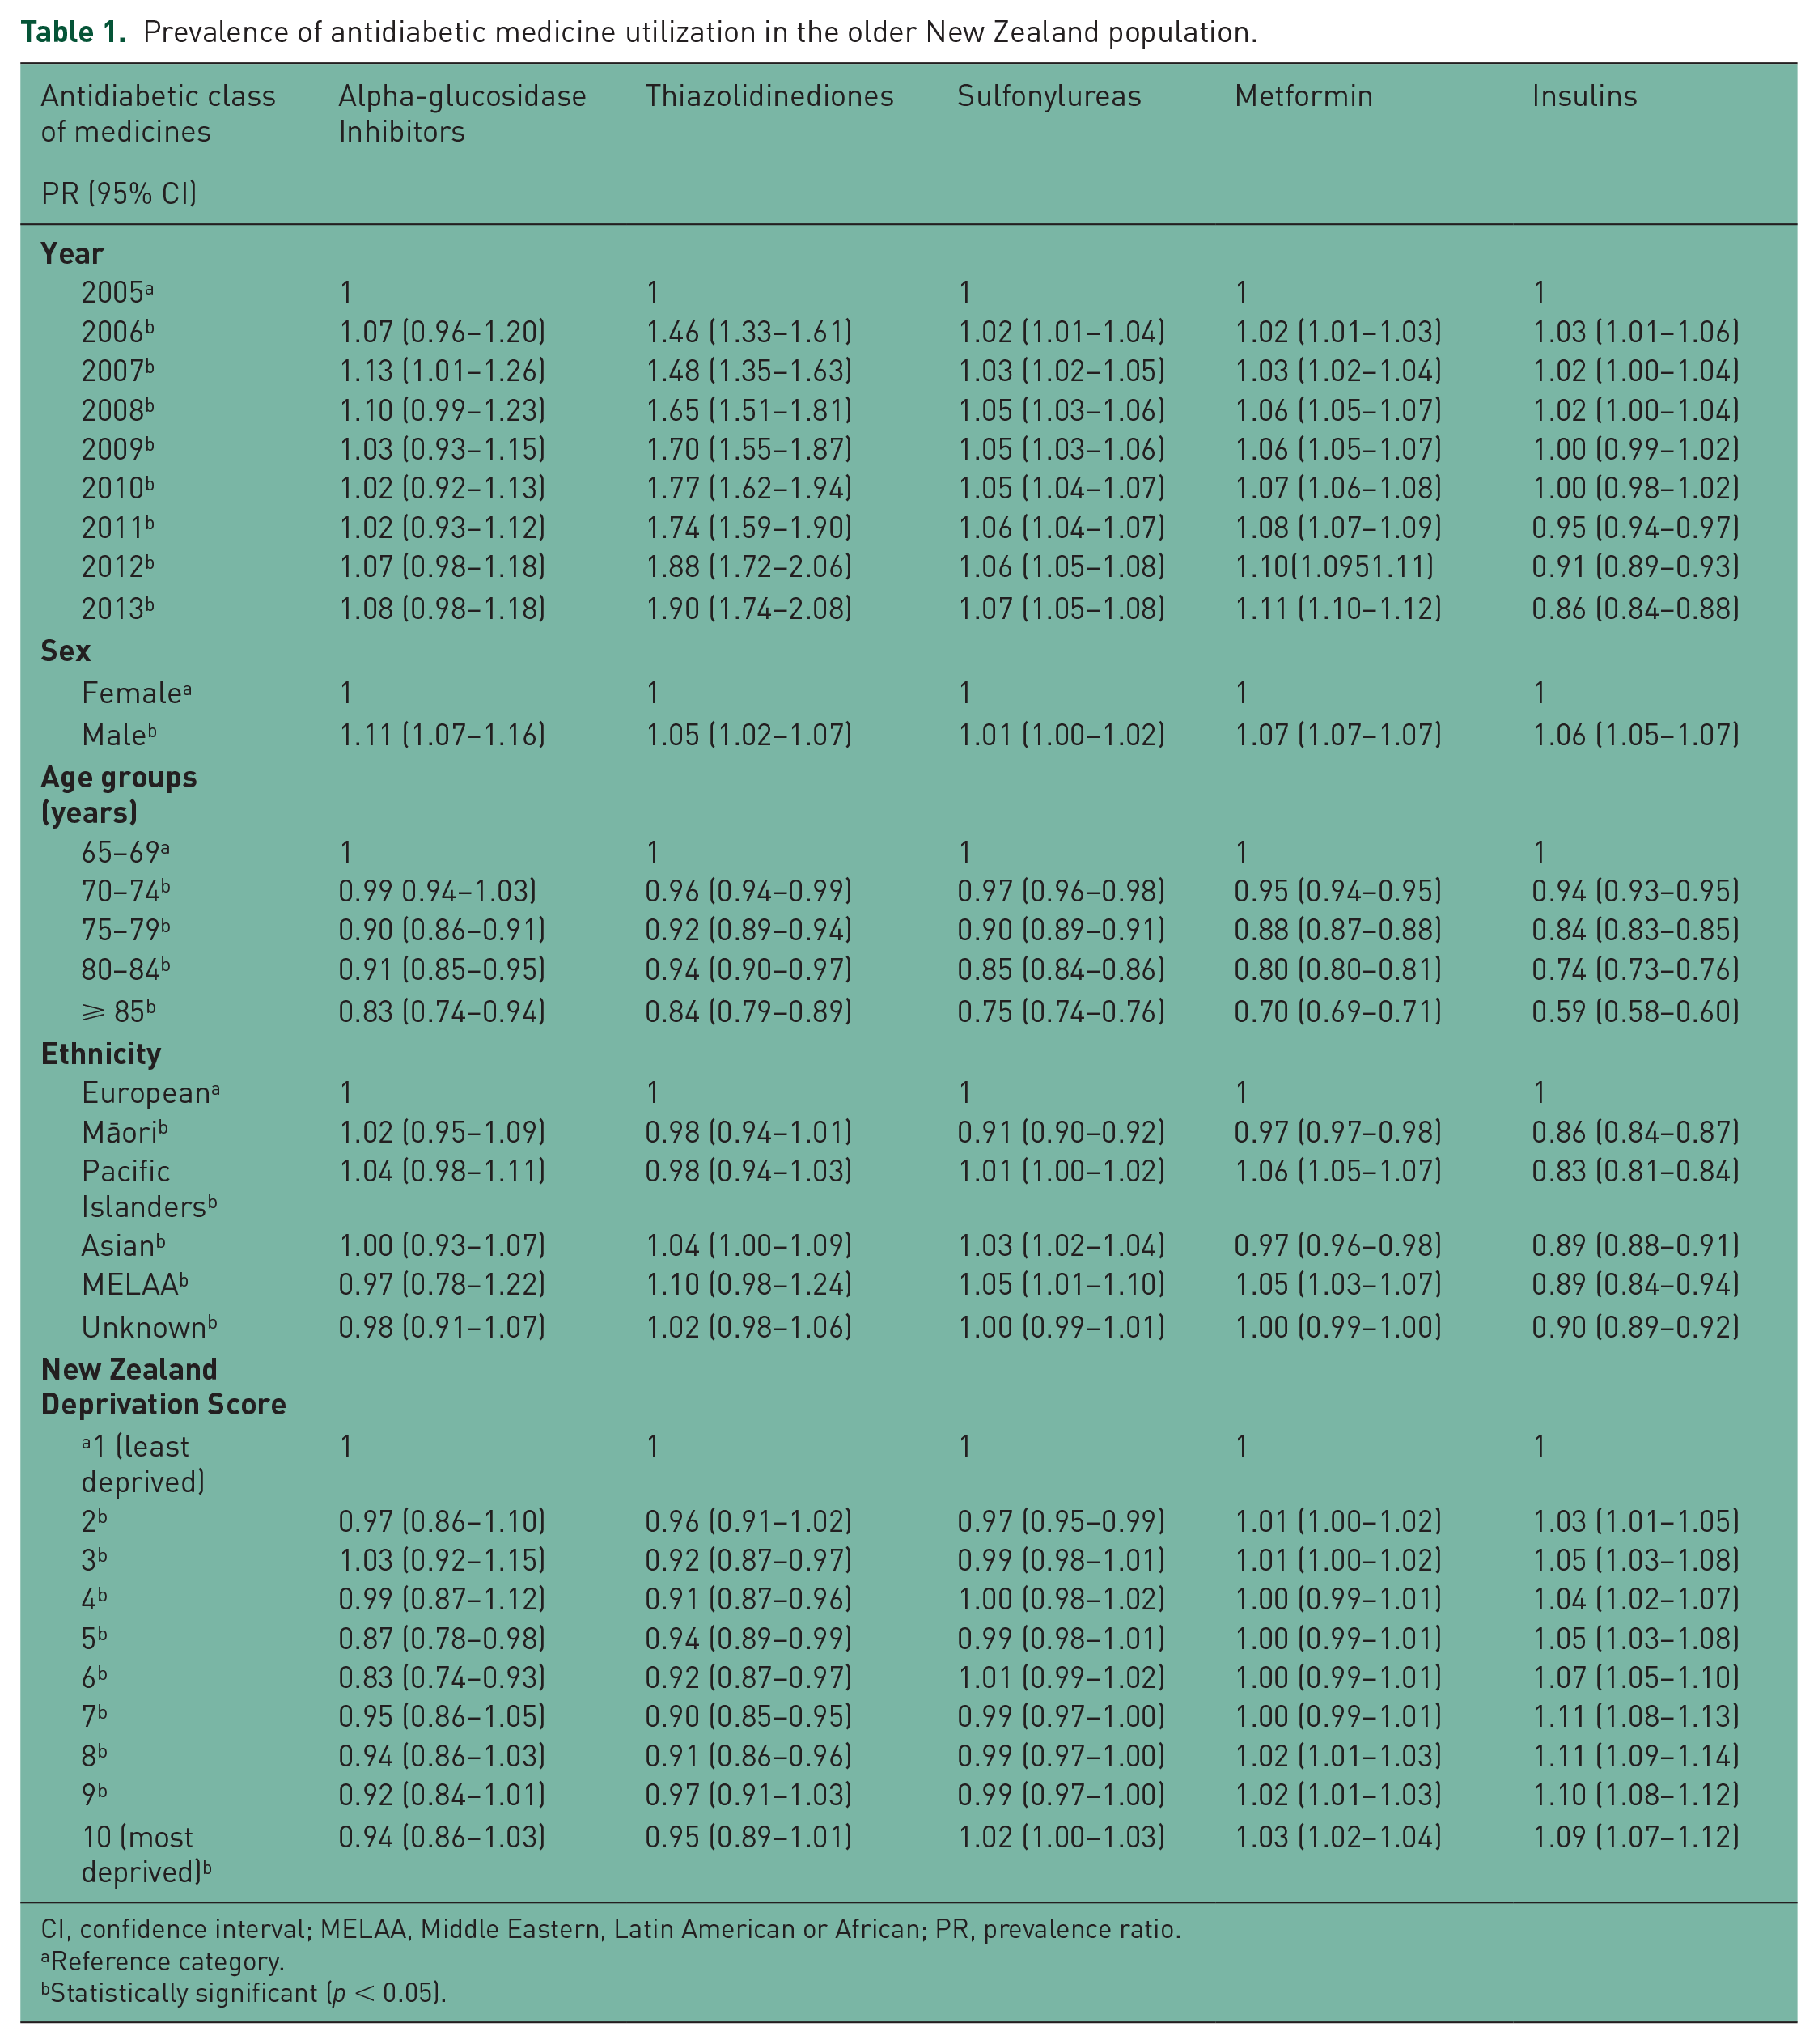
CI, confidence interval; MELAA, Middle Eastern, Latin American or African; PR, prevalence ratio.
Reference category.
Statistically significant (p < 0.05).
Descriptive analysis
Figure 1 describes the utilization of different antidiabetic medicine classes over the study period, and a decline in the utilization of SU was noted from 2008. Utilization of MET increased consistently during the study period. Utilization of insulin was stable across the study period but a slight decrease in 2013 compared with 2005 was noted. Among the newer antidiabetic medicines utilization of acarbose declined, but the utilization of TZD increased over the study period. In Figure 2, the utilization of antidiabetic medicines in DDDs per TOPD for both sexes was higher for SU followed by MET and insulin. The DDD per TOPD for various age groups shown in Figure 3 revealed the 70–74 age group had the highest utilization and those aged ⩾85 the lowest. Trends in antidiabetic medicines DDD/TOPD utilization stratified by ethnicity showed that the Pacific Islanders had the highest utilization in DDDs/TOPD throughout the study period except for a minor dip in 2013 (Figure 4). The utilization trend of top 10 antidiabetic medicines in older people for a period of 9 years is outlined in the online Supplementary table 3. Interestingly, in our population-level study the most deprived (score 10) population had a higher utilization of antidiabetic medicines and the least deprived score reported 2 as shown in the online Supplementary Figure 1.
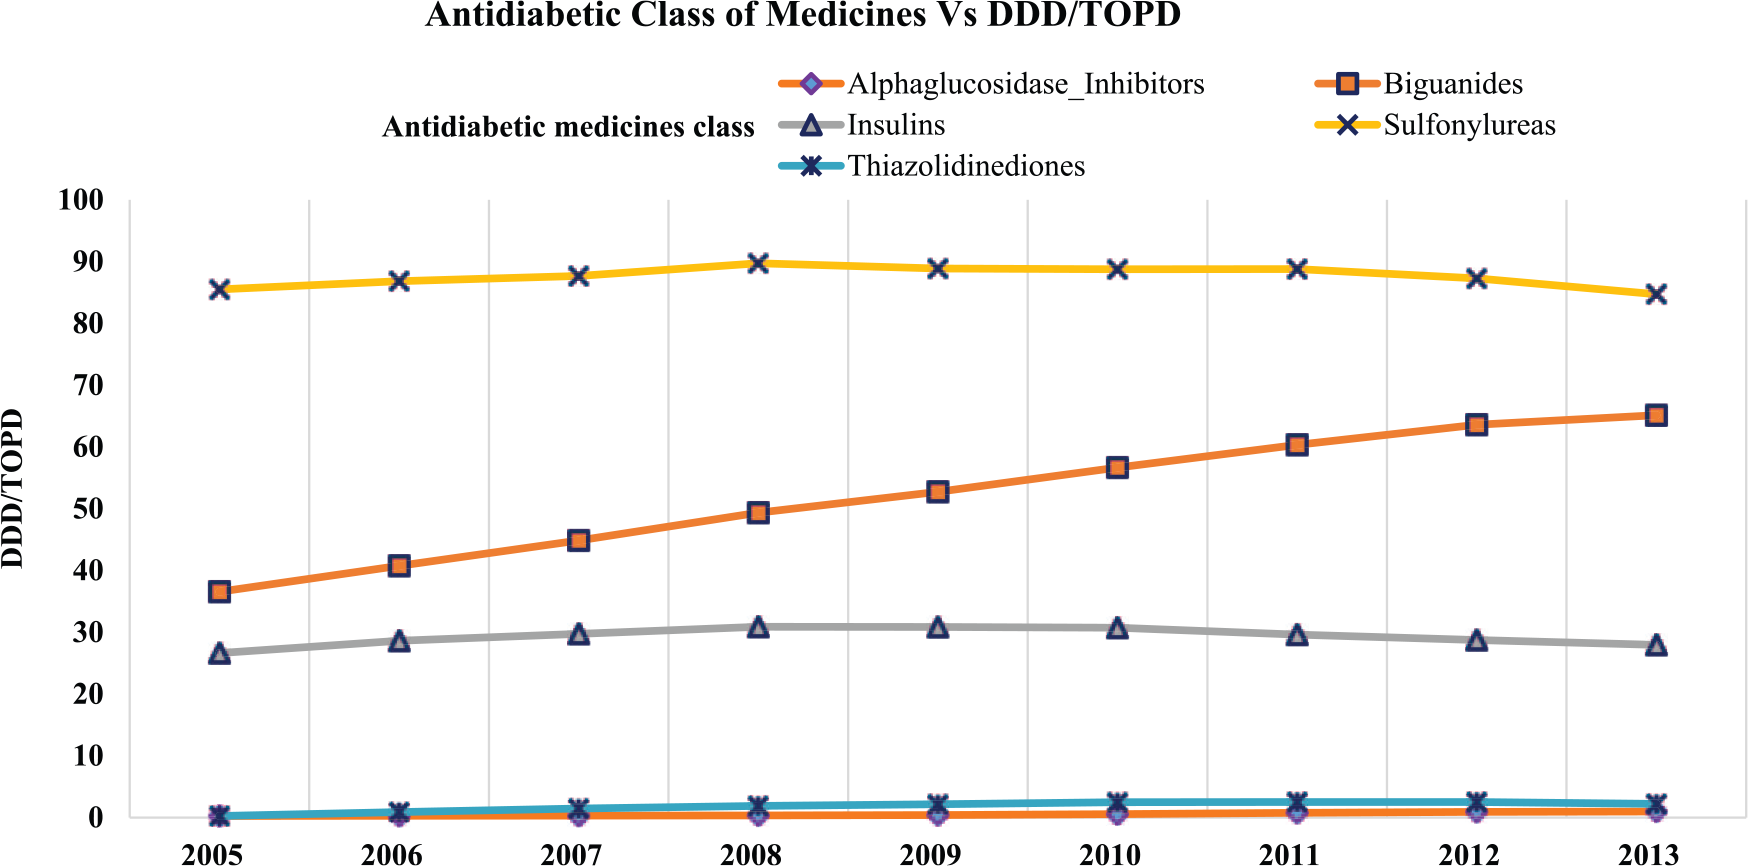
Overall trends in antidiabetic medicine utilization and defined daily dose (DDD) per thousand older people per day (TOPD) from 2005–2013.
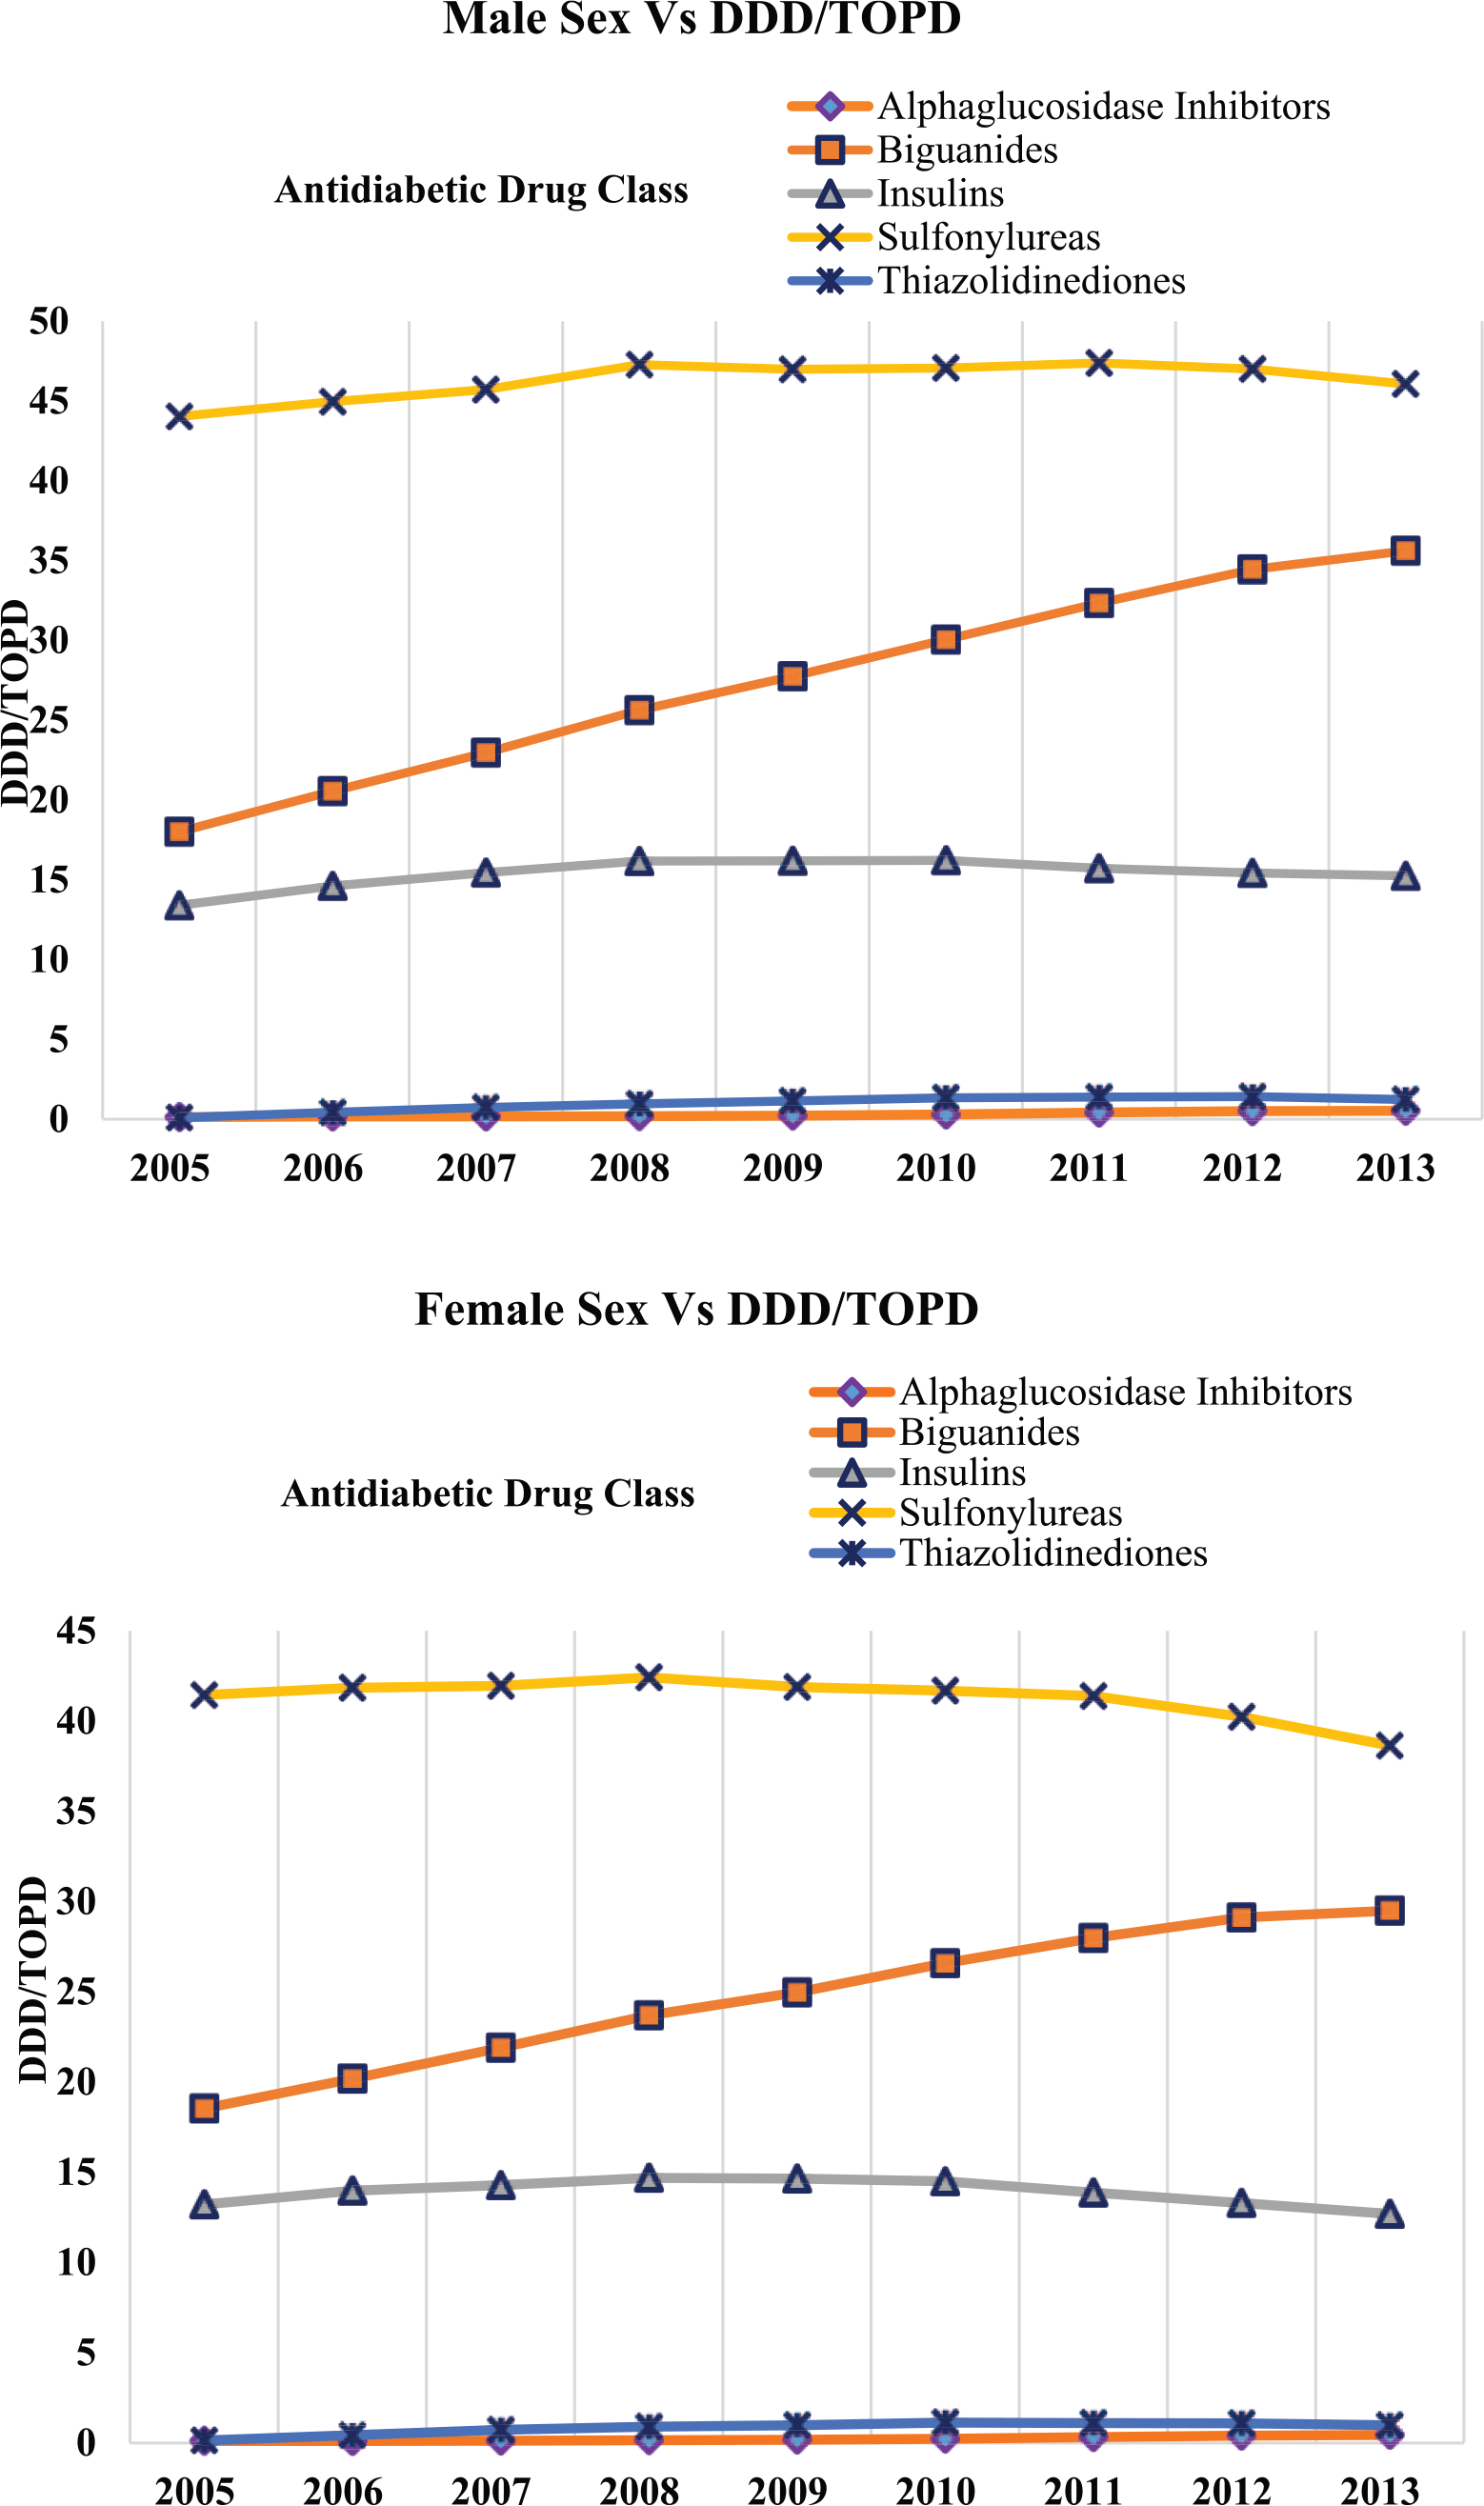
Trends in antidiabetic medicine use by sex and defined daily dose (DDD) per thousand older people per day (TOPD) from 2005–2013.
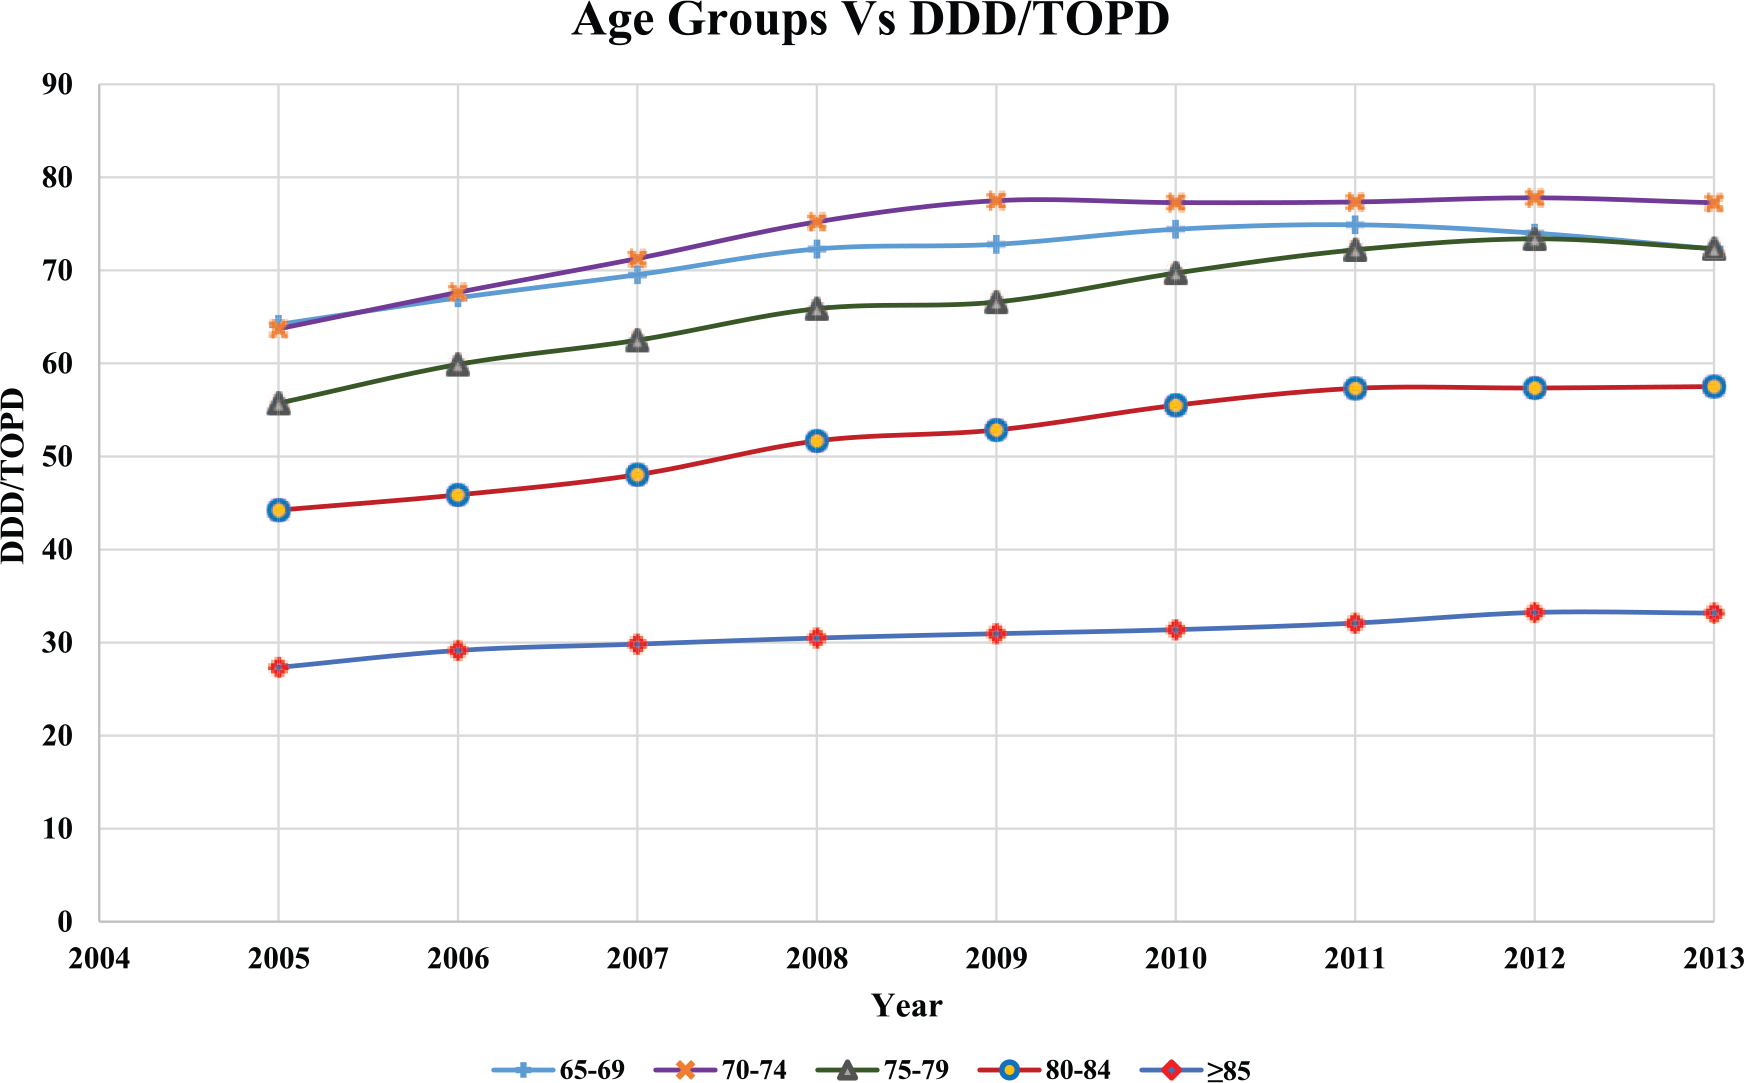
Trends in antidiabetic medicine use among different age groups and defined daily dose (DDD) per thousand older people per day (TOPD) from 2005–2013.
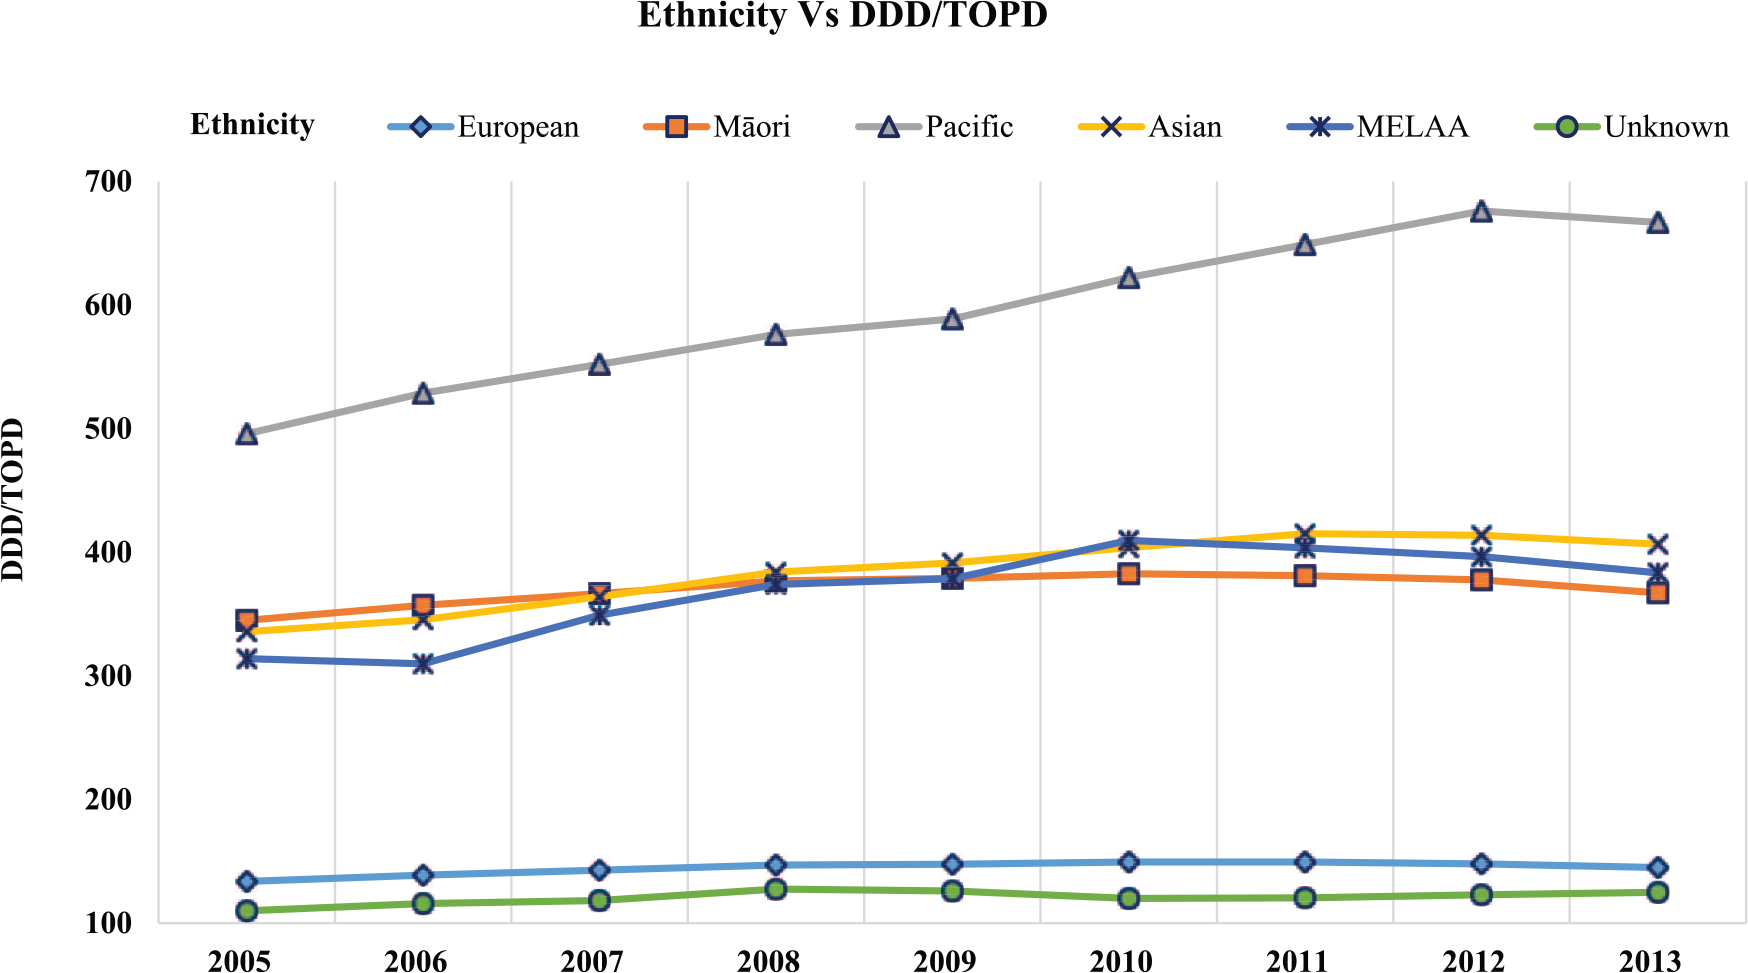
Trends in antidiabetic medicine use among different ethnicity and defined daily dose (DDD) per thousand older people per day (TOPD) from 2005–2013.
Utilization of antidiabetic medicines across age groups (2013 versus 2005) revealed that the highest utilization was found for acarbose (75.6%) in the 70–74 age group, MET (55.2%), SU (6.3%) and insulins (19.3%) in the ⩾85 age group, and TZD (91.7%) in the 80–84 age group as outlined in the online Supplementary table 4. Between 2005 and 2013, the Counties Manukau region of NZ showed higher exposure to antidiabetic medicines compared with any other DHB as depicted in the online Supplementary figure 2. Also, the list of antidiabetic medicines which are not available or not funded by PHARMAC in NZ is outlined in the online Supplementary table 5.
Discussion
To the best of the authors’ knowledge, this is the first population-level study in NZ that examined the trends in utilization of antidiabetic medicines in older people over a period of 9 years from 1 January 2005 to 31 December 2013. The study findings of increasing trends in utilization of antidiabetic medicines is consistent with a higher incidence of diabetes in NZ which is likely to double over the next 20 years [New Zealand Ministry of Health, 2014]. However, the increase does not seem to parallel the increase in prevalence of diabetes for the study period [New Zealand Ministry of Health, 2007]. A study on the prevalence of diabetes in New Zealand reported that diabetes rate among older adults increased approximately twofold during the period 2001–2011.
The utilization of antidiabetic medicines in NZ increased by 17.6% from 2005 to 2013. Similarly, in a population-level study conducted in Denmark and Sweden, utilization of oral antidiabetic medicines and insulin in older people showed an increase of 13% and 20%, respectively, from 1994 to 2003 [Melander et al. 2006]. Numerous reasons can be cited for the increased utilization including, but not limited to, earlier or better diagnosis, higher life expectancy leading to an increasing number of older people treated for diabetes, potentially aiming for stringent glycated haemoglobin targets and higher awareness of the importance of treating older people with diabetes [Moghissi, 2013].
The overall utilization of antidiabetic medicines was found to be high for SU, followed by MET, insulins, TZD and acarbose compared with a study conducted in US from 2006 to 2009 [Margolis et al. 2012]. The utilization of antidiabetic medicines in NZ is largely influenced by PHARMAC’s drug subsidy and funding of newer antidiabetic drugs has been limited compared with other countries with similar federal funding mechanisms such as Australia. A good example is the funding of DPP-4 inhibitors: these are not subsidized in NZ, but The Pharmaceutical Benefits Scheme in Australia approved DPP-4 inhibitors as second-line add-on medicines for use with either SU or MET for the treatment of type 2 diabetes mellitus [Australian Department of Health, 2015]. Ther utilization pattern of SUs was high during the initial study period between 2005 and 2010, until a decrease in trend was noted after 2011 (–1%). However, the utilization of MET increased gradually throughout the study period (43.9% in 2013 compared with 2005). Similarly, utilization of insulins increased by 4.8% increase in 2013 compared with 2005. Acarbose and TZD showed a percentage increase of 74.7% and 89%, respectively, in 2013 compared with 2005. The increased utilization of SUs followed by MET and insulins in our study is similar to a population-based study conducted in France that reported an increase for SU, MET and insulin by an odds ratio of 2.25, 0.60 and 1.21, respectively, in 2003 compared with 2001 [Boyc et al. 2007]. The increase in use of MET is encouraging as it is the first line agent for management of type 2 diabetes [New Zealand Guidelines Group, 2012]. MET is associated with a low risk of hypoglycemia in older adults, but dose adjustment is recommended in renal impairment. Caution is recommended in older adults with severe renal impairment or presence of comorbid illnesses including myocardial infarction, stroke, cardiac failure, pneumonia due to the risk of developing lactic acidosis [Chentli et al. 2015; Kim et al. 2015].
Glipizide, gliclazide and glibenclamide are currently subsidized SUs in NZ. The McKellar Guidelines [Dunning et al. 2014] recommends that the use of glibenclamide is best avoided in older people due to the increased risk of hypoglycemia. The uptake of second-generation SUs such as gliclazide is increasing in NZ (Supplementary table 3). A recent meta-analysis of 19 randomized trials found that the risk of severe or confirmed hypoglycemia was extremely low with gliclazide; however, none of the trials were designed for evaluating cardiovascular outcomes, which warrants attention in future randomized trials [Landman et al. 2014].
The second most utilized class of antidiabetic medicines was MET (43.9% in 2013 compared with 2005). This in line with recommendations from the NZ Guidelines Group that recommends MET as the first-line antidiabetic medicine for all people with type 2 diabetes [New Zealand Guidelines Group, 2011]. Insulins were found to be the third most utilized antidiabetic class of medicines. Insulin use is associated with risk of hypoglycemia and our study findings showed a high usage of insulin in older people especially those aged ⩾85 years. The utilization of insulins in the age groups 80–84 and ⩾85 increased between 2005 and 2013 by 12.0% and 19.3%, respectively. Similarly, in a population study of 20,016 veterans on oral antidiabetic medicines and insulin in 2001, found increased to 21,413 by 2009 and the majority of them were aged between 70 and 89 years [Gadzhanova et al. 2011].
TZDs were the fourth most frequently used antidiabetic medicine class, and utilization increased by calendar year despite the withdrawal of rosiglitazone in 2011 in NZ. In NZ, pioglitazone is the only TZD approved for the treatment of type 2 diabetes. Pioglitazone is available under special authority criteria for patients who have had suboptimal response to MET, SU or insulin, or when MET and/or SU is contraindicated or not tolerated. Concerns regarding cardiovascular-related adverse events associated with TZD does not appear to have significantly impacted utilization of pioglitazone in NZ. The findings from the PROspective pioglitAzone Clinical Trial In macroVascular Events (PROactive) study showed that pioglitazone can reduce the risk of secondary macrovascular events in a high-risk patient population with type 2 diabetes and established macrovascular disease [Dormandy et al. 2005]. Rosiglitazone, a TZD, was found to be associated with major adverse cardiovascular events and mortality. In 2007 a meta-analysis was published by the US Food and Drug Administration highlighting safety concerns associated with rosiglitazone [Nissen and Wolski, 2007]. Our findings support a similar finding to that of a US study that used a nationally representative database and reported that fewer people with diabetes received TZDs (23.1%) compared with SUs (43.8%) or MET (45.3%) [Aquilante et al. 2007]
Utilization patterns of antidiabetic medicines across the age groups showed utilization of MET, SU and insulins in the ⩾85 age group was high compared with the 80–84 age group (Supplementary table 4). In contrast, a population-level study from Sweden [Stalhammar et al. 2001] found that the utilization of SU among the 65–74 age group increased [odds ratio (OR) 15.24] in 1990–1994 when compared with 1982–1989 (OR 9.31), while those aged ⩾75 years reported an increased OR of 13.99 during 1990–1994 compared with 1982–1989 (OR 11.15) [Stalhammar et al. 2001]. This study also found that MET utilization declined (OR 1.66) in the ⩾75 age group during 1990–1994 compared with 1982–1989 (OR 2.31) [Stalhammar et al. 2001].
The utilization of antidiabetic medicines was found to be highest among the Pacific islanders followed by Asian, Middle Eastern, Latin American or African (MELAA) and Māori ethnic groups. The findings mirror the NZ Ministry of Health statistics showing an increased prevalence of diabetes in Māori, Pacific Islanders and Asian populations (see http://www.nzssd.org.nz/index.html).
The utilization pattern of antidiabetic medicines in our study was similar in both sexes. A study in Tunisia (2008–2009) reported 29.2% or men and 26.5% ow women were consuming antidiabetic medicines [Hammami et al. 2012]. Another study from Australia found that, of the total population consuming antidiabetic medicines, 69% were male [Gadzhanova et al. 2011].
Interestingly, the most deprived (score 10) population had a higher utilization of antidiabetic medicines (Supplementary figure 1). According to the Ministry of Health, adults living in the most deprived regions were likely to be Pacific Islanders and Māori people [New Zealand Ministry of Health, 2014]. A study conducted in Scotland reported that both low socioeconomic status and type 2 diabetes were important predictors associated with increased absolute mortality risk [Walker et al. 2011].
Intensive glycemic control requires aiming for an HbA1c level of less than 7% (or even <6.5%), and may be appropriate in patients who are relatively healthy [Lipska et al. 2015]. There is growing literature that intensive glycemic control in older adults with complex/intermediate or very complex/poor health status is harmful and likely to exceed the benefits. Intensive glycemic control markedly increases the risk of hypoglycemia, and has been associated with poor health outcomes including increase in cardiovascular disease, falls and accidents, dementia, mortality and low health-related quality of life [Laiteerapong et al. 2011; McCoy et al. 2012; Signorovitch et al. 2013; Yaffe et al. 2013].
The study has some strengths and limitations. The study generalizability is significant given almost the entire population of older people in NZ is captured in the Pharms database. However, it could not be ascertained whether the dispensed medicines were consumed. A limitation of our study is that the results were based on prescription claim data which did not provide direct diagnostic information to confirm a diagnoses of diabetes. In NZ, new classes of antidiabetic medicines, especially DPP-4 inhibitors and SGLT2 inhibitors, are not subsidized, hence the utilization for these medicines are not reported in this study. Furthermore, the utilization of combination medicines was not examined in the study, as these were not subsidized or funded in NZ.
Conclusion
This population-level study has shown an increase in utilization of antidiabetic medicines in older people in NZ from 2005 to 2013; however, the increase does not seem to reflect a proportional increase in prevalence of diabetes for the study period. Improving access to newer antidiabetic medicines in line with emerging evidence should be a consideration for decision makers.
Footnotes
Acknowledgements
We would like to thank the Analytical Services, Ministry of Health of NZ for supplying the prescription data extracted from the Pharms database.
Funding
The author(s) received no financial support for the research, authorship, and/or publication of this article.
Conflicts of interest statement
The author(s) declared no potential conflicts of interest with respect to the research, authorship, and/or publication of this article.
References
Supplementary Material
Please find the following supplemental material available below.
For Open Access articles published under a Creative Commons License, all supplemental material carries the same license as the article it is associated with.
For non-Open Access articles published, all supplemental material carries a non-exclusive license, and permission requests for re-use of supplemental material or any part of supplemental material shall be sent directly to the copyright owner as specified in the copyright notice associated with the article.