
Abstract
Background:
Metabolic syndrome (MetS) is a common condition marked by abdominal obesity, insulin resistance, hypertension, and hyperlipidemia. It has significant health and economic impacts, highlighting the need for early predictive markers.
Objective:
To compare the prognostic performance of various obesity indices in the 1-year incidence of MetS among adult employees of a private educational institution.
Design:
Cohort study.
Methods:
A prospective cohort study was conducted using data from adults employed at a private educational institution in Lima, Peru. Participants were enrolled in 2019 and followed for 1 year to monitor anthropometric and biochemical parameters. The outcome was the development of MetS at the end of follow-up, defined according to the criteria of the Latin American Diabetes Association. Receiver operating characteristic curves were plotted, and the area under the curve (AUC) with 95% confidence intervals (CI) was calculated to assess the predictive utility of each index for MetS after 1 year.
Results:
Of the 792 adults initially enrolled, 475 were included in the final analysis after exclusions and loss to follow-up. Their average age was 38.4 years, and 54.3% were women. The overall incidence of MetS was 7.4%, with 12% for males and 4% for females. The highest AUC values for predicting MetS were observed for the body mass index (AUC: 0.88; 95% CI: 0.84–0.92), waist-to-height ratio (WHtR; AUC: 0.89; 95% CI: 0.85–0.92), abdominal volume index (AVI; AUC: 0.89; 95% CI: 0.86–0.92), and body roundness index (BRI; AUC: 0.89; 95% CI: 0.85–0.92). In sex-stratified analyses, results were consistent for males. Among females, the body adiposity index also showed good discrimination (AUC: 0.91; 95% CI: 0.83–1.00). The wide 95% CI reflects the small number of incident MetS cases among women (n = 10) and should be interpreted with caution.
Conclusion:
In conclusion, the incidence of MetS after 1 year of follow-up was 7.4%, with a higher rate among males. The WHtR, BRI, and AVI were the most useful anthropometric indices for predicting MetS.
Plain language summary
Metabolic syndrome is a group of health problems that often occur together, such as a large waist size, high blood pressure, high blood sugar, and unhealthy cholesterol or triglyceride levels. People with metabolic syndrome have a higher risk of heart disease and type 2 diabetes. Finding simple ways to identify who is most at risk can help start prevention earlier. In this study, we followed adult employees from a private educational institution in Lima, Peru, for one year. At the start, we measured weight, height, waist and hip size, and took blood tests. We then evaluated which simple body measurements (and combined “indices” based on those measurements) were most useful for identifying people who later developed metabolic syndrome. Over one year, a small but meaningful number of participants developed metabolic syndrome, and it occurred more often in men than in women. Measurements that focus on abdominal fat—especially the waist-to-height ratio and other similar measures—were the most useful for predicting who developed metabolic syndrome. In women, some measures that include hip size also appeared helpful, although the results were less certain because fewer women developed the condition during follow-up. These findings suggest that quick, low-cost body measurements could be used in workplace or primary care health checks to help identify adults at higher risk and support early lifestyle changes. More studies in larger and more diverse groups are needed to confirm the best cut-off values for different populations.
Introduction
The metabolic syndrome (MetS), defined as the coexistence of abdominal obesity, insulin resistance, hypertension, and hyperlipidemia,1,2 has become a major global health challenge. Its prevalence has increased steadily over recent decades in both high-income and low- and middle-income countries (LMICs), with particularly rapid growth in LMICs driven by urbanization and lifestyle changes.1,3–6 Globally, it is estimated that more than 1 billion people are affected by MetS, with significant variation across regions. 1 In Latin America, studies report prevalence rates ranging from 16% to 60% in adults,4,5,7,8 depending on the population studied and the diagnostic criteria applied. In Peru, for example, the prevalence of MetS is estimated to range from 16% to 57%,8–10 reflecting a growing cardiometabolic burden in settings with limited preventive infrastructure.
This condition carries significant clinical and societal consequences. Individuals with MetS have a two- to threefold increased risk of cardiovascular disease, type 2 diabetes, stroke, and premature death.11–14 At the population level, the economic burden is substantial. It is projected that obesity-related cardiometabolic disorders could reduce global gross domestic product by more than 4 trillion US dollars annually by 2035 due to increased healthcare expenditures and productivity loss. 15 These trends underscore the urgent need for timely identification of individuals at risk for MetS, especially in regions undergoing rapid epidemiologic transition.
Anthropometric and adiposity-based indices have been proposed as low-cost, noninvasive tools for early identification of MetS.16–23 These include body mass index (BMI), waist-to-hip ratio (WHR), waist-to-height ratio (WHtR), lipid accumulation product (LAP), body roundness index (BRI), conicity index (CoI), body adiposity index (BAI), abdominal volume index (AVI), visceral adiposity index (VAI), and a body shape index (ABSI).16–23 However, despite their biological plausibility, the literature remains inconclusive regarding which index is most predictive, what cut-off values should be used, and how well these tools perform across different populations.
We prespecified a set of simple, noninvasive indices that cover complementary dimensions of MetS risk. BMI and BAI summarize overall adiposity. WHtR, waist-derived measures such as AVI and CoI, WHR, and shape descriptors (BRI and ABSI) approximate central adiposity and body shape beyond weight alone. LAP and VAI combine triglycerides (TG) with high-density lipoprotein (HDL), capturing the dyslipidemia profile. Assessing these domains in parallel enables a focused 1-year prognostic comparison in a working-age cohort.16–23 Indices such as CUN-BAE or relative fat mass were not included because they rely on additional assumptions and have been less frequently evaluated in prospective prognostic studies of MetS.24,25 Beyond anthropometry, recent evidence further contextualizes cardiometabolic risk stratification and prevention, underscoring the practical value of low-cost screening approaches.26–28
To our knowledge, prospective cohort evidence in Latin America comparing multiple obesity-related indices for incident MetS using standardized methods remains limited. Existing studies are often limited by cross-sectional designs and non-representative samples, which restricts the generalizability and applicability of their findings to broader populations.4,5 To address this gap, we conducted a 12-month prospective cohort study among adult workers at a large private educational institution in Lima, Peru. Focusing on an urban working population is particularly relevant given the increasing prevalence of sedentary behavior in these groups. MetS was defined according to the Latin American Diabetes Association criteria, which incorporate regionally validated waist circumference (WC) cut-offs and are widely used in Latin American populations. 29 Identifying practical screening tools in this context could inform occupational and clinical health strategies aimed at preventing MetS. Thus, we aimed to compare the prognostic performance of 10 obesity-related indices in predicting incident MetS and to identify optimal cut-off values tailored to this population.
Materials and methods
Study design and participants
We conducted an analytical cohort study utilizing data from adults employed at a private educational institution in Lima, Peru, previously collected for surveillance purposes. The enrollment took place in 2019, and they were followed for 1 year to assess various anthropometric and biochemical parameters. These measurements were obtained through laboratory tests conducted by the occupational health service.
Study population and selection criteria
At baseline, we enrolled 792 employees from a private institution, including teachers, administrative, and technical staff. The inclusion criteria required participants to be adult employees of the institution with no prior diagnosis of MetS at the time of enrollment. Participants with known MetS at baseline were excluded from the study, resulting in the exclusion of 185 participants.
Thus, the study commenced with 607 participants. During the follow-up period, 40 participants were lost due to the termination of their employment, and an additional 92 participants were excluded due to insufficient data for anthropometric or biochemical measurements. Consequently, the effective sample consisted of 475 participants, representing 78.2% of the initial cohort (Figure S1). Adults were defined as individuals ⩾18 years. Beyond excluding prevalent MetS at baseline, no additional health-related exclusion criteria were applied at enrollment.
No formal sample size calculation was performed prior to enrollment. The study included all adult employees eligible during the occupational health assessment period in 2019. This pragmatic approach maximized sample size and improved the external validity of our findings. Post hoc power estimates for the primary AUC analyses are provided in Table S1.
Definition of MetS
Our outcome measure was the development of MetS at 1 year of follow-up. We assessed the incidence of MetS following the position statement of the Latin American Diabetes Association. 29 MetS was defined when the participant presented a WC greater than or equal to 94 cm in men and 88 cm in women, along with two of the following criteria: fasting glucose levels ⩾100 mg/dL; triglyceride levels ⩾150 mg/dL; high-density lipoprotein cholesterol (HDL-C) levels <40 mg/dL in men and <50 mg/dL in women, and blood pressure (BP) ⩾130/85 mmHg.
Data collection and laboratory measurements
Measurements were obtained by trained occupational health staff in duplicate for anthropometry (weight, height, waist, and hip circumferences), following standardized protocols. Duplicate anthropometric measurements were averaged using the mean value prior to index calculation. Body weight (kg), height (cm), WC (cm), and hip circumference (cm) were measured according to standard protocols. 30 Similarly, biochemical tests (fasting plasma glucose, serum TG, HDL-C, and total cholesterol) were assessed under strict protocols. An electronic sphygmomanometer was used for BP measurement following the standardized protocol of the American Heart Association. 31 Systolic (SBP) and diastolic blood pressure (DBP) were measured in triplicate, and the results were averaged.
Weight and height were measured twice with an accuracy of 0.5 kg and 0.1 cm, respectively, with participants dressed in light clothing but without shoes, following a standard protocol. Additionally, WC was measured twice at the midpoint between the lower rib and the iliac crest with an accuracy of 0.1 cm. Based on these anthropometric parameters, the following obesity indices were constructed and evaluated: BMI, WHR, WHtR, LAP, BRI, CoI, BAI, AVI, VAI, and ABSI. The 10 anthropometric and adiposity indices were selected based on their previous use in epidemiologic studies and their biological plausibility as predictors of cardiometabolic risk.16–23 These indices are noninvasive, inexpensive to measure, and suitable for large-scale screening in occupational and community settings. Their formulas are provided in Table S2.
Other variables
The following variables were also included: age (years) and sex (female and male).
Statistical analysis
All the statistical analyses were conducted using Stata software version 17 (Stata Corporation, College Station, TX, USA).
Baseline participant data were described using absolute and relative frequencies for categorical variables. For numerical variables, mean ± standard deviation or median and interquartile range were used, depending on the data distribution.
Participants were divided into two groups based on the presence or absence of MetS, and differences between the two groups were examined using the Student’s t test or Mann–Whitney U test after evaluating assumptions. The Chi-square test was employed for categorical variables.
Receiver operating characteristic (ROC) curves were plotted, and the area under the curve (AUC) with 95% confidence intervals (CIs) was calculated to assess the utility of each index in predicting MetS at 1 year, sex-stratified. An AUC close to 1 reflects higher predictive value. Additionally, p-values were calculated to compare the AUCs of the indices to the AUC of BMI, considered a reference measure due to its widespread use in assessing obesity.
Statistical comparisons of AUC values were performed using DeLong’s test. No formal adjustment for multiple comparisons was applied, as analyses were hypothesis-driven based on prior literature suggesting that central adiposity measures may outperform BMI for MetS prediction, and these indices represent correlated measures of adiposity rather than independent constructs.
Cutoff points for the indices were determined using the maximum Youden’s index (sensitivity + specificity − 1, with the highest combination of sensitivity and specificity). The 95% CI of the cutoff points was calculated using bootstrap with 1000 replications. Sensitivity, specificity, positive likelihood ratio (LR+), and negative likelihood ratio (LR−) are also presented. A test with an LR+ greater than 10 was considered useful for establishing the diagnosis of MetS.
Finally, post-test probability was calculated using the Fagan nomogram for indices with an LR+ >10, considering the pre-test probability as the incidence of MetS obtained in our sample. Post-test probabilities are also presented, stratified by gender. The Fagan nomogram allows estimating post-test probability using pre-test probability (MetS incidence) and the combined information of test sensitivity and specificity through the likelihood ratio. For the LR+, the Fagan nomogram allows understanding the probability of having MetS when the test is positive.
No imputation was performed. To evaluate the robustness of these findings independent of demographic factors, we conducted supplementary age- and sex-adjusted analyses. Logistic regression models were fitted for each anthropometric index, including age (continuous, years) and sex (male/female) as covariates. Predicted probabilities from these adjusted models were used to generate age- and sex-adjusted ROC curves and calculate adjusted AUCs.
To assess potential attrition bias, we compared baseline characteristics between participants who completed the 1-year follow-up (n = 475) and those lost to follow-up (n = 132). Continuous variables were compared using Student’s t test or Mann–Whitney U test, as appropriate, and categorical variables using the Chi-square test. Comparisons were based on available data for each variable, as some participants lost to follow-up had incomplete baseline assessments. Statistical significance was set at p < 0.05.
Ethical considerations
The study protocol was approved by the Ethics Committee of Clínica Avendaño (registration number 15-2021-CIEI). The data used in this study were part of the standard health monitoring procedures for the institution’s employees, aimed at ensuring the health and well-being of its workers. We obtained institutional permission to use these existing data for the purposes of this research. No personal identifying information was collected or used, ensuring participant confidentiality. As the data were collected as part of routine health procedures, written informed consent was not specifically obtained for this study. However, participants were informed of the general use of their data through the institution’s standard consent process for health-related monitoring. Data were de-identified prior to analysis, and the program’s routine consent covers health monitoring and the secondary use of aggregated, de-identified data for quality and surveillance purposes.
Results
Table 1 presents the baseline characteristics of the study population based on MetS status at the 1-year follow-up. During the 1-year follow-up, 35 participants developed MetS (7.4% incidence), comprising 25 men (11.5% of 217 male participants) and 10 women (3.9% of 258 female participants). In comparison to participants without MetS, those with MetS were predominantly male (p = 0.001). Additionally, participants who developed MetS had higher baseline values of SBP (p = 0.002), DBP (p = 0.005), body weight (p < 0.001), WC (p < 0.001), as well as higher levels of TG (p < 0.001) and lower HDL-C levels (p = 0.009). Regarding obesity indices, on average, BMI, WHR, WHtR, LAP, BRI, CoI, BAI, AVI, and VAI had higher values in the group that developed MetS (p < 0.001). The overall incidence of MetS was 7.4% (35 of 475 participants; 95% CI: 5.2%—10.1%), 12.0% in males (25 of 217; 95% CI: 7.9%—17.3%), and 4.0% in females (10 of 258; 95% CI: 2.0%—7.1%).
Characteristics of the study population (N = 475).

Data are numbers (percentage), mean (standard deviation), or median (25th percentile and 75th percentile). ABSI and CoI values were multiplied by 100 and 10, respectively, for better understanding in units.
p Value calculated with the Student’s t test, bChi-squared test or cMann–Whitney U test.
ABSI, a body shape index; AVI, abdominal volume index; BAI, body adiposity index; BMI, body mass index; BRI, body roundness index; CoI, conicity index; DBP, diastolic blood pressure; HDL, high-density lipoprotein; LAP, lipid accumulation product; MetS, metabolic syndrome; SBP, systolic blood pressure; VAI, visceral adiposity index; WHR, waist-to-hip ratio; WHtR, waist-to-height ratio.
All AUCs with 95% CIs, p-values, optimal cutoffs with 95% CIs, sensitivity, specificity, and likelihood ratios (LR+, LR−) are reported in Table 2. p-Values reflect nonparametric DeLong comparisons of each index versus BMI.
AUC and optimal cutoff points for anthropometric measurements in relation to MetS, stratified by sex.

AUC comparisons versus BMI were performed using DeLong’s test for correlated ROC curves.
p-Values compare the difference between the AUC of the indices with BMI as a reference.
ABSI, a body shape index; AUC, area under the curve; AVI, abdominal volume index; BAI, body adiposity index; BMI, body mass index; BRI, body roundness index; CI, confidence interval; CoI, conicity index; LAP, lipid accumulation product; VAI, visceral adiposity index; WHR, waist-to-hip ratio; WHtR, waist-to-height ratio.
Age- and sex-adjusted analyses showed minimal changes in AUC for the top-performing indices, and their ranking was preserved. AVI, WHtR, BRI, and BMI remained highly discriminative after adjustment. The larger change observed for BAI likely reflects sex-related confounding rather than improved universal performance (Table S3).
Table 2 and Figure 1 present the performance of obesity-related indices for predicting MetS at 1 year. Overall, the highest AUC values for predicting MetS were BMI (0.88; 95% CI: 0.84–0.92), WHtR (0.89; 95% CI: 0.85–0.92), AVI (0.89; 95% CI: 0.86–0.92), BRI (0.89; 95% CI: 0.85–0.92), and LAP (0.81; 95% CI: 0.74–0.87). In the gender-stratified analysis, the highest AUC values matched the overall analysis for males (25 MetS events), while for females (10 MetS events), in addition to these indices, BAI (AUC: 0.91; 95% CI: 0.83–1.00) was added. The small number of events in women resulted in wide CIs, and these sex-specific estimates should be interpreted with appropriate caution (Table 2).

ROC comparing the accuracy of WC, WHtR, BMI, and LAP for MetS in both genders.
When comparing the AUCs of the indices with the AUC of BMI, it was observed that indices with higher AUCs did not show statistically significant differences from the AUC of BMI (p > 0.05; Table 2). In males, indices with lower AUCs, such as CoI, BAI, VAI, and ABSI, showed statistically significant differences with the AUC of BMI (p < 0.05). In contrast, in females, only WHR, VAI, and ABSI showed statistically significant differences, with the lowest AUC compared to the AUC of BMI (p < 0.05; Table 2).
With the observed AUCs and MetS/non-MetS counts, post hoc power to detect AUC >0.50 was ⩾95% for WHtR, BRI, AVI, BMI, and LAP in the full sample and in men. As expected, power was substantially lower for weaker indices, especially ABSI, and in women for WHR and VAI. Detailed values are provided in Table S1.
Table 2 also presents the different cutoff points according to the Youden index for each obesity index, both generally and gender stratified. Additionally, all the indices demonstrated higher specificity for the incidence of MetS compared to the specificity of BMI. Overall, LR+ values above 10 were observed for BRI (121.43), WHtR (121.43), LAP (11.63), and AVI (35.02). In the gender-stratified analysis, males had higher LR+ values above 10 for BRI, WHtR, LAP, and AVI, while females had the same indices with values above 10, but also for BAI and CoI (Table 2).
Figure 2 presents the Fagan Nomogram for indices with an LR+ above 10. It is evident that the indices with the highest post-test probability were WHtR and BRI, both with 90.7%, followed by AVI with 73.7%. In the gender-stratified analysis, the indices with the highest post-test probability were the WHtR and BRI, both with 89.8%, followed by AVI with 80.3% (Figure 3). In females, it was similar, with WHtR and BRI having a post-test probability of 76.9%, and AVI of 75.6% (Figure 4).

Fagan’s nomogram for WHtR, BRI, AVI, and LAP in both genders.

Fagan’s nomogram for WHtR, BRI, AVI, and LAP in males.
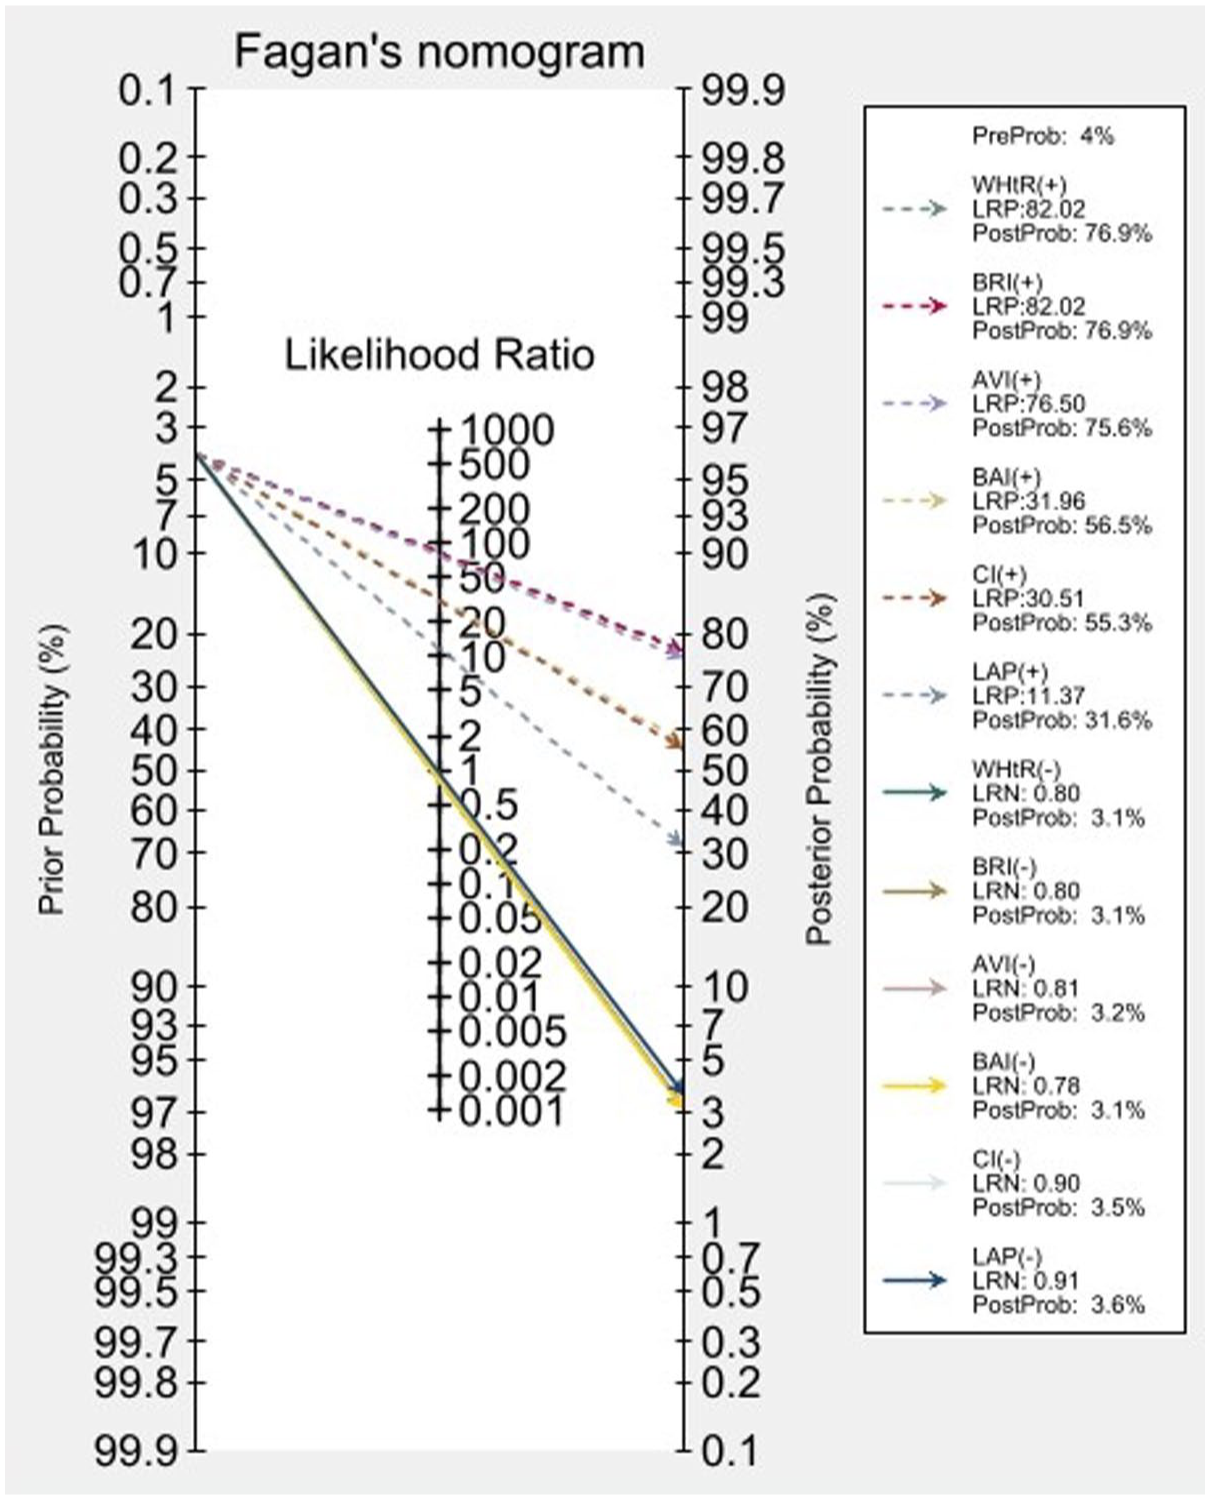
Fagan’s nomogram for WHtR, BRI, AVI, and LAP in females.
Of the 607 participants without MetS at baseline who entered the follow-up period, 475 (78.3%) completed the study and 132 (21.7%) were lost to follow-up. Reasons for attrition included employment termination (n = 40, 30.3%) and insufficient anthropometric or biochemical data (n = 92, 69.7%).
Baseline characteristics of participants who completed follow-up and those lost to follow-up were compared using available data for each variable (Table S4). Participants lost to follow-up had slightly higher baseline DBP (69.9 ± 7.6 vs 67.8 ± 8.2 mmHg; p = 0.024) and triglyceride levels (139.4 ± 98.4 vs 120.7 ± 82.3 mg/dL; p = 0.048). No significant differences were observed for age, sex distribution, other anthropometric parameters, SBP, fasting glucose, or HDL-C levels (all p > 0.05).
Discussion
The key findings of this study show that, overall, the best obesity-associated markers for predicting the occurrence of MetS are BRI, WHtR, LAP, and AVI. In gender distinction, for males, these markers are also the best predictors of MetS at 1 year, and in the case of females, in addition to these markers, BAI and CoI are of note.
BRI, WHtR, and AVI emphasize abdominal fat distribution and body shape, which more closely track visceral adiposity than overall mass; LAP integrates triglycerides with central adiposity, indexing lipid–waist coupling and dyslipidemia. These constructs often separate metabolically adverse fat patterning from total weight, explaining their higher discrimination versus BMI in several settings, including Chinese adults, where multiple obesity- and lipid-related indicators surpassed BMI, and in a real-world cohort where LAP and the cardiometabolic index more accurately identified MetS than BMI alone.16,32 These findings are consistent with recent evidence showing that central-adiposity-based indices outperform BMI for cardiometabolic risk prediction across diverse populations, particularly in LMICs undergoing nutritional transition.26,33
Various cross-sectional studies have assessed the diagnostic performance of obesity-related markers in predicting the occurrence of MetS, yielding disparate results. A cross-sectional study in university workers in Iran found that, compared to other obesity-related markers, the WHtR was the best marker for Mets diagnosis. 21 Another cross-sectional study in Nigeria found no significant differences in the AUC of WC as a predictor of MetS compared to BMI, WHtR, BRI, LAP, CoI, and BAI, both in men and women. 22 In China, another cross-sectional study showed that, along with some lipid-related indices such as LAP, VAI had higher AUC values for MetS prediction than BMI, BRI, AVI, and BAI. 16 In a sample of German adolescents, another cross-sectional study found that BMI demonstrated the best predictive power to identify MetS, with the WHR and WHtR not providing superior values. 18 Similarly, in a cross-sectional study in elderly Iranians, the WHtR was found to be the best predictor of MetS, followed by BMI, AVI, and WC. 19
Similar to these cross-sectional studies, cohort studies have also evaluated the predictive value of these markers. In Iran, one study found that WC, WHR, WHtR, and AVI are good predictors of MetS. 34 In China, WC was found to be a better index than WHtR, BMI, and LAP for predicting MetS in Chinese adults of both sexes from rural areas. 35 However, to our knowledge, only one Chinese cohort study evaluated almost the same markers used in our research, finding that BMI, WC, CoI, WHtR, VAI, and LAP, but not ABSI, were good predictors of MetS. 36 However, our findings showed higher odds of having MetS since several of the evaluated markers had LR+ values above 10. 37 Unlike that study, where most of their LR+ values were below 2, and they presented their results based on the AUC. 36
Although the BMI has traditionally been considered the obesity marker, the existence of metabolically healthy obese patients or normal-weight patients with metabolic markers of obesity has led to questioning its value and searching for new markers. 38 In this context, markers other than BMI have also been studied as factors associated with MetS and other metabolic and cardiovascular outcomes. The association of these markers other than BMI may be linked to the concept of functional body composition, which integrates body components into related regulatory systems. 38 That is, these markers constructed with the combination of individual body components may be associated with their related functional aspects, such as endocrine, metabolic, and inflammatory profiles, and potentially provide a suitable basis for future definitions of metabolically healthy or unhealthy body composition.36,39 For example, regarding the association of these markers and the occurrence of MetS, some studies have shown that this association is mediated by inflammation. In that sense, one study found a positive correlation between WHtR levels and serum malondialdehyde levels. 21 Additionally, there was a negative correlation between WHtR and total antioxidant capacity, serum superoxide dismutase, and catalase levels, although it was not significant. 21
Similar to our results, other studies also reported gender differences.34–36 Although these variations can be attributed to differences in the anthropometric properties of various ethnic groups or variables related to healthy nutritional habits or lifestyles,34,35 it is evident that there are gender differences in the diagnostic performance of these markers. The comparatively stronger performance of BAI among women may be explained by its incorporation of hip circumference, which captures sex-specific body shape and gluteofemoral fat distribution. In women, these features may provide additional metabolic information beyond waist-based measures. However, given the limited number of incident cases among women in our cohort, this finding should be interpreted cautiously and warrants confirmation in larger female samples. 28 Some authors have pointed out that these differences could be explained, for example, by a greater susceptibility of men to obesity-associated factors that predispose them to MetS. 36 In that sense, men are more vulnerable than women to damage caused by smoking or alcohol.36,40,41 Similarly, there are gender differences in the anthropometric measurements that are part of these markers. 36 In Peru, the prevalence of obesity in adults aged 30–59 was 23.8% between 2013 and 2014, being higher in women than in men (28.7% vs 18.3%). 42 As far as we know, only one study in Peru evaluated the diagnostic performance of MetS using BMI, BRI, VAI, ABSI, and WC, finding that in men, ABSI had AUC values below 0.60, and the rest of the markers were above 80, while in women, VAI, BRI, and WC had AUC values above 80. 43 The difference with our study is that they used a cross-sectional design, so they could not verify the performance of these markers in predicting the incidence of MetS. This difference is important because it allows evaluation of the incidence of MetS at 1 year with these markers and the development of interventions based on lifestyle modification to prevent the occurrence of MetS.
The minimal change in discriminative performance after adjustment for age and sex indicates that these anthropometric measures capture body composition information largely independent of demographic factors. This finding has important practical implications: these indices can serve as effective screening tools in occupational health settings without requiring complex algorithms or population-specific adjustments for age and sex. The exception was BAI, which demonstrated substantial improvement after sex adjustment, consistent with known sex differences in hip circumference and gluteofemoral fat distribution. This suggests that BAI may require sex-stratified cutoffs for optimal performance, whereas WHtR, BRI, and AVI appear suitable for universal application within similar populations.44,45
Our results have important implications for public health. As in other parts of the world, the rates of MetS in South America have increased,43,46 demanding the identification of cost-effective methods to identify people at risk. Considering anthropometric implications according to ethnic groups, our findings suggest that some anthropometric markers, which can be easily incorporated into clinical practice, can serve to predict the onset of MetS. Although a Colombian study found that the cutoff point for WC was higher than proposed for the Latin American population, and that the WHtR had a low predictive value for MetS, that study was conducted only in women 5 therefore, our research provides new evidence to consider. Recent population studies corroborate this pattern across settings. In Chinese adults, multi-index comparisons show that lipid-integrative and central-adiposity markers (e.g., LAP, BRI, WHtR) often outperform BMI for MetS classification, with sex-specific differences in ranking.16,36 Similar findings appear in Middle Eastern samples, where AVI and WHtR emerge as optimal predictors of cardiometabolic abnormalities, 47 and in large European datasets using routine check-up data, where simple anthropometrics retain strong diagnostic utility. 48 In Latin American workers, Peruvian data likewise identify WHtR and BRI among the best performers. 43 While absolute cut-offs vary by age, sex, and ethnicity, the relative advantage of indices prioritizing central adiposity and dyslipidemic burden is broadly consistent.16,36,47,49
From an implementation standpoint, WHtR, BRI, AVI, and LAP are inexpensive, quick to obtain, and require minimal training, which facilitates screening in occupational and primary-care settings. External reports in Asian, Middle Eastern, and European cohorts support the portability of these tools16,36,47,48; however, cut-off values are likely population-specific, underscoring the need for local calibration and sex-stratified thresholds in future work.47,48 Our sex-specific estimates and Youden-derived cut-offs address this need for our context and provide a foundation for pragmatic risk stratification in similar urban workforces. 49 Evidence from Asian, Middle Eastern, and European cohorts suggests that these indices retain good performance across settings; however, optimal cut-off values vary by age, sex, and ethnicity, underscoring the need for local calibration in LMICs.26,33
Our study has several limitations that should be considered when interpreting the results. The main limitation is that the study was conducted at a single center, which prevents the results from being nationally representative. Additionally, because the cohort consists of employees from a private institution, a healthy worker effect is possible, meaning selection of relatively healthier workers, which could underestimate the true incidence of MetS and attenuate differences between indices. Finally, 1 year of follow-up may not capture incident cases that emerge over a longer horizon; thus, the AUC estimates and cutoff stability could differ with extended follow-up. However, this study serves as an important precedent for future research in the country. Additionally, since the participants were employees of a private institution, this introduces the potential for occupational bias, limiting the generalizability of the findings to the broader population.
We also acknowledge the lack of data on participants’ dietary habits and physical activity, which may have influenced the development of MetS. Regarding potential biases from self-reported data, we confirm that no self-reported information was used in this study. All anthropometric measurements were taken by trained professionals from the occupational health office, following established protocols to ensure accuracy.
Another limitation is the absence of a formal sample size calculation or power analysis. The sample size was determined based on the availability of data from the participants at the private institution. However, we conducted a post hoc power analysis based on the observed AUCs and event counts. Power to detect AUC >0.50 was ⩾95% for WHtR, BRI, AVI, BMI, and LAP overall and in men, but was limited for ABSI and for WHR and VAI in women, aligning with the wider CIs seen in those subgroups. These findings support the robustness of our main results while highlighting lower precision for weaker indices and in women.
The low number of incident MetS cases in women (n = 10) limited the precision of sex-stratified analyses, as evidenced by wide CIs. While point estimates suggest excellent performance for some indices (particularly BAI in women), these findings require validation in larger female cohorts with longer follow-up periods to achieve adequate statistical power for sex-specific cutoff determination.
Our attrition analysis showed small baseline differences between completers and those lost to follow-up: DBP and triglycerides were slightly higher among those lost. No differences were observed in age, sex, BMI, WC, SBP, fasting glucose, or HDL-C. More than half of those lost had incomplete baseline data, which reduced the sample size for some comparisons. Although unmeasured differences cannot be excluded, the overall similarity in key baseline cardiometabolic factors suggests that attrition is unlikely to have materially biased our main findings.
Despite these limitations, the study provides valuable insights. To our knowledge, this is the first study in Peru to utilize 1-year follow-up data and to provide sex-stratified cut-off points for multiple obesity-related indices for predicting incident MetS. More broadly, prospective cohort evidence in Latin America directly comparing multiple indices using standardized methods remains limited. Future research should include multicenter cohorts with longer follow-up periods, greater female representation, and integration of lifestyle factors to refine sex-specific thresholds and improve long-term prediction of MetS. Such efforts will be essential to validate these findings across diverse occupational and community settings.
Conclusion
In conclusion, incident MetS occurred in a modest proportion of participants over 1 year, with higher incidence in men. WHtR, BRI, AVI, and LAP showed the best discrimination for incident MetS overall and in men, while BAI and CI additionally performed well in women. These cut-offs should be externally validated and recalibrated in larger, more diverse cohorts with longer follow-up.
Supplemental Material
sj-doc-1-tae-10.1177_20420188261428781 – Supplemental material for Obesity indices as predictors of metabolic syndrome: 1-year findings from a Peruvian cohort of private educational institution workers
Supplemental material, sj-doc-1-tae-10.1177_20420188261428781 for Obesity indices as predictors of metabolic syndrome: 1-year findings from a Peruvian cohort of private educational institution workers by Vicente A. Benites-Zapata, Daniel Fernandez-Guzman, Percy Herrera-Añazco, Enrique Moncada-Mapelli, Diego Urrunaga-Pastor and Carlos J. Toro-Huamanchumo in Therapeutic Advances in Endocrinology and Metabolism
Footnotes
Acknowledgements
The authors thank the Universidad Científica del Sur and Donna Pringle for English editing support.
Declarations
ORCID iDs
Supplemental material
Supplemental material for this article is available online.
References
Supplementary Material
Please find the following supplemental material available below.
For Open Access articles published under a Creative Commons License, all supplemental material carries the same license as the article it is associated with.
For non-Open Access articles published, all supplemental material carries a non-exclusive license, and permission requests for re-use of supplemental material or any part of supplemental material shall be sent directly to the copyright owner as specified in the copyright notice associated with the article.