
Abstract
Introduction:
Hypertension and dyslipidemia are the two coexisting and synergizing major risk factors for cardiovascular diseases. The cellular constituents of blood affect the volume and viscosity of blood, thus playing a key role in regulating blood pressure. Overweight and obesity are key determinants of adverse metabolic changes including an increase in blood pressure. The aim of this study was to evaluate lipid profiles and hematological parameters in hypertensive patients at Debre Markos Referral Hospital, Northwest Ethiopia.
Methods:
Laboratory-based cross-sectional study was conducted in 100 eligible hypertensive patients at the hospital. The required amount of blood was withdrawn from the patients by healthcare professionals for immediate automated laboratory analyses. Data were collected on socio-demographic factors, anthropometric measurements, blood pressure, lipid profiles, and hematological parameters.
Result:
The mean serum levels of triglyceride, total cholesterol, and low-density lipoprotein were significantly higher than their respective cut-off values in the hypertensive patients. Besides, 54%, 52%, 35%, and 11% of the hypertensive patients had abnormal low-density lipoprotein, total cholesterol, triglyceride, and high-density lipoprotein levels, respectively. Higher levels of low-density lipoprotein, hemoglobin, and red blood cell count were observed in the hypertensive patients whose blood pressure had been poorly controlled than the controlled ones (p < 0.05). Waist circumference had a significant positive association with the serum levels of total cholesterol and white blood cell count (p < 0.05).
Conclusion:
Hypertensive patients had a high prevalence of lipid profile abnormalities and poorly controlled blood pressure which synergize in accelerating other cardiovascular diseases. Some hematological parameters such as red blood cell count are also increased as do the severity of hypertension.
Introduction
Cardiovascular diseases (CVDs) including hypertension are increasing globally. This increment has become a major concern in resource-limited countries such as Ethiopia. In 2000, about 1 billion people (26.4% of adults) were estimated to have hypertension worldwide, and there is a likelihood of increasing to more than 1.5 billion by 2025 as a result of a high number of aging population in many developed countries and an increasing incidence of hypertension in developing ones. 1 In Ethiopia, it has approximately been estimated that about 35.2% of the population are suffering from hypertension. 2
Several risk factors (modifiable and non-modifiable) play a role in the progression of hypertension. 3 Concerning the genetic and environmental factors affecting hypertension, a study showed that age, sex, hyperlipidemia, diabetes, high body mass index (BMI), alcohol drinking, sodium intake, and others were found to be associated with hypertension. An excessive daily intake of cholesterol and saturated fats, as well as subsequent lipid abnormalities leading to dyslipidemia (hypertriglyceridemia and hypercholesterolemia), is associated with obesity and, consequently, hypertension. 4
Hypertension and dyslipidemia, coexisting in 15%–31%, are the two major risk factors for CVD and account for more than 80% of deaths and disabilities in low- and middle-income countries. 5 These risk factors have an adverse effect on the vascular endothelium, which results in enhanced atherosclerosis resulting in CVD. 6 Abnormalities in serum lipid levels can be recognized as a major modifiable CVD risk factor and has been identified as a risk factor for essential hypertension giving rise to the term dyslipidemic hypertension. 7
Hypertension is not the mere determinant of damage of cardiovascular system, and the likelihood of hypertensive patients, with uncontrolled blood pressure, to develop target organ damage is markedly affected by coexisting risk factors. Among them, lipoproteins are heavily implicated in the atherosclerotic process and greatly influence the impact of hypertension on development of target organ injury and hence cardiovascular morbidity and mortality. 8
In addition, there are number of disputes in various studies with respect to variability of hematological parameters in patients with hypertension and normotensive subjects. The pathophysiology of hypertension is multifactorial which is affected by sympathetic overactivity contributing to changes in hematological parameters such as hematocrit, viscosity, and hypercoagulability of blood. These factors vary the kinetics of blood flow acting as contributory risk factor for coronary artery diseases, stroke, and thromboembolism. 9 Thus, the hematological parameters will give an insight to prognosis of the disease as well. Although different studies have been done on lipid profiles and hematological parameters in hypertensive patients in different parts of the world,10–12 there are no ample data on the condition in Africa and Ethiopia in particular. Moreover, there are no reports on the evaluation of lipid profiles and hematological parameters in the study area as well.
Worldwide, there is broad variation in serum lipid profile among different population groups. Therefore, evaluation and monitoring of modifiable risk factors can be beneficial to reduce CVD-associated morbidity and mortality. Hence, the aim of this study was to evaluate lipid profiles and hematological parameters among hypertensive patients in Debre Markos Referral Hospital (DMRH).
Methods
Study area, design, and period
The study was conducted at DMRH, Debre Markos, located at 300 km northwest of the capital of Ethiopia, Addis Ababa. A laboratory-based cross-sectional study was conducted to evaluate the serum levels of lipid profiles and hematological parameters among hypertensive patients at the hospital from October 2016 to January 2017.
Population
This study included all eligible hypertensive patients attending at DMRH outpatient department in the time interval of the study period. However, patients having an age range of less than 20 years and greater than 70 years, those who were also taking lipid-lowering medications, patients with thyroid disease, pre-eclampsia/eclampsia, hematologic derangements, and those hypertensive patients with co-morbid diabetes mellitus were excluded from the study in advance to settle down the confounding factors.
Sample size determination and sampling method
The sample size was determined based on the prevalence of hypertension (19.6%) in Ethiopia as reported by systematic meta-analysis, 13 using single-population proportion formula with a confidence level of 95%. After sample size adjustment, 100 patients were enrolled in this study for blood sample collection and related data gathering. While purposive sampling technique was implemented to select the healthcare facility, simple random sampling technique was used to get the study participants in the study period.
Variables
Lipid profiles of hypertensive patients (serum total cholesterol (TC), triglycerides (TGs), high-density lipoprotein cholesterol (HDL-C), and low-density lipoprotein cholesterol (LDL-C)) as well as hematologic parameters (hemoglobin, hematocrit, red blood cell (RBC), white blood cell (WBC), platelets, and RBC indices) were considered as dependent variables. On the other hand, socio-demographic factors, anthropometric, and clinical characteristics were also taken as explanatory variables.
Blood sample and data collection procedures
After the study participants had been asked for their consent to be interviewed and to give a blood sample, about 5 mL blood was withdrawn from the study participants, who had fasted overnight. The blood sample was collected by qualified healthcare professionals in the hospital for immediate laboratory analyses. In addition, the questionnaire was filled with a face-to-face interview, and some anthropometric indicators were also assessed and measured side by side as well. The collected blood was allowed to stand for 30 min at room temperature to allow complete clotting and clot retraction. Samples were then centrifuged at 3500 r/min for 15 min to extract serum. The serum was then used to determine the levels of TC, HDL-C, and TG. LDL-C was calculated using the Friedwald formula. 14 About 2 mL of the blood was collected in EDTA-coated tubes, and hematological profiles were determined for all samples using a hematological analyzer (ACT-8; Coulter Electronics). Safety precautions were taken while handling and disposing of blood.
Test principles of the laboratory analytes
Lipid profiles
A commercial kit developed by Coxon and Schaffer was used to estimate serum TC concentration. 15 Desirable or normal cholesterol levels were considered to be those below 200 mg/dL. For determination of serum TG concentration, a commercial kit developed from Cromatest® Cholesterol MR (Linear Chemicals S.L., Barcelona, Spain) was used. 16 Desirable or normal fasting TG levels were considered to be those below 200 mg/dL and are further categorized as borderline, 200–400 mg/dL; high, 400–1000 mg/dL; and very high (>1000 mg/dL). HDL-C was determined by a kit developed from the same source as TG. HDL was measured directly in serum. The apoB-containing lipoproteins in the specimen are reacted with a blocking reagent that renders them non-reactive with the enzymatic cholesterol reagent under conditions of the assay. The apoB-containing lipoproteins are thus effectively excluded from the assay and only HDL-C is detected under the assay conditions. A low HDL-C concentration was considered to be a value below 45 mg/dL. HDL-C values are also used in the calculation of LDL-C (as shown below). LDL-C was calculated from measured values of TC, TG, and HDL-C according to the relationship: LDL-C = TC − HDL-C − (TG/5) where TG/5 is an estimate of very LDL-C (VLDL-C) and all values are expressed in milligrams per deciliter. Desirable levels of LDL-C are those below 100 mg/dL in adults.
Hematological parameters
The Coulter method, automated hematology analyzers, was used to accurately count and size cells by detecting and measuring changes in electrical resistance when a particle (such as a cell) in a conductive liquid passes through a small aperture. Hemoglobin, hematocrit, platelets, RBC count, WBC count, and RBC indices were determined. The RBC count, WBC count, and platelets were determined by the principle of electronic impedance. The hemoglobin which was freed by the lysis of RBCs was combined with potassium cyanide to form a cyanmethemoglobin compound. The absorbance was then measured by spectrophotometry at 550 nm wavelength. Mean corpuscular volume (MCV) was calculated directly from RBC histogram. Mean corpuscular hemoglobin (MCH) was calculated from hemoglobin level and RBC count. In addition, MCH concentration (MCHC) was calculated according to the hemoglobin and hematocrit values. The hematocrit was measured as a function of the numeric integration of MCV. 17
Anthropometrical measurements
The weight of hypertensive patients was measured using a standard balance, and the height was measured using a height measuring device attached to the balance. BMI was then calculated from the body weight (kg) and height (m). 18 Using the World Health Organization (WHO) classification, 19 four categories of BMI can be identified as follows: underweight, <18.5 kg/m2; normal, >18.5–24.9 kg/m2; overweight, >25.0–29.9 kg/m2; and obesity, >30 kg/m2. Waist circumference (WC) and hip circumference (HC) of the patients were also measured. WC was measured over light clothing at the level halfway between the iliac crest and the costal margin in the mid-axillary line after exhaling, when the lungs are at their functional residual capacity, with the subject in standing position with the body weight evenly distributed across the feet. HC was measured over light clothing at the level of greater trochanters with the subject in standing position and both feet together. 18 Two consecutive recordings were made for each site to the nearest 0.5 cm using a non-stretchable fiber measuring tape on a horizontal plane without compression of skin. The mean of two sets of values was used. 20 Waist-to-hip ratio (WHR) was calculated by dividing WC to HC. 18 While the cut-off point considered for WC was >80 cm for females and >90 cm for males to define overweight, the cut-off taken for WHR was >0.8 for females and >0.9 for males as per the criterion of the WHO. 21
Data quality control and management
The data collection questionnaire was well prepared and all variables were filled on the data extraction format daily. All the laboratory procedures were handled by medical laboratory technologists. All the tests were also standardized and automated.
Data processing and analysis
After checking for completeness and cleaning, processing and analysis of the data obtained from laboratory analyses of the blood samples and questionnaires were performed by coding and entering the data into Epi-Data statistical software version 3.1 and then exporting the data to Statistical Package for Social Sciences (SPSS) software version 23 package, and the different variables were tested and analyzed. Simple descriptive statistics were used to present the socio-demographic and clinical characteristics of the study subjects. While chi-square (χ2) tests were used to compare categorical variables, continuous variables were presented as mean ± standard deviation (SD) and were compared using Student’s t-tests for groups. Other associations were performed with Pearson’s correlation coefficient as well as multiple linear regression analysis. A p-value of <0.05 was considered to be statistically significant in all the analyses.
Operational definitions
Dyslipidemia
It is the abnormally elevated levels of any or all lipids and or lipoproteins in the blood. By the same token, it is a defect in lipoprotein metabolism; for example, increased cholesterol, increased TG, increased LDL, and decreased HDL.
Controlled blood pressure
It is the blood pressure that is controlled by antihypertensive drug(s) (Enalapril, Nifedipine, Hydrochlorothiazide, Amlodipine) and/or non-pharmacological treatment, that is, systolic blood pressure (SBP) is lower than 140 mmHg and diastolic blood pressure (DBP) is lower than 90 mmHg.
Uncontrolled or poorly controlled blood pressure
It is the blood pressure not well controlled despite the antihypertensive drugs prescribed, that is, SBP is greater than or equal to 140 mmHg and/or DBP is 90 mmHg or more.
Anthropometric indicators
They are the parameters for the measurement of the human body and its individual parts thereby yielding a quantitative index of their variability. They include height, weight, BMI, WC, and WHR.
Results
Socio-demographic characteristics
The study enrolled 100 sample hypertensive patients, 45 (45%) females, and 55 (55%) males. The average age of hypertensive patients was 51.21 (±12.30) years. The majority of hypertensive patients were found within the age group of 40–59 years. Most of the patients in the study were married (71%), urban residents (78%), and above secondary school (41%). While half of the patients (50%) had a history of alcohol drinking behavior, only 2% of hypertensive patients did smoke cigarette, and there were more male drinkers and smokers than females. In addition, most of the patients (55%) had a history of performing different forms of physical activity (Table 1).
Socio-demographic characteristics of hypertensive patients at DMRH, Ethiopia, October 2016–January 2017.

DMRH: Debre Markos Referral Hospital.
Age, continuous variable, is expressed as mean ± standard deviation.
For the rest of the variables, qualitative, the numbers are in percent out of the total 100 patients.
Anthropometric and clinical features
This study revealed that the average BMI is high-normal (24.60 kg/m2) in the study participants. About 31% and 10% of hypertensive patients were overweight and obese, respectively. Females are affected more frequently than males (18% overweight and 10% obese vs 13% overweight and 0% obese). The study also showed that 36 of 55 (65.45%) males and 41 of 45 (91.11%) females had WC greater than their respective cut-off values, and 49 of 55 (89.09%) males and all (100%) female hypertensive patients had WHR higher than the cut-off value. Among the hypertensive patients, 38% of them were found to have a family history of hypertension, and more than half of the patients (62%) had uncontrolled blood pressure despite at least one antihypertensive drug prescribed. Whereas mean SBP and DBP were found to be 138.18 (±17.86) and 84.55 (±9.19) mmHg, respectively, in males, the mean SBP and DBP of females were 146.22 (±29.64) and 87.33 (±17.63) mmHg, respectively (Table 2).
Anthropometric and clinical features of hypertensive patients at DMRH, Ethiopia, October 2016–January 2017.
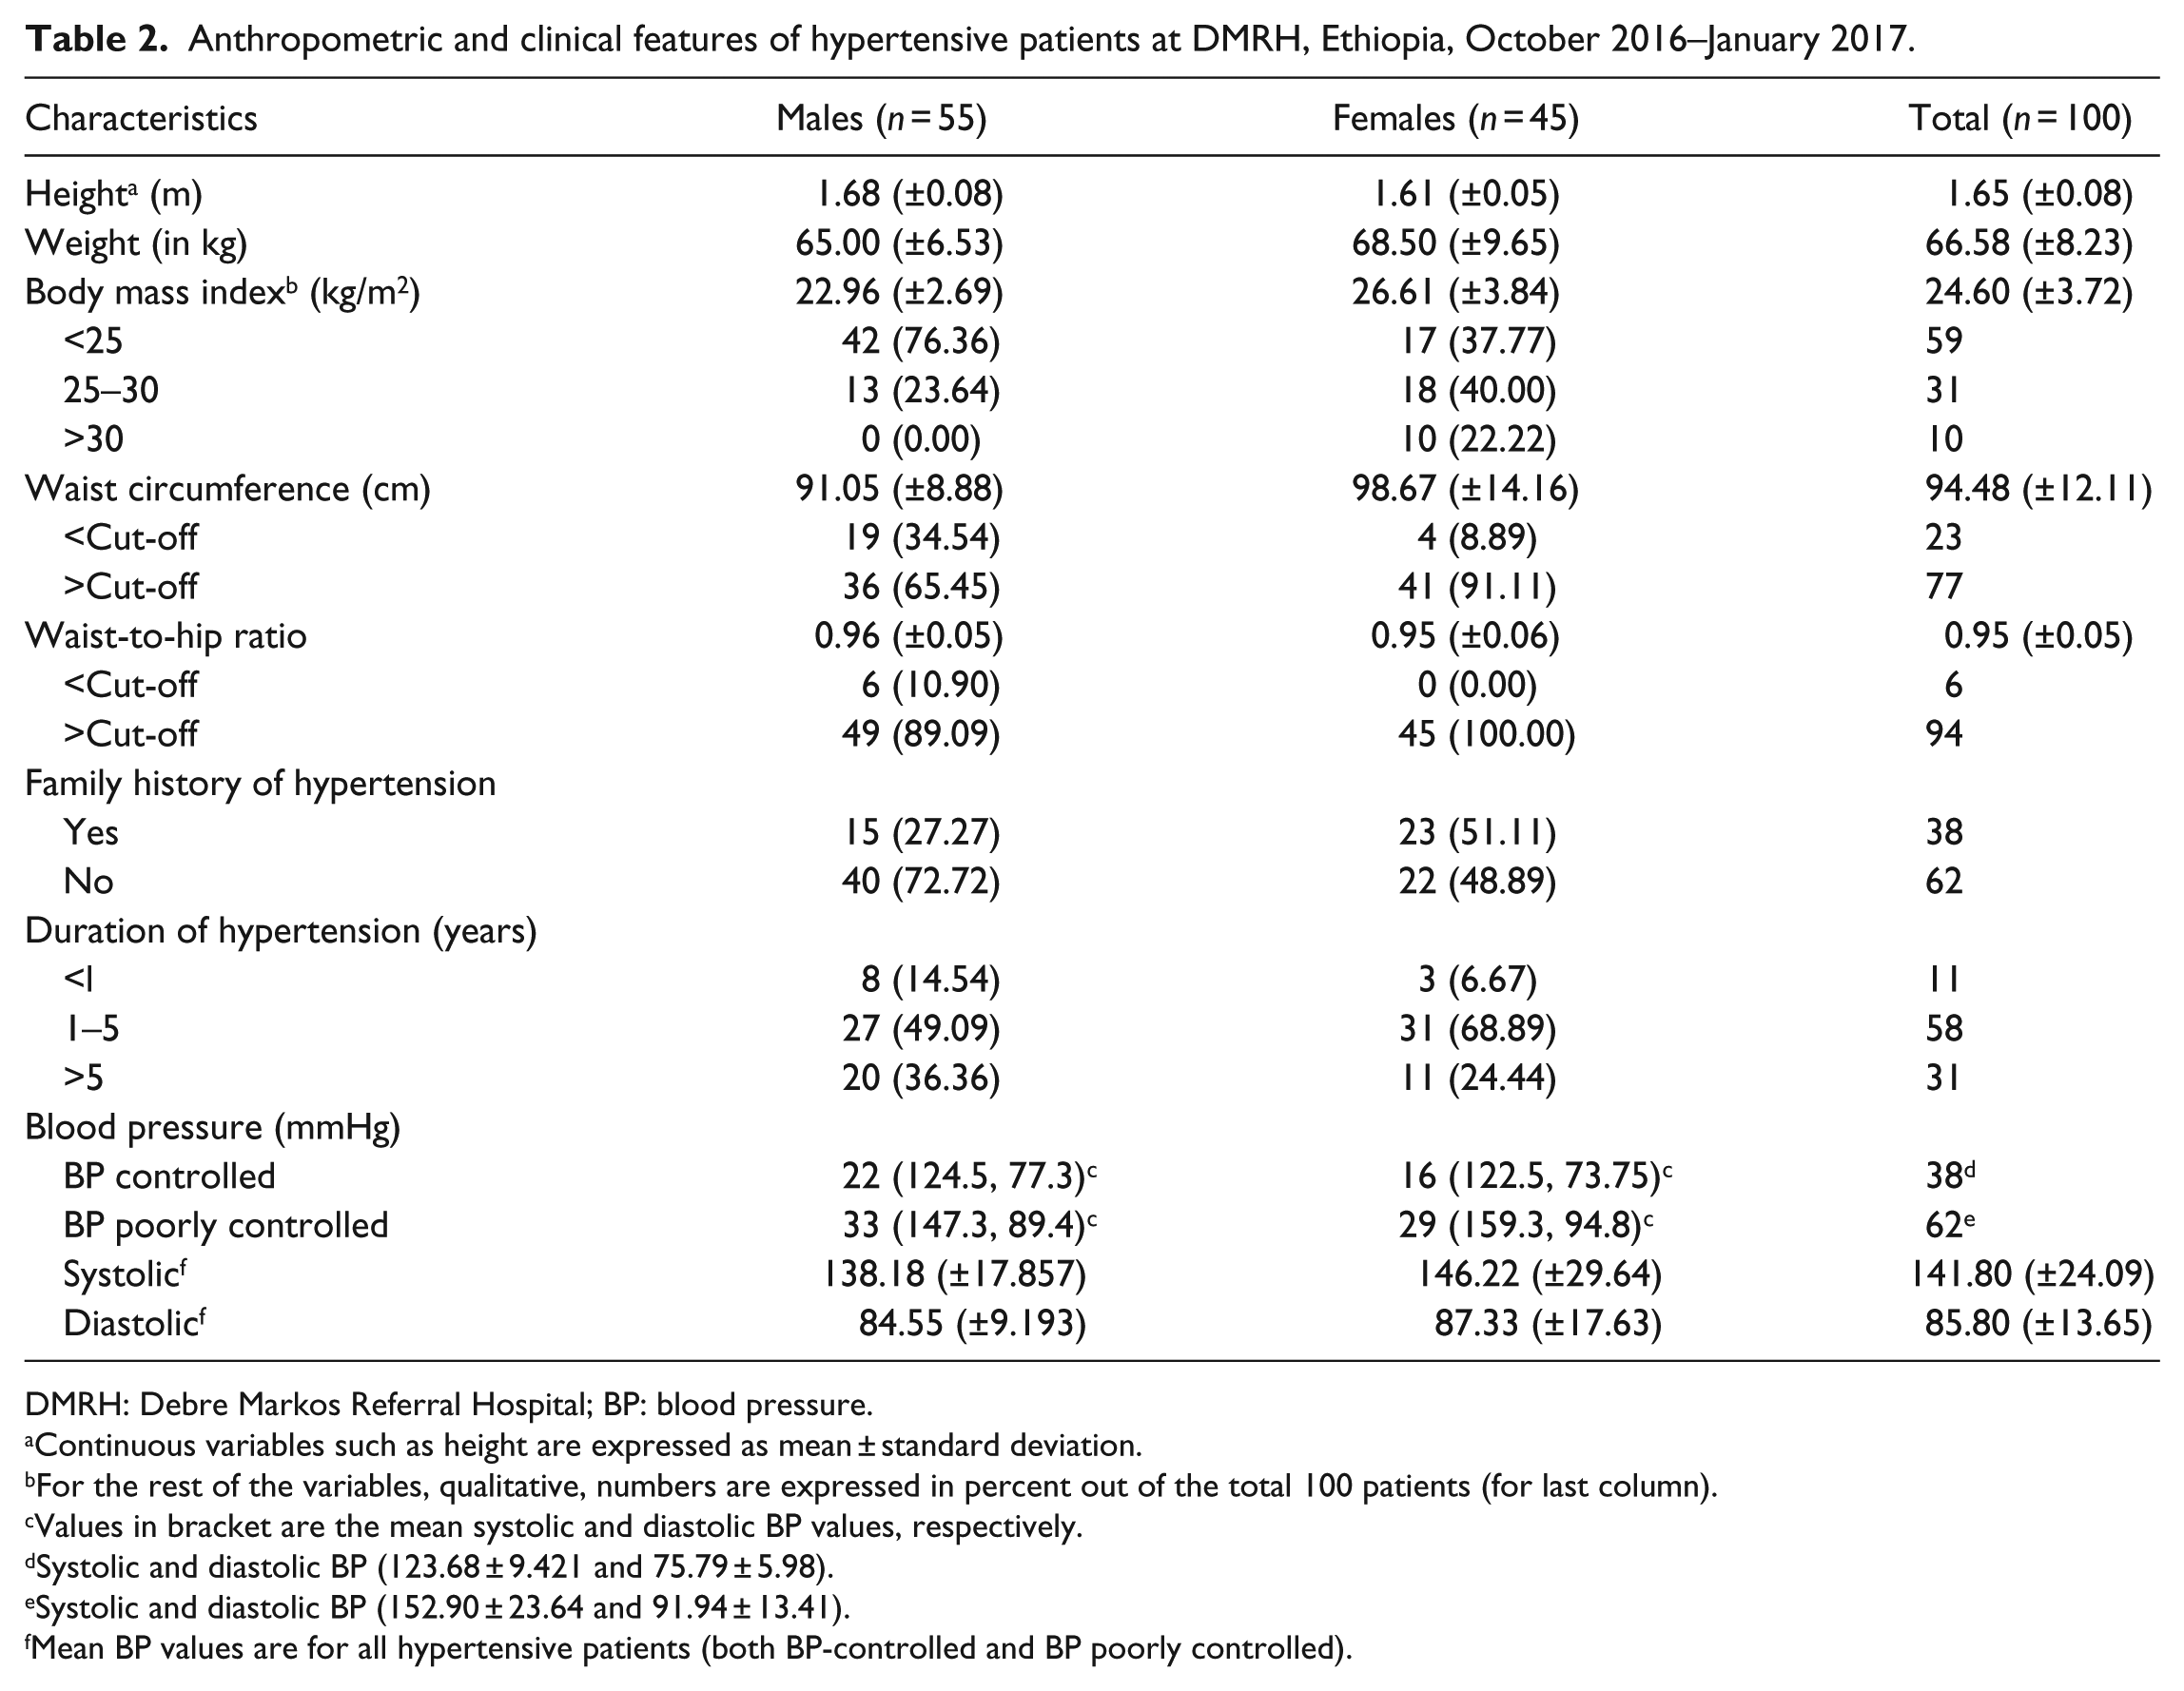
DMRH: Debre Markos Referral Hospital; BP: blood pressure.
Continuous variables such as height are expressed as mean ± standard deviation.
For the rest of the variables, qualitative, numbers are expressed in percent out of the total 100 patients (for last column).
Values in bracket are the mean systolic and diastolic BP values, respectively.
Systolic and diastolic BP (123.68 ± 9.421 and 75.79 ± 5.98).
Systolic and diastolic BP (152.90 ± 23.64 and 91.94 ± 13.41).
Mean BP values are for all hypertensive patients (both BP-controlled and BP poorly controlled).
Levels of lipid panels in hypertensive patients
The mean levels of lipid profile in BP-controlled and BP poorly controlled male and female hypertensive patients are shown in Table 3. The result of this study showed that in male BP-controlled and BP poorly controlled hypertensive patients, the average TC levels were 193.42 (±54.91) and 227.00 (±34.07) mg/dL, and the levels of LDL-C were found to be 106.85 (±38.31) and 128.00 (±36.00) mg/dL, respectively. In addition, the results of this study showed that in the plasma of female BP-controlled and BP poorly controlled hypertensive patients, the average TG levels were 148.88 (±45.59) and 262.59 (±180.53) mg/dL, and the levels of LDL-C were found to be 92.00 (±33.36) and 127.72 (±57.56) mg/dL, respectively. In both sexes, LDL-C levels were significantly higher (p < 0.05) in patients whose BP is poorly controlled than the controlled ones. However, patients with poor BP control had significantly higher levels (p < 0.05) of TC in males and TG in females as compared to good BP control.
Levels of lipid profiles in BP-controlled and BP poorly controlled male and female hypertensive patients at DMRH, Ethiopia, October 2016–January 2017.
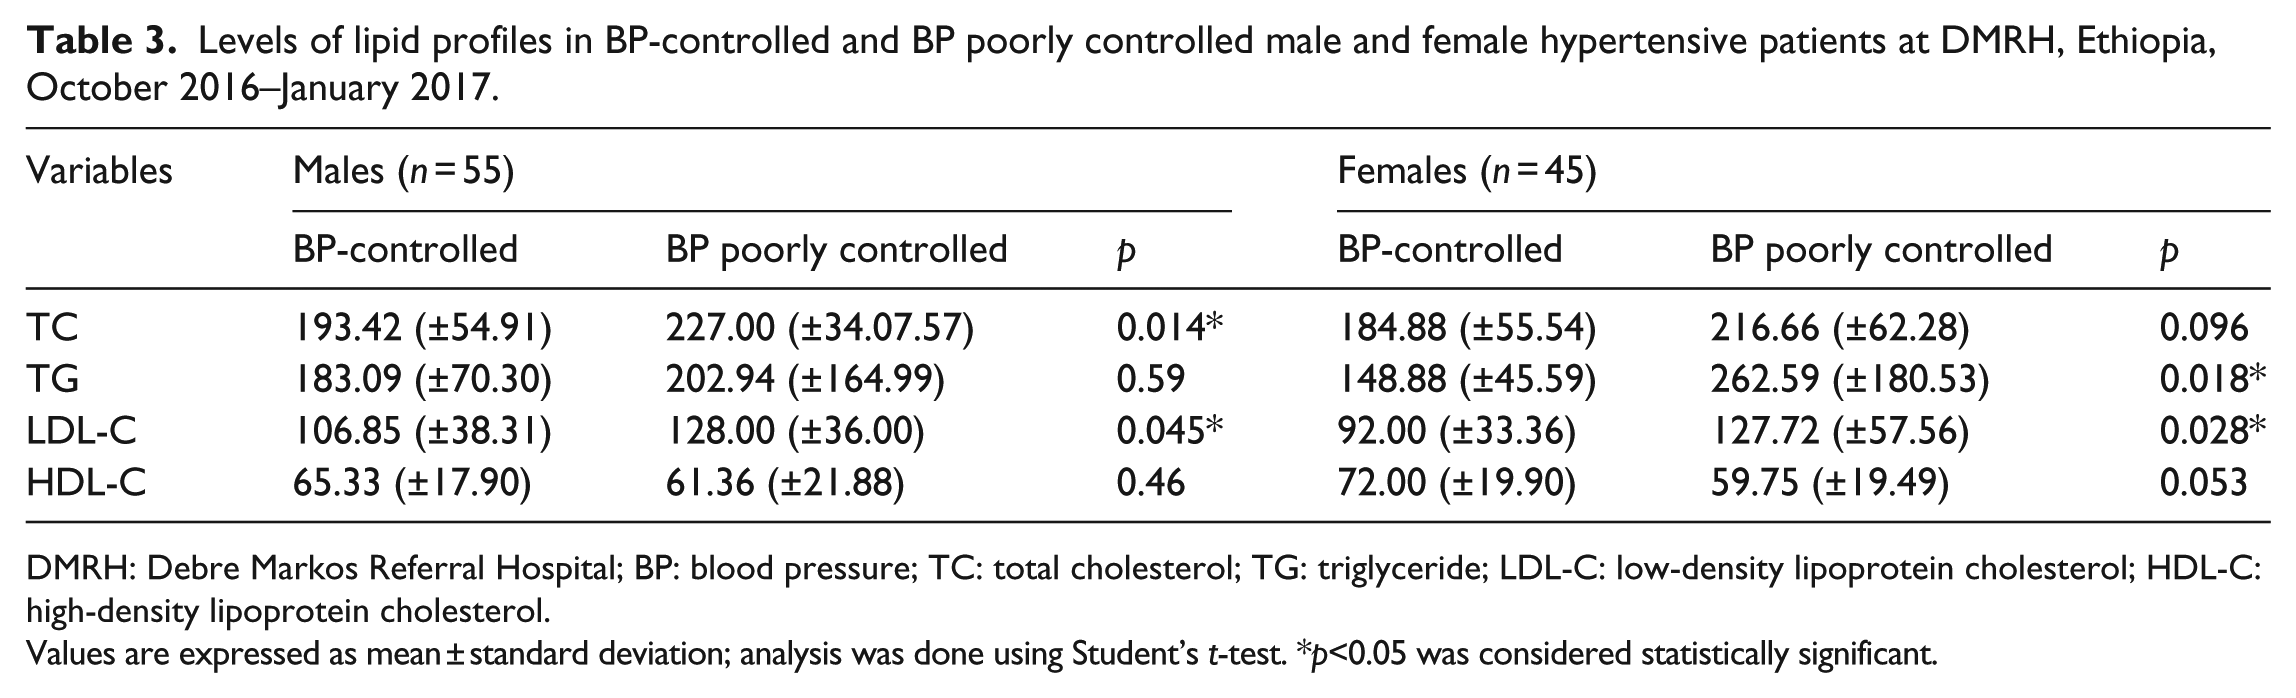
DMRH: Debre Markos Referral Hospital; BP: blood pressure; TC: total cholesterol; TG: triglyceride; LDL-C: low-density lipoprotein cholesterol; HDL-C: high-density lipoprotein cholesterol.
Values are expressed as mean ± standard deviation; analysis was done using Student’s t-test. *p<0.05 was considered statistically significant.
Among 100 hypertensive patients, only 46 (46%) of them had a desirable level of LDL-C which is below 100 mg/dL, the cut-off value for the metabolite. The rest 54 (54%) had an undesirable level of LDL-C, that is, greater than 100 mg/dL. On the other hand, while only 11 (11%) of hypertensive patients showed an undesirable level of HDL-C lipoprotein, in most of the patients (89%) levels of serum HDL-C were found to be within a normal range which is below 45 mg/dL (Figure 1).

Percentage (absolute number) of BP-controlled and BP poorly controlled hypertensive patients having abnormal levels of lipid profiles at DMRH, Ethiopia, October 2016–January 2017.
In the sample hypertensive patients, 48 (48%) of them had normal serum TC level which is below 200 mg/dL, the cut-off level for the metabolite. But the remaining patients (52%) had an abnormal level of TC (>200 mg/dL). Whereas 65% of hypertensive patients had a desirable level of serum TG. In 35% of the patients, levels of serum TG were found to be abnormally high (>200 mg/dL). The proportions of lipid profile abnormalities stratified by sex are depicted in Figure 2. LDL-C and TC abnormalities were more prevalent in males as compared to their female counterparts.

Percentage (absolute number) of hypertensive patients having abnormal levels of lipid profiles stratified by sex at DMRH, Ethiopia, October 2016–January 2017.
Levels of hematological parameters in hypertensive patients
The average levels of the hematological parameters are shown in Table 4. The study showed statistically significant elevation in WBC and RBC levels in BP poorly controlled male hypertensive patients as compared to BP-controlled ones (p < 0.05). Also, it showed statistically significant elevation in platelet levels in BP poorly controlled female hypertensive patients as compared to BP-controlled ones (p < 0.05).
Levels of hematological parameters in BP-controlled and BP poorly controlled male and female hypertensive patients at DMRH, Ethiopia, October 2016–January 2017.

DMRH: Debre Markos Referral Hospital; BP: blood pressure; RBC: red blood cell; WBC: white blood cell; MCV: mean corpuscular volume; MCH: mean corpuscular hemoglobin; MCHC: mean corpuscular hemoglobin concentration; SD: standard deviation. Analysis was done with student t-test.
Data are expressed as mean ± SD.
p-Value <0.05 is statistically significant.
Socio-demographic characteristics and dependent variables
Bivariate, Pearson’s correlation, analyses showed that age was positively correlated with serum, LDL-C (r = 0.274, p < 0.05), HDL-C (r = 0.310, p < 0.05), and TC (r = 0.399, p < 0.05) in hypertensive patients. Linear regression analysis also showed that 7.5%, 9.6%, 7.2%, and 0.8% of the variations in serum LDL-C, HDL-C, TC, and TG levels, respectively, are explained by age. Chi-square test showed that patients who did not perform physical exercise had serum TG level above the cut-off value (p < 0.05).
Independent samples t-test also showed that the mean serum TC level was significantly higher (p < 0.05) in hypertensive patients who had been drinking alcohol than who had not been drinking. In addition, abnormal lipid profiles prevailed in patients having smoking habit. Whereas correlation analyses showed that age is positively associated with RBC count (r = 0.290, p < 0.05) and levels of hematocrit (r = 0.197, p < 0.05). Also, linear regression analyses showed that 3.9% and 8.4% of the variations in hematocrit and RBC levels, respectively, can be explained by age.
Anthropometric, clinical features, and dependent variables
WC had statistically significant positive correlation with the serum levels of TC (p < 0.05). Correlation analysis also showed that there was positive association between WHR and TG, TC, and LDL-C levels. In hypertensive patients, SBP had statistically significant correlation with LDL-C (r = 0.311, p < 0.05) and TG (r = 0.311, p < 0.05). One-way analysis of variance (ANOVA) with Tukey post hoc test also showed that there was a statistically significant variation in the serum TG level between hypertensive patients who had followed the care for more than 5 years as compared to those who had followed the care for less than a year (p < 0.05).
Among hypertensive subjects, there was a statistically significant positive correlation between SBP and RBC count (r = 0.249, p = 0.013), DBP and RBC count (r = 0.303, p = 0.002), WC and WBC count (r = 0.418, p = 0.000), DBP and platelet count (r = 0.212, p = 0.035), WHR and MCV (r = 0.225, p = 0.024), SBP and hemoglobin (r = 0.212, p = 0.034), DBP and hemoglobin (r = 0.296, p = 0.003), and DBP and hematocrit (r = 0.229, p = 0.022). On the other hand, RBC count showed a statistically significant inverse association with WHR (r = −0.198, p = 0.048) in hypertensive patients.
Discussion
This study evaluated the serum lipid parameters (LDL-C, HDL-C, TC, and TG) and hematological parameters (RBC, WBC, hematocrit, hemoglobin, platelets, MCV, MCH, and MCHC) in outpatient hypertensive subjects. Significantly larger proportions of patients were found to have elevated levels of TC, TG, and LDL-C. Some hematological parameters such as hematocrit, WBC, and RBC were also increased in parallel with blood pressure in patients. Anthropometric indicators such as WC were also higher than their respective cut-off values in hypertensive patients.
Levels of lipid profiles in hypertensive patients
The result of this study revealed that the average levels of serum TC and TG were found to be higher than their respective cut-off values. In addition, the mean LDL-C and HDL-C levels were significantly higher than their respective cut-off values. These higher mean levels of TC, TG, and LDL-C in hypertensive patients are in agreement with the results of other related studies which are conducted in different parts of the world including Ethiopia.22–25 A rising trend was also observed for prevalence of lipid abnormalities and serum levels of TG, TC, LDL-C, and decreasing serum level of HDL-C with the severity of hypertension indicating that they are associated with hypertension. These results are in trajectory with a study done by Nayak et al. 26
In this study, the results of the prevalence of different lipid profile abnormalities have been summarized as per the criteria of National Cholesterol Education Program Adult Treatment Panel III (NCEP ATP III). Abnormally high serum level of LDL-C was the most frequently occurring serum lipid profile abnormalities among hypertensive patients, followed by high levels of TC and TG. However, low HDL-C was found to be the most infrequent lipid abnormality in hypertensive patients. But the abnormalities often occurred together rather than in isolation. These findings are comparable with a study done in Nigeria by Osuji et al. who reported that abnormally high serum level of TC was the most frequently occurring serum lipid profile abnormalities among newly diagnosed Nigerian hypertensive patients followed by high levels of LDL-C and low HDL-C. However, elevated TG was found to be the most infrequent lipid abnormality in their study. 27
Despite the comparable results of serum TC, TG, and LDL-C with other studies done in different parts of the world, the study has shown that the serum level of HDL-C was found to be higher as compared to most of the previous studies. However, the elevated HDL-C level was in line with one study done in Nigeria. 28 The reason for this variation in the study area is not clear but may partially be explained that larger proportion of the patients are alcohol drinkers and it is well established that moderate alcohol intake raises HDL-C level by increasing the transport rate of apolipoproteins A-I and A-II.29–31 Abnormalities in serum lipid profiles play a central role in endothelial functional abnormality which is important in the pathogenesis of atherosclerosis, thrombosis, insulin resistance, and hypertension. Lipoproteins rich in TG and LDL-C have been recognized to be toxic to endothelium, while HDL-C may have protective role. Abnormally high serum TC levels are considered to be risk factors for developing macrovascular complications such as coronary heart disease (CHD), stroke, and hypertension. 32
Levels of hematological parameters in hypertensive patients
This study showed statistically significant elevation in WBC and RBC levels between BP-controlled and BP poorly controlled male hypertensive patients, whereas it showed statistically significant variation in platelet levels between BP-controlled and BP poorly controlled female hypertensive patients. Studies have shown that WBC count has been found to be associated with hypertension and its complications. 33 Inflammation may contribute to increasing resistance of microvascular capillary, initiation of platelet aggregation, and increased levels of catecholamine, and there is considerable evidence of an association between inflammation and hypertension. 34
Hemoglobin is the most important determinant of whole blood viscosity. 35 Studies have shown that the concentrations of hemoglobin increased with hypertension in humans. However, only a limited number of large population-based studies have shown a link between hemoglobin concentration and blood pressure. In another study conducted among unselected public employees who did not receive any medication, hemoglobin concentration was significantly associated with hypertension.36,37 In a recent study involving a large cohort of blood donors who were relatively healthy, hemoglobin concentrations were positively associated with both SBP and DBP.38,39 Studies also revealed that three erythrocyte parameters (RBC, hemoglobin, and hematocrit) were found to be associated with hypertension in their cohort study. Hematocrit determines blood viscosity, regulates peripheral vascular resistance, and therefore, in principle, blood pressure.39,40 Therefore, this study generally is concordant to numerous studies conducted in hypertensive subjects.
Socio-demographic characteristics and dependent variables
The majority of hypertensive patients were found within the age group of 40–59 years. This is in line with the previous studies done both in developed and developing countries which consistently reported that age is associated with hypertension.22,28 In addition, this study revealed that age was positively correlated with serum, LDL-C (r = 0.274, p < 0.05), HDL-C (r = 0.310, p < 0.05), and TC (r = 0.399, p < 0.05), in hypertensive patients. This finding is in corroboration with the previous studies.24,27 It is also further supported by studies that reported direct correlation of age and cholesterol levels.41,42 As we age, there is a natural tendency for the blood pressure to rise which could be because of an increase in stiffness of the arteries in the vasculature and endothelial atherosclerotic changes. Wen et al. also reported that there is an age-related progression of arterial stiffness. Blood pressure has an increasingly positive association with arterial stiffness as age increases. 43 Similarly, the results of epidemiological studies have revealed the relation of age with arterial stiffness in patients with hypertension; as age advances, so do the prevalence of hypertension and arterial stiffness.44,45 Hypertension is usually related to other cardiovascular risk factors such as dyslipidemia, diabetes, and obesity. The presence of these cardiovascular risk factors and the resulting endothelial dysfunction may play a role in the pathophysiology of hypertension. 46 As a study done by Jung et al., 47 the adverse impact of insulin resistance on BP was accentuated in older individuals and may have a greater impact than further aging. Plasma insulin concentrations were also found to be correlated (r = 0.31, p < 0.01) with hypertension. 48 This study also showed that the mean serum TC level was higher in hypertensive patients who had been drinking alcohol than who had not been drinking. In addition, abnormal lipid profiles prevailed in patients having smoking habit, which is in line with a study done in Greece. 49
Anthropometric, clinical features, and dependent variables
This study showed that most of the hypertensive patients (62%) had poorly controlled blood pressure: only 38% of patients had well-controlled blood pressure. Although the study did not assess reasons for such high proportion of poorly controlled hypertensive patients, it could possibly and partly be attributed to noncompliance to antihypertensive drugs, poor follow-up in the hospital, lack of adequate health education and counseling related to hypertension and its precipitating risk factors, and financial constraints for antihypertensive drugs and care.
Anthropometric indicators are related to different pathological conditions. Although BMI is a widely used indicator to reflect obesity generally, it fails to account the proportion of weight related to muscle mass or regional distribution of excess fat in the body, both of which influence the health risks related to obesity. Individuals having same BMI may significantly vary in their abdominal fat distribution or mass. 50 For these reasons, a measure of obesity that takes into account the increased risk of obesity-related illnesses because of the accumulation of abdominal fat is desirable. As a result, there is a new tendency to use WC and WHR. This study tried to investigate the associations of some anthropometric indices (BMI, WC, and WHR) and lipid abnormalities in hypertensive patients in the study area. Concordant to a previous study, 51 the result of this study showed that there is correlation between the anthropometric indicators and lipid abnormalities.
There was a positive association between BMI and the lipid profiles. In addition, WC had a significant positive association with the serum levels of TC and weak association with TG, LDL-C, and HDL-C levels. Correlation analysis also showed that there was positive association between WHR and TG, TC, and LDL-C levels and an inverse relation with HDL. TC level, among lipid profiles, showed the closest relationship with WC and WHR ratio. As regression analysis of the study showed, WC and WHR can better predict lipid abnormalities in hypertensive patients.
An increased WC is most likely associated with elevated risk factors because of its relation with visceral fat accumulation. The mechanism may involve excess exposure of the liver to fatty acids and release of detrimental adipocytokines and lower levels of beneficial adipocytokines. These have multiple detrimental effects, including proinflammatory damage, altered signaling pathways, and reactive oxygen species production on beta cells and other tissues resulting in disease states such as hypertension and diabetes. 52 In addition, the accumulation of visceral fat may bring about an increase in sympathetic overactivity which is associated with insulin resistance and hence increasing the activity of the renin–angiotensin–aldosterone system as visceral adipocytes increase angiotensinogen secretion as compared to the subcutaneous fat. 53 Mechanical effect could also be exerted by the accumulation of visceral fat resulting in renal compression and promoting a rise in arterial blood pressure. 54
In hypertensive patients, SBP had statistically significant correlation with serum LDL-C and TG levels which tended to rise as the duration of hypertension advances. Plethora of studies such as a study conducted in Europe, 55 another study carried out in India, 12 in Nigeria, 27 and a study conducted in Ethiopia 24 are in trajectory with this study. Hypertension and lipid abnormalities are well known to frequently coexist and synergize to be risk factors for CVD. The coexistence of increased blood pressure and lipid abnormalities has many clinical implications. Because hypertension and lipid abnormalities synergize to be risk factors for CVD, both of them should cautiously be intervened. Central obesity and consequent insulin resistance which are underlying factors that play major roles in the pathogenesis of both hypertension and dyslipidemia may link the association. Lipid abnormalities, characteristic of metabolic syndrome, were found to predict hypertension and it had also been shown in cohort studies that dyslipidemia in apparently healthy individuals lead to hypertension.7,56
This study also revealed that blood pressure had statistically significant positive correlations with RBC count, hemoglobin, hematocrit, and platelet levels. Although this finding is in corroboration with some of the earlier studies,9,38 it is unlike the finding of Divya and Ashok 12 who reported that hemoglobin and hematocrit showed a negative correlation with SBP among hypertensive patients. This study also showed that WC and WBC count had significant association. Similar finding had been reported in studies conducted in South Korea 57 and Iran. 58 On the other hand, RBC count showed a statistically significant inverse association with WHR in hypertensive patients. As discussed above, WC is related to visceral fat accumulation which leads to release of detrimental proinflammatory cytokines that can increase the WBC count.
Limitation of the study
Even if this study incorporated important laboratory-based findings in the hypertensive patients prospectively, it is not without potential limitations. The sample size seems small and the study was conducted in one healthcare setting due to budget constraint. The study also targeted only hypertensive patients taking medications and did not compare with normotensive subjects. It is also a cross-sectional study which cannot address the future impacts of BP-controlled and BP poorly controlled patients.
Conclusion
The study concluded that hypertensive patients had high prevalence of lipid profile abnormalities and poorly controlled blood pressure in the study area. Some hematological parameters such as RBC count and WBC count were also increased in hypertensive patients as a factor of their blood pressure increases. Significantly higher proportions of hypertensive patients were overweight and obese which seems to contradict the claim that overweight in Ethiopian population is less prevalent. TC level, among lipid profiles, showed the closest relationship with WC and WHR. WC and WHR can better predict lipid abnormalities in hypertensive patients.
Footnotes
Acknowledgements
The authors acknowledge Addis Ababa University for funding this research work. They also extend their thanks to DMRH staff for their kindly support during data collection. A.G. conceived, designed and conducted the study, acquired, analyzed, and interpreted the data; N.G. supervised the study; M.M. supervised the study; M.S. and A.Z. were involved in study design, data acquisition, analysis and interpretation of results, and prepared the manuscript for publication; all the authors participated in manuscript writing and approved the final version.
Declaration of conflicting interests
The author(s) declared no potential conflicts of interest with respect to the research, authorship, and/or publication of this article.
Ethical approval
Before starting data collection and preliminary study, ethical clearance letter with reference no. SOM/DRERC/BCHM031/2009 was obtained from the Departmental Research and Ethics Review Committee, Department of Biochemistry, College of Health Sciences, Addis Ababa University. Besides, collaboration letter for data collection was also obtained from DMRH.
Funding
The author(s) received no financial support for the research, authorship, and/or publication of this article.
Informed consent
Samples and data were collected after written informed consent had been obtained from study participants. Confidentiality, anonymity, neutrality, accountability, and academic honesty were maintained throughout the study