
Abstract
Background:
Practice of Open-source Android artificial pancreas systems (AAPS) among Chinese patients is increasing, but data on their effectiveness is lacking.
Objectives:
This study evaluates the effectiveness of AAPS compared with sensor-augmented pump (SAP) therapy among people with type 1 diabetes (T1D) in China.
Design:
A real-world, case-control study.
Methods:
We conducted this study among patients with T1D who had used AAPS or SAP therapy for >3 months. Propensity score matching (1:1) based on onset age, duration, gender, and baseline tight glucose range (time in the tight glucose range (TITR) 70–140 mg/dL) was performed. Key glycemic outcomes were analyzed.
Results:
One hundred forty-two T1D people using AAPS and 142 matched people receiving SAP therapy were included (56.00% female). Age and duration of T1D were 26.40 (interquartile range (IQR) 11.30–34.70) and 3.20 (IQR 0.87–9.12) years, respectively. Baseline TITR and time in the target glucose range (TIR) of 70–180 mg/dL were 57.10 ± 18.30% and 79.30% (IQR 68.50–88.30), respectively. After 3 months, the AAPS group had better TITR (60.52 ± 14.57% vs 56.20 ± 17.22%, adjusted difference, 3.91%; p < 0.05) and TIR (79.12 ± 11.24% vs 77.37% (IQR 64.51–85.87), adjusted difference, 3.42%; p < 0.001) compared with the control group. In addition, time in hypoglycemia was shorter in the AAPS group than in the control group during the study (4.05% (IQR 2.52–6.78) vs 5.68% (IQR 2.69–10.11); adjusted difference, −1.17%; p < 0.05). Stratified analysis showed females, with a baseline glucose management indicator (GMI) < 7% and those aged over 18 years benefit more in the AAPS group. After adjusting for age, gender, duration of T1D, and baseline GMI, logistic regression analysis showed the AAPS group had a higher percentage of TITR improvement >5% than that in the control group (odds ratio = 1.73, 95% confidence interval (1.03, 2.92), p < 0.05).
Conclusion:
AAPS is associated with significant improvements in glycemic control, without increasing hypoglycemia, compared to SAP therapy.
Introduction
Type 1 diabetes (T1D) is a chronic disease marked by immune-mediated depletion of β-cells, leading to an absolute insulin deficiency and necessitating lifelong dependence on exogenous insulin. 1 Blood glucose levels in patients with T1D are closely related to their quality of life, 2 long-term complications,3,4 and life expectancy. 5 Despite technological advances, such as continuous glucose monitoring (CGM) and insulin pumps, many patients fail to achieve satisfactory glycemic control. 6 The challenge in managing blood glucose levels in T1D stems from the insulin dose that needs frequent and refined adjustment. 7 However, most current treatment methods cannot automatically adjust insulin dosages based on real-time individual needs.
The Artificial Pancreas System (APS) simulates physiological insulin delivery by integrating CGM, control algorithms, and insulin delivery devices. 8 Evidence from studies9–13 indicates that APS significantly improves glycemic control and quality of life for patients with T1D of all ages and is effective across various scenarios.14,15
Since the limited availability of commercial products, “Do-It-Yourself Artificial Pancreas Systems” (DIYAPS) were developed by individuals or the diabetes community, open for access. 16 Among these DIYAPS, AndroidAPS is an Android-based system that uses algorithms Oref0 and Oref1, which maintain blood glucose within an individual target range by adjusting the temporary basal rate and adding additional features that perform meal boluses without user input, respectively. 17
Despite substantial datasets from DIYAPS users indicating improvements in glycemic control, time in target glucose range, hypoglycemia, and quality of life following using DIYAPS, most studies have either compared before-and-after data within the same individual; and randomized controlled trials were mainly carried out among west populations, which limited the generalization to other populations and cultures.18–21 Evidence of the effectiveness of DIYAPS, as compared with sensor-augmented pump (SAP), is still limited, especially in low and middle-income countries. In this study, we aimed to compare the effectiveness of open-source Android artificial pancreas systems (AAPS) and SAP in glycemic control based on a real-world dataset of Chinese individuals with T1D.
Methods
Study design and participants
This is a real-world, retrospective, case-control study conducted among patients with T1D from 29 provincial-level administrative regions of the People’s Republic of China who used AAPS or underwent SAP therapy between January 2019 and April 2024.
Data source
Our data source is the TangTangQuan (TTQ; http://www.ttq.so/). TTQ is a Chinese mobile application designed to provide diabetes self-management education for patients with T1D. Up to now, TTQ has been recognized as the largest online resource and support community for T1D patients in China. 22 TTQ also runs an online cloud platform supported by the Nightscout system (http://www.nightscout.info/).22,23 This web-based cloud platform provides free upload and storage of CGM and insulin pump data from the users, and remote online access to CGM data in real-time by the user and user-authorized individuals. The large user community and the cloud platform enabled us to recruit participants and collect their data. Based on the results of recruitment, we used data from TTQ and its cloud platform between January 2019 and April 2024.
We included AAPS users who complied the following criteria into analysis: The user (1) have been diagnosed with T1D by an endocrinologist or a pediatrician; (2) were initial users of AAPS; (3) had continuous record of AAPS use for 3 months, with any single episode of open-loop no longer than 7 days; (4) were willing to donate their CGM and insulin pump data, and fill in an online questionnaire on their clinical information. Individuals were excluded if (1) they were diagnosed with types of diabetes other than T1D, or their diabetes type was unknown; (2) they took oral antidiabetic medication during the studied period; (3) they were pregnant or giving breast-feeding. The individuals who underwent SAP had the same inclusion or exclusion criteria, except that they used SAP during the studied period and did not change their treatment regimen for at least 3 months. Groups within the patients with T1D are defined as non-adults (<18 years) and adults (⩾18 years).
Data collection
The following demographic, clinical information, and CGM data of patients with T1D were obtained from the TTQ, and cloud platform: (1) Demographic data: gender, age at the initial of AAPS (years), body mass index (BMI, kg/m2), systolic blood pressure (SBP, mmHg), diastolic blood pressure (DBP, mmHg), self-reported smoking and alcohol. (2) Diabetes-related information: glycated hemoglobin (HbA1c, %) at onset, duration of T1D (years), diabetic ketoacidosis (DKA) at onset, self-reported presence of chronic complications (diabetic nephropathy, diabetic retinopathy, diabetic peripheral neuropathy, diabetic foot), total CGM use time (days), total daily insulin dosage (U/day), basal insulin dosage (U/day). (3) CGM data: The raw CGM data from all participants were downloaded from the Nightscout system’s cloud platform (http://www.nightscout.info/). 23 To better capture glycemic control during the early transition from previous therapies to the AAPS or SAP system, when the effects of the intervention were not yet fully established, we chose to use the first 7 days of CGM data as the baseline. 24 The study period was defined as the first 3 months of treatment with AAPS or SAP.
Exposure
AAPS group
AAPS is an open-source, Android-based automated insulin delivery system that incorporates the OpenAPS algorithm. It interacts with an Android smartphone, a CGM device, and an insulin pump. The AAPS algorithm generates multiple future glucose predictions to estimate the lowest projected glucose level and dynamically adjusts insulin delivery to maintain glycemic values within a predefined target range. Moreover, AAPS enables automated insulin coverage without prior carbohydrate announcement through the “unannounced meal” (UAM) feature, using super micro bolus (SMB) to respond quickly to rising glucose levels. In addition, features such as “auto-sensitivity” respond to glucose fluctuations beyond the predicted range.
In this study, the AAPS is equipped with CGM devices, including SIBIONICS® CGM and AiDEX G7, and the insulin pump includes DanaR, DanaRS, and Equil.
CGM data is uploaded to Nightscout (http://www.nightscout.info/), 23 an open-source, cloud-based real-time remote monitoring and management of blood glucose levels. Users can share their glucose data with diabetes management teams and family members and set alerts to promptly address high or low blood glucose levels, preventing hypoglycemia or hyperglycemia.
In addition, AAPS was used by individuals with T1D or their family members who had voluntarily chosen to initiate the system. Most participants independently installed AAPS on their own Android smartphones using the open-source code. However, a structured support module was provided through the TTQ community to ensure safety and effective system use. TTQ established an online support platform composed of a peer support network formed by experienced AAPS users and the TTQ team responsible for the after-sales team in TTQ for insulin pumps and CGM devices. The platform provided nonmedical technical support, including guidance on using insulin pumps and CGM devices and troubleshooting, education on parameters such as Insulin Sensitivity Factor (ISF), experience sharing on system use, and frequently asked questions.
Control group
Patients in the control group used CGM devices—including AiDEX G7, FreeStyle Libre 2, Sinocare iCan i3, and SIBIONICS CGM—in combination with insulin pumps for glycemic management. Similar to the AAPS group, patients in the control group received nonmedical technical support through the peer support network and after-sales service team on the TTQ platform. This support included system installation, parameter setup, troubleshooting, and answers to frequently asked questions. All data were uploaded to the Nightscout platform (http://www.nightscout.info/) for centralized monitoring and analysis. 23
Outcomes
Based on the consensus statement issued at the 2023 International Consensus Statement on reporting CGM Metrics in Clinical Trials, we selected the core CGM metrics most useful in clinical practice for our outcomes.25,26 Raw CGM data downloaded from Nightscout were calculated using R software (the University of Auckland, New Zealand; Comprehensive R Archive Network) (Supplemental Table S1).
Primary outcomes included the percentage of time in tight (time in the tight glucose range (TITR) 70–140 mg/dL) and time in the target glucose range (TIR 70–180 mg/dL). Secondary outcomes included hypoglycemia, represented by the percentage of time with glucose below 54 mg/dL (time below the target glucose range (TBR) < 54 mg/dL) and below 70 mg/dL (TBR < 70 mg/dL), as well as hyperglycemia, shown as the percentage of time with glucose above 140 mg/dL (time above the target glucose range (TAR) > 140 mg/dL), above 180 mg/dL (TAR > 180 mg/dL) and above 250 mg/dL (TAR > 250 mg/dL). Additional measures included mean glucose levels, median glucose levels, glucose standard deviation (SD), and coefficient of variation (CV), as well as the glucose management indicator (GMI). CGM data includes three distinct periods: whole day (24 h), nighttime (00:00–06:00), and daytime (06:00–24:00). The daytime period is further divided into mealtime (11:30–14:30), which reflects the most common lunch period reported in the questionnaires and Chinese food culture, and non-mealtime (06:00–11:30; 14:30–24:00).
Statistical analyses
All statistical analyses were performed using R software (version 4.4.0). The 1:1 Propensity score matching (PSM) analysis minimized the baseline differences between the AAPS and control group. The PSM model was obtained from a logistic regression analysis that included age, gender, diabetic duration, and baseline TITR. A standardized mean difference with an absolute value below 0.10 was considered indicative of negligible differences in covariates across groups. Continuous variables are summarized as mean (± SD) if normally distributed or median and interquartile range (IQR: Q1–Q3) if not normally distributed. Categorical variables are summarized as counts and percentages. Statistical differences between control and AAPS groups were analyzed by the Student’s t test or Mann–Whitney U tests, where appropriate. Statistical differences between baseline and study period were analyzed by the t test or Wilcoxon signed-rank test, where appropriate. The Chi-square test or Fisher’s exact test for categorical variables. Differences in CGM metrics between the AAPS and control groups at 3 months were compared using analysis of covariance, adjusting for baseline values. Binary Logistic regression analysis was performed to identify whether the use of AAPS affected the blood glucose outcome. p Values with a two-sided significance level of 0.05 were considered significant.
Results
Participant characteristics
A total of 284 participants (142 in AAPS group and 142 in control group) were included from January 2019 through April 2024 (Supplemental Table S2 and Figure S1). Overall, among the included participants, 56.00% were female (159/284), with a median age of 26.40 years (IQR 11.30–34.70), and a median duration of T1D was 3.20 years (IQR 0.87–9.12). Additionally, we observed that the participants were well controlled, with a median baseline HbA1c of 6.90% (IQR 6.20–7.50) and a mean (± SD) baseline TITR of 57.10% ± 18.30%. Total CGM use time in AAPS group was longer than that in control group (227 days (IQR 179–284) vs 143 days (IQR 135–162)). The median total daily insulin dosage was 28.90 (U/day; IQR 18.70–41.20) and basal insulin dosage was 7.54 (U/day; IQR 3.77–10.50) in the AAPS group. Table 1 shows that there were no statistically significant differences observed in other basic characteristics between the AAPS and control groups, except for DBP, drinking, smoking, and total CGM use time.
Baseline characteristics of participants with T1D.

Data are presented as mean (SD), median (interquartile range), or number (%).
Chronic complications including diabetic nephropathy, diabetic retinopathy, diabetic peripheral neuropathy, and diabetic foot.
AAPS, Android artificial pancreas systems; BMI, body mass index; CGM, continuous glucose monitoring; DBP, diastolic blood pressure; DKA, diabetic ketoacidosis; HbA1c, glycated hemoglobin; SBP, systolic blood pressure; SD, standard deviation; SMD, standardized mean difference; T1D, type 1 diabetes; TIR, time in the target glucose range; TITR, time in the tight glucose range.
Glycemic control
For the whole 24-h period, the mean TITR increased from 57.58% ± 16.42% to 60.52% ± 14.57% in AAPS group, equal to an increase of 42.34 min per day compared with baseline (p < 0.05), while in control group, the mean TITR was essentially unchanged (56.70% ± 20.11% vs 56.20% ± 17.22%, p > 0.05), the adjusted between-group difference in TITR was 3.91%, which corresponded to being on average 56.30 min per day more in the range 70–140 mg/dL when using AAPS. Similarly, the mean TIR in AAPS group was also better than in control group (79.12% ± 11.24% vs 77.37% (IQR 64.51–85.87); adjusted difference, 3.42%; p < 0.001), which means the between-group difference per day was 49.25 min. Time spent in hyperglycemia was reduced more in AAPS group than in control group compared with baseline, with between-group differences of 2.55% in TAR > 140 mg/dL and 1.96% in TAR > 180 mg/dL, representing 36.72 and 28.22 min less spent, respectively, when using AAPS. After adjusting for baseline differences, time in hypoglycemia was shorter in AAPS group than in control group during the study (TBR < 70 mg/dL, 4.05% (IQR 2.52–6.78) vs 5.68% (IQR 2.69–10.11); adjusted difference, −1.17%; p < 0.05) (Table 2). Thus, we found that the AAPS group significantly increased the TITR and TIR without increasing hypoglycemia compared with the control group. We also observed no significant differences in GMI, mean glucose, median glucose, CV, and SD between the two groups after adjusting for differences at 3 months (Supplemental Table S3). In the sensitivity analysis with additional matching on glucose variability (SD) and BMI, the AAPS group continued to show a glycemic improvement trend consistent with the primary analysis (Supplemental Table S4).
Difference in glycemic metrics (primary outcomes) between baseline and after 3 months in the control and AAPS groups.
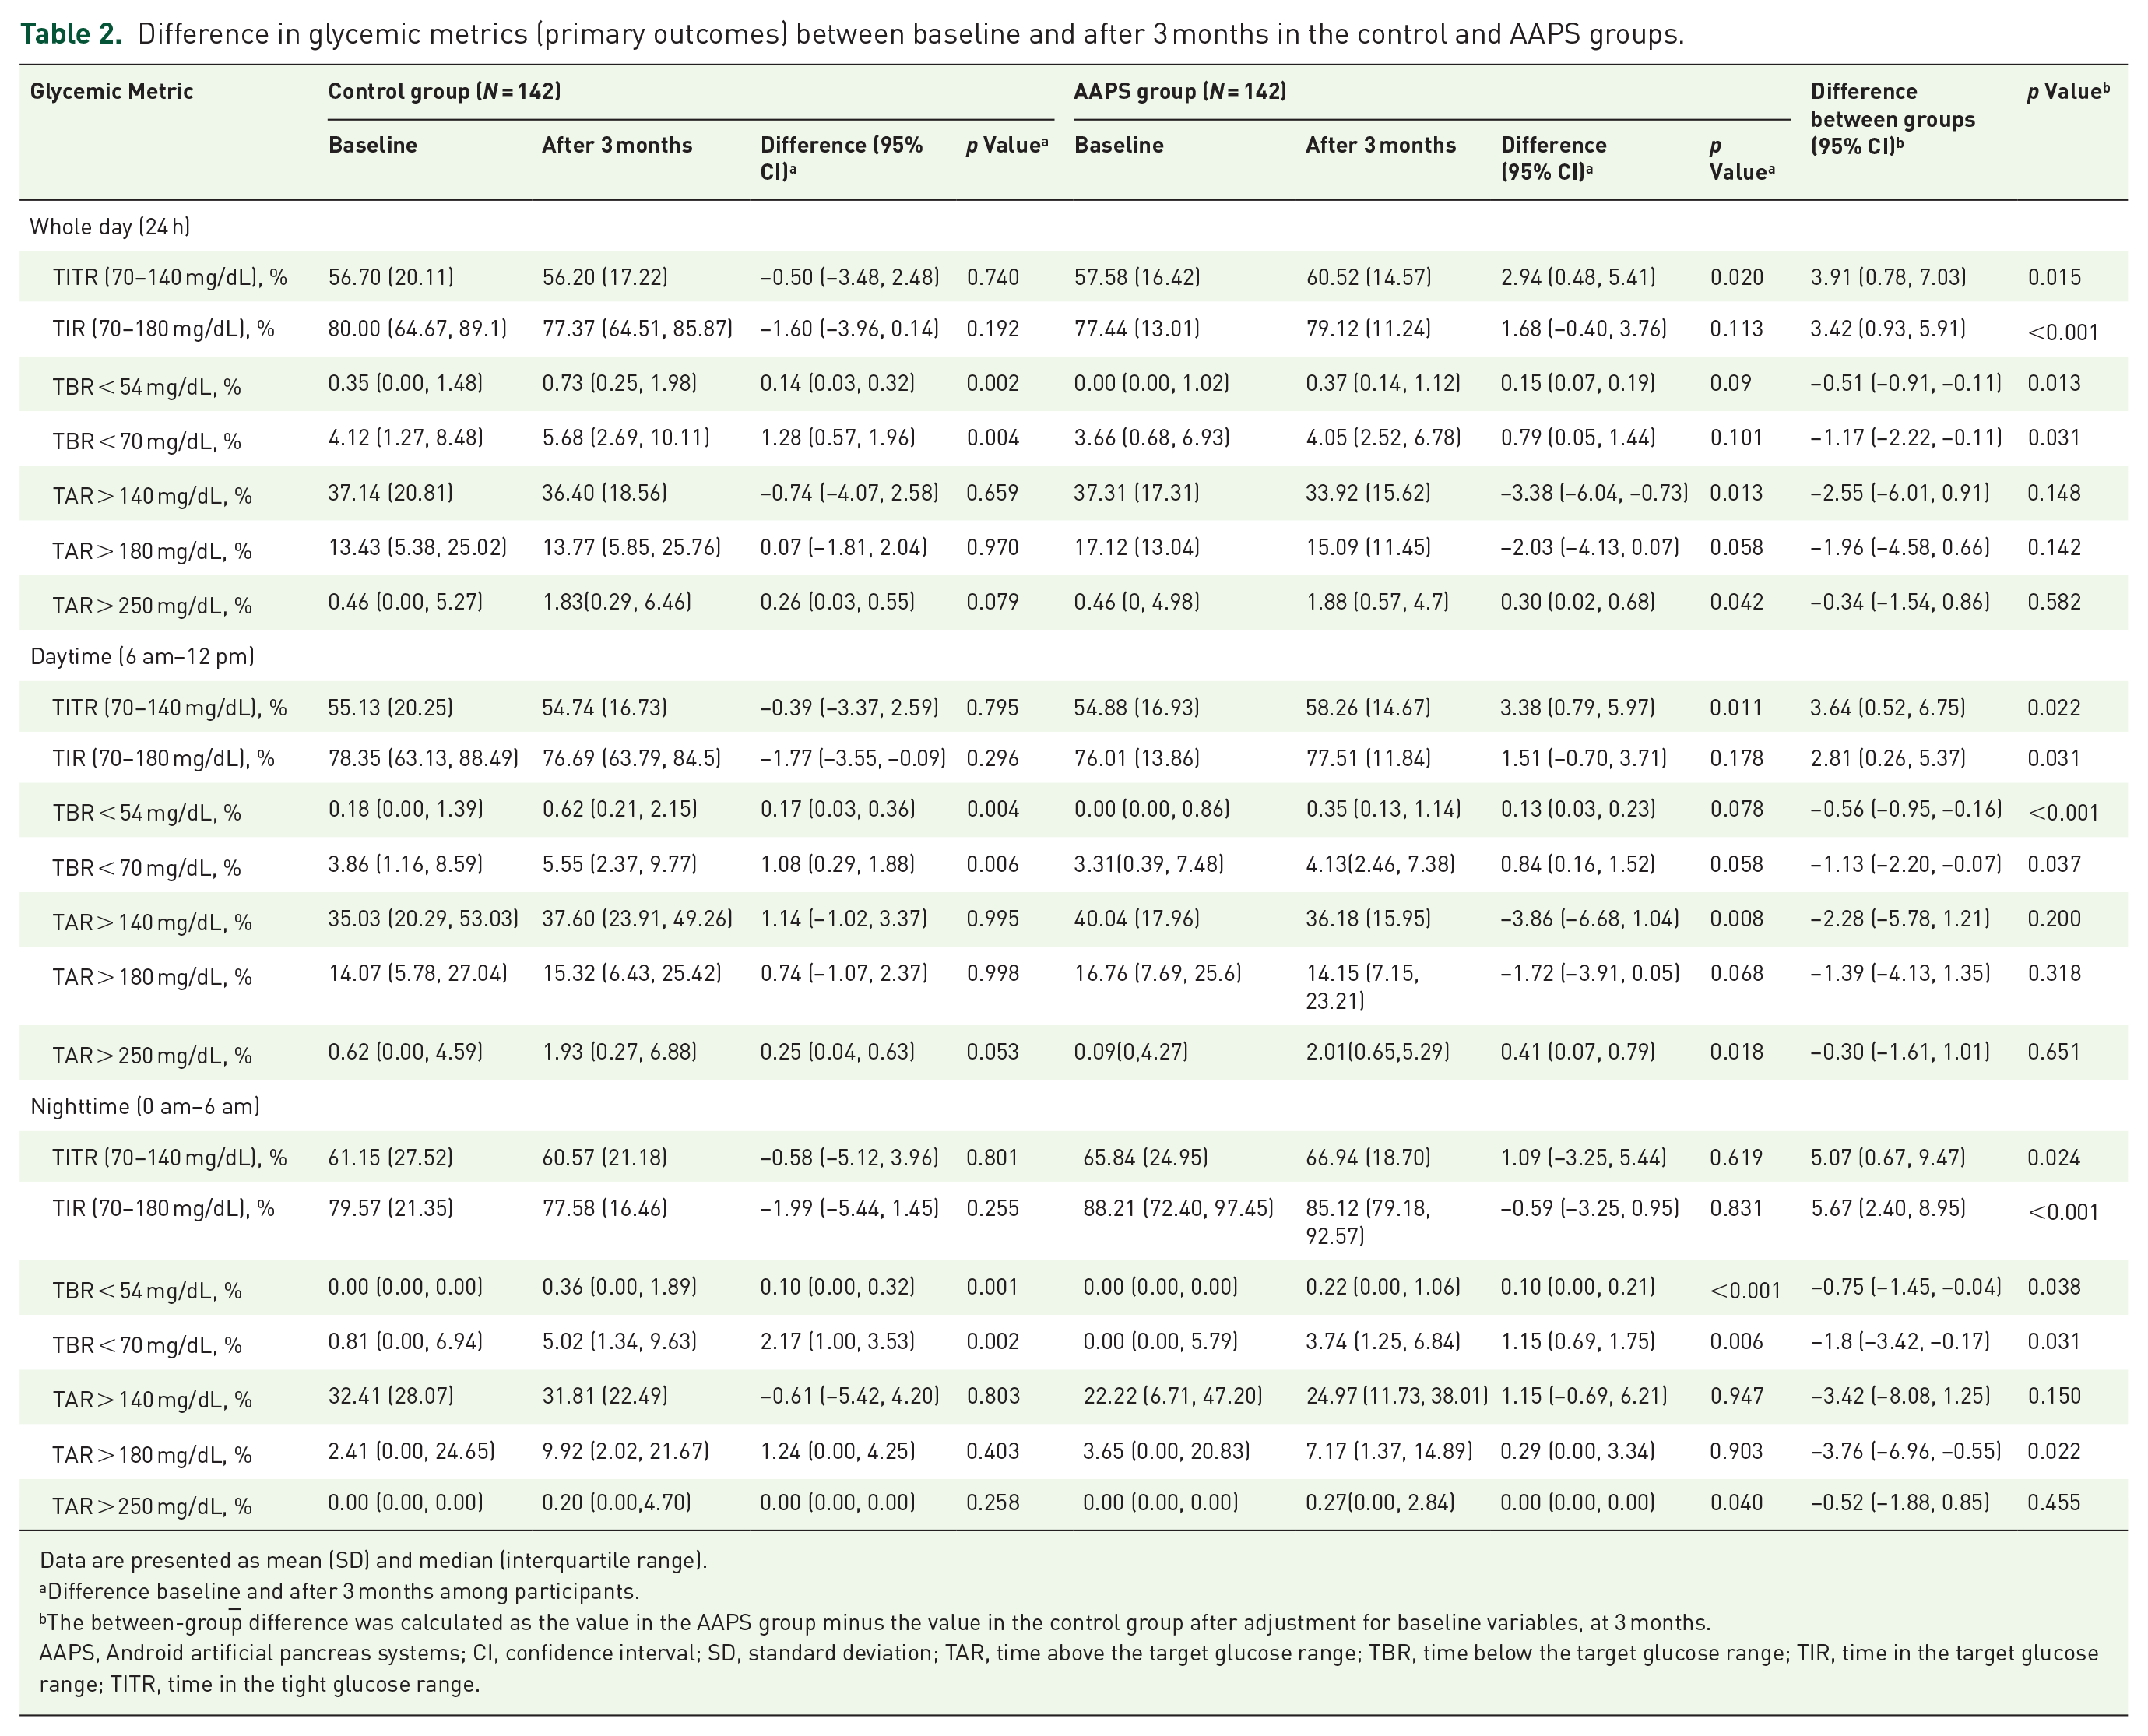
Data are presented as mean (SD) and median (interquartile range).
Difference baselin
The between-group difference was calculated as the value in the AAPS group minus the value in the control group after adjustment for baseline variables, at 3 months.
AAPS, Android artificial pancreas systems; CI, confidence interval; SD, standard deviation; TAR, time above the target glucose range; TBR, time below the target glucose range; TIR, time in the target glucose range; TITR, time in the tight glucose range.
Compared with baseline, we observed a significant improvement in glycemic control after 1 month of AAPS use (57.58% ± 16.42% vs 61.58% ± 13.97%, p < 0.05). However, when comparing glucose data from the first, second, and third months of AAPS use, we found no further significant improvement in glucose management after the first month. Specifically, TITR values were 61.58% ± 13.97%, 60.35% ± 14.33%, and 60.52% ± 14.57% (p > 0.05) for the first, second, and third months, respectively (Figure 1), with similar results observed during both daytime and nighttime periods (Figure 1). These results indicate that while blood glucose control improved significantly during the first month of AAPS use, it then plateaued, with no further significant improvement thereafter.
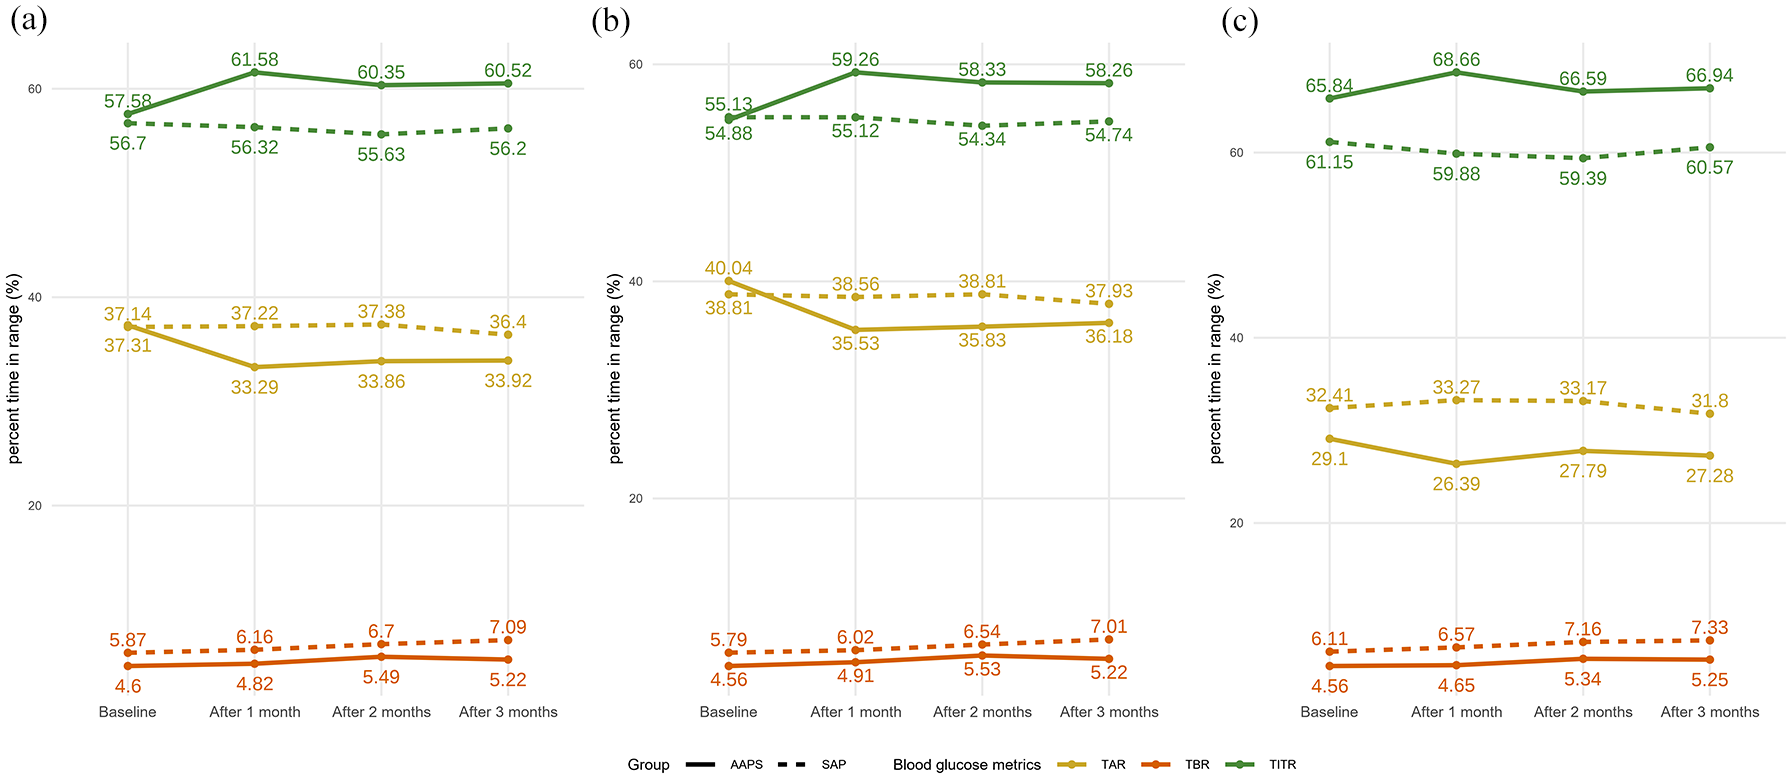
Comparison of changes in blood glucose metrics over time between the SAP and AAPS groups at different time points. (a) Comparison of whole-day blood glucose metric changes between SAP and AAPS groups. CGM metrics include TIR (green), TAR (yellow), and TBR (red). Solid lines represent the AAPS group and dashed lines represent the SAP group. (b) Comparison of daytime blood glucose metric changes between SAP and AAPS groups. The color coding matches panel (a) for easy cross-reference. Solid lines represent the AAPS group and dashed lines represent the SAP group. (c) Comparison of nighttime blood glucose metric changes between SAP and AAPS groups. The color coding matches panel (a) for easy cross-reference. Solid lines represent the AAPS group and dashed lines represent the SAP group.
The AAPS group demonstrated benefits in glucose management during both nighttime and daytime periods, with better glucose control observed at night compared with daytime. The nighttime TITR for the two groups was 66.94% ± 18.70% and 60.57% ± 21.18% (adjusted difference, 5.07%; p < 0.05), respectively, while the daytime TITR was 58.26% ± 14.67% and 54.74% ± 16.73% (adjusted difference, 3.64%; p < 0.05), respectively (Table 2), which are primarily attributed to a reduction in hyperglycemia, with no increased risk of hypoglycemia during the process.
To investigate the potential reasons why daytime blood glucose control is less significant than nighttime, we analyzed the impact of diet on daytime blood glucose control. We found that in non-meal times, the AAPS group showed significant improvement in TITR after 3 months (55.06% ± 17.24% vs 58.64% ± 14.77%, p < 0.05), whereas no such improvement was observed in the control group (55.25% ± 20.53% vs 54.81% ± 17.06%, p > 0.05). However, during meal times, no improvement in blood glucose was observed in either the AAPS or control groups after 3 months. The results for TIR are consistent with those for TITR, showing significant improvement in the AAPS group during non-meal times, but no significant changes during meal times (Supplemental Table S5). Furthermore, analysis of the temporal distribution of hypoglycemic events indicated that following AAPS intervention, episodes of hypoglycemia remained predominantly concentrated during mealtime periods, with no substantial alteration in their overall temporal pattern (Supplemental Figure S2). We hypothesize that the lack of capability of AAPS in coping with meal-related hyperglycemia limits the further improvement of glycemic control during daytime.
We conducted subgroup analyses based on age, gender, and baseline GMI, with the results summarized in Table 3. In the adult subgroup, after 3 months, the TITR in the AAPS group was significantly higher than in the control group (63.89% ± 13.29% vs 56.65% ± 18.75%; adjusted difference: 5.43%; p < 0.05), whereas no such significant difference was observed in the underage subgroup. In addition, among AAPS group participants, adults showed a greater improvement in TITR over the 3-month period than non-adults (4.61% vs 0.39%), indicating a more pronounced response to AAPS intervention in adults. While there was no significant gender difference in TITR between the AAPS and control groups, women in the AAPS group achieved a potentially greater improvement in blood glucose levels after 3 months compared to men (4.50% vs 0.88%), indicating an advantage for women in glycemic control. In the subgroup with baseline GMI < 7%, the TITR in the AAPS group was significantly higher than that in the control group after 3 months (62.68% ± 14.00% vs 59.38% ± 16.69%; adjusted difference: 4.33%; p < 0.05). In contrast, in the subgroup with baseline GMI > 7%, although both groups showed good improvement in blood glucose control, this was primarily due to the lower baseline blood glucose levels, which made the improvement more pronounced. This suggests that, compared with SAP therapy, AAPS may still be effective for patients with T1D with better baseline glycemic control.
Stratified analysis of the whole-day (24 h) TITR differences between the control and AAPS groups.

Data are presented as mean (SD) and median (interquartile range).
Difference baseline and after 3 months among participants.
The between-group difference was calculated as the value in the AAPS group minus the value in the control group after adjustment for baseline variables, at 3 months.
AAPS, Android artificial pancreas systems; CI, confidence interval; GMI, glucose management indicator; SD, standard deviation; TITR, time in the tight glucose range.
To assess the association between the use of AAPS and improvement in TITR and TIR >5% in participants with T1D, logistic regression analysis was performed (Table 4). After adjusting for age, duration of T1D, gender, and baseline GMI, AAPS use was associated with improvements in TITR (Model 2, odds ratio (OR) 1.73, 95% confidence interval (CI; 1.03, 2.92), p < 0.05). Similarly, after adjusting for age, gender, and baseline GMI, AAPS use was also significantly associated with improvements in TIR (Model 2, OR 2.22, 95% CI (1.22, 4.07), p < 0.05). Similarly, we observed a significant association between AAPS use and improvements in TITR and TIR during the daytime.
The association between the use of AAPS and improvement in TITR and TIR > 5% in participants with T1D.

Model 1: Unadjusted. Model 2: Adjusted by age, duration of T1D, gender, and baseline GMI.
AAPS, Android artificial pancreas systems; CI, confidence interval; GMI, glucose management indicator; OR, odds ratio; T1D, type 1 diabetes; TIR, time in the target glucose range; TITR, time in the tight glucose range.
Discussion
In this real-world case-control study, we found that AAPS is associated with better glycemic control in patients with T1D without increasing the risk of hypoglycemia compared with SAP therapy.
In this study, the effectiveness of AAPS therapy aligns with findings from previous studies on both commercial and DIYAPS. The CREATE (Community deRivEd AutomaTEd insulin delivery) trial, the first published study evaluating AAPS in children and adults with T1D, reported patients who were using the AAPS had 3 h 21 min more TIR per day than those who were receiving SAP therapy, a between-group difference of 14 percentage points while maintaining a low percentage of time during which the glucose level was less than 70 mg/dL. 18 A randomized crossover study demonstrated that, compared with the control, the AAPS increased TIR by 18.6% from baseline. 19 We observed that the difference in TIR between groups in our real-world study was less compared with other APS studies, which may be explained by two factors. One explanation could be that since the control group was matched to the AAPS group based on baseline TITR, this matching likely contributed to the observed similarity in glucose outcomes between the groups at later time points. In addition, compared with other studies, our patients had better glycemic control at baseline, with baseline TIR already reaching the recommended target defined by the 2021 ADA care standards (recommended > 70%). 27 This result is similar to a study from China, where participants using the Medtronic MiniMed 770G had a high baseline TIR (75.30%), resulting in a relatively smaller TIR increase during the study period, reaching 80.90%, a mean change of 5.60%. 28
Daytime blood glucose levels are higher than nighttime, consistent with other studies. By comparing CGM metrics during mealtime and non-mealtime periods, we speculate that the immediate response to food-induced blood glucose fluctuations still poses a challenge for APS in automatically adjusting insulin doses. This challenge arises due to delays in subcutaneous insulin absorption compared with dietary glucose absorption 29 the slow response of available insulin analogs, variability in insulin sensitivity in T1D, and high interpatient variability. 30 As a result, patients still need to manually administer preprandial insulin boluses to ensure optimal blood glucose control. Given that dietary carbohydrate (CHO) content plays a crucial role in affecting postprandial blood glucose levels in individuals, patients need to preannounce their meals and estimate their CHO intake before mealtime to determine the appropriate postprandial insulin dosage. 31 This process is complex and prone to significant errors, with an average misestimation of around 20% in adults. 32 To reduce manual intervention, the AAPS is evolving toward a fully closed-loop system and has incorporated features such as SMB and UAM. This gives AAPS an advantage in glycemic control compared with the LOOP (a type of open-source automated insulin delivery system). For instance, a study using a diabetic pig model compared blood glucose control between AAPS and LOOP without meal announcements, and the results showed that AAPS achieved a longer time within the target glucose range. 17 In addition, the “self-sensitivity” module of AAPS allows for dynamic adaptation to various physiological and lifestyle conditions. Studies have shown that women with T1D using AAPS can perceive and manage significant fluctuations in insulin requirements throughout the menstrual cycle. 33 Furthermore, the system has demonstrated the ability to maintain stable glycemic control during prolonged physical activity. 14
Our data indicate that adults benefit more from using AAPS compared with adolescents and children. This may be attributed to the additional physiological and behavioral challenges faced by younger individuals, such as fluctuating activity levels, developmental and hormonal changes, and irregular lifestyle patterns, all of which contribute to increased glycemic variability. 34 Moreover, as adolescents and children spend much of their time at school and may lack familiarity with the device, they often struggle to manage it ineffectively without parental assistance. While AAPS incorporates features such as SMB and UAM capabilities, its performance still relies on accurate meal announcements. Younger users are more prone to missing or forgetting meals compared with adults, which can impair system efficacy. 35 Previous studies have shown that the performance of APS deteriorates when meals are missed or unannounced, 36 and TIR among adolescents and children is significantly higher during holidays than on schooldays, highlighting the influence of behavioral and environmental factors. 37 These findings suggest that additional education and school-based support are needed to enhance AAPS effectiveness among adolescents and children’s users, particularly during school days.
Similar to previous studies,20,38 our research also observed that significant improvements in CGM metrics occurred within the first month of APS use. However, after this initial progress, no further substantial improvements were noted, indicating that APS may primarily serve to sustain the early benefits rather than drive continuous enhancement. This pattern suggests a potential plateau in glycemic outcomes. For patients with T1D, it is important to explore the underlying mechanisms behind this rapid initial improvement followed by stabilization. Whether a ceiling effect exists in glycemic control with APS remains an open question and has also been reported in studies of other APS.38,39 Currently, long-term longitudinal studies are needed to better characterize glycemic trends over time and to identify demographic, psychological, and environmental factors that may contribute to these patterns. 38
The strength of this study lies in its real-world case-control design, which utilizes PSM to compare the control group and the AAPS group, accurately demonstrating the glycemic control advantages of AAPS over SAP therapy in patients with T1D. The study’s limitations are as follows. First, this study utilized retrospective data, which cannot fully replace the evidence provided by randomized controlled trials. Moreover, due to the limitations inherent in its design, key information such as participants’ behavioral data (e.g., physical activity patterns, adherence, and device usage), dietary intake questionnaires, carbohydrate estimations, total daily insulin dose, and hypoglycemia-related scales was unavailable, restricting further analysis of factors influencing glycemic control; second, patient data was sourced from self-reports, which may raise concerns about accuracy and completeness, potentially affecting the reliability of the results; and third, the presence of selection bias, as the high cost of APS often results in including individuals with higher motivation, better blood glucose control, and better socioeconomic status.
Conclusion
In summary, this real-world case-control study demonstrated that the Android open-source APS shows significant improvements in glycemic control without increasing hypoglycemia, compared with SAP therapy.
Supplemental Material
sj-docx-1-tae-10.1177_20420188251350210 – Supplemental material for Effectiveness of open-source Android artificial pancreas systems for glucose management in patients with type 1 diabetes: a real-world study
Supplemental material, sj-docx-1-tae-10.1177_20420188251350210 for Effectiveness of open-source Android artificial pancreas systems for glucose management in patients with type 1 diabetes: a real-world study by Qin Wang, Xianming Li, Wenhao Zhang, Hao Wang, Jie Tang, Yu Ding, Xueying Zheng and Sihui Luo in Therapeutic Advances in Endocrinology and Metabolism
Footnotes
References
Supplementary Material
Please find the following supplemental material available below.
For Open Access articles published under a Creative Commons License, all supplemental material carries the same license as the article it is associated with.
For non-Open Access articles published, all supplemental material carries a non-exclusive license, and permission requests for re-use of supplemental material or any part of supplemental material shall be sent directly to the copyright owner as specified in the copyright notice associated with the article.