
Abstract
Background:
The pathophysiology of polycystic ovary syndrome (PCOS) is complex and heterogeneous. This systematic review and meta-analysis aimed to determine the triglyceride–glucose index and lipid ratios in women with and without PCOS.
Methods:
Literature searches were performed in PubMed, Scopus, Web of Science, Scielo, and Embase for studies reporting the triglyceride–glucose index and total cholesterol/high-density lipoprotein (HDL)-cholesterol, triglyceride/HDL-cholesterol, and low-density lipoprotein (LDL)-cholesterol/HDL-cholesterol ratios. Results are reported as standardized mean differences (SMDs) along with their 95% confidence intervals (CIs).
Results:
The search identified 61 observational studies, including case–control (n = 37), cohort (n = 2), and cross-sectional (n = 22) studies reporting results of interest according to different PCOS diagnosis criteria. Compared with the control group, the PCOS group presented increased circulating triglyceride–glucose index (n = 9 studies, SMD, 0.41; 95% CI, 0.08–0.74) and total cholesterol/HDL-cholesterol (n = 35 studies, SMD, 1.70; 95% CI, 0.69–2.70), triglyceride/HDL-cholesterol (n = 31 studies; SMD, 0.81; 95% CI, 0.43–1.19), and LDL-cholesterol/HDL-cholesterol (n = 25 studies, SMD, 2.40; 95% CI, 0.45–4.35) ratios. Statistical heterogeneity values were very high (I2 > 90%). The PCOS group displayed significantly higher body mass index and homeostatic model assessment of insulin resistance. The PCOS group was younger than the control group and had a higher total cholesterol/HDL-cholesterol ratio, and other lipid variables were comparable in all groups.
Conclusion:
Patients with PCOS show significantly higher triglyceride–glucose index and total cholesterol/HDL-cholesterol, triglyceride/HDL-cholesterol, and LDL-cholesterol/HDL-cholesterol ratios than those without the syndrome.
Keywords
Introduction
Polycystic ovary syndrome (PCOS) is a complex and heterogeneous endocrine multigenic and metabolic disorder that occurs in female patients from the intrauterine life and infancy, during reproductive years and postmenopausal period, and up to old age affecting multiple organs and systems.1–5 PCOS may manifest as hyperandrogenism, hyperinsulinism, dyslipidemia, metabolic syndrome, infertility, progressive liver dysfunction, and nonalcoholic fatty liver disease.4,6–9
Despite the discovery of some mechanisms involved in PCOS onset, its etiology and pathophysiology are still not fully understood.10,11 Although external factors may cause PCOS, insulin resistance is one of the most important internal factors. 10 The influence of insulin on adipose tissue and inflammation is crucial to the pathogenesis of PCOS, as insulin stimulates adipogenesis and lipogenesis and inhibits lipolysis, leading to fat accumulation.10,12,13 Insulin resistance results in a reduction in omentin levels, independent of the patient’s body mass index (BMI), and leads to higher plasma levels of free fatty acids, which affect the liver and adipose tissue. 10 In this regard, dyslipidemia is the most common metabolic disorder in patients with PCOS.10,12
In patients with PCOS, various metabolic pathways involve lipids, such as the biosynthesis of steroid hormones, sphingolipid metabolism, and fatty acid metabolism.12,14 Thus, some studies have shown that the levels of triglycerides and apolipoprotein B (Apo-B) are increased in correlation with the BMI in patients with PCOS.12,14 Furthermore, the atherogenic index of plasma and the triglyceride/high-density lipoprotein (HDL)-cholesterol ratio have been linked to specific PCOS characteristics such as insulin resistance and obesity. 11 Although the prevalence of obesity, abdominal fat distribution, dyslipidemia, and impaired glucose metabolism is higher in women with PCOS, the prevalence of cardiovascular disease is not high.10,14 Despite this prevalence, not all lipid profile elements or ratios created from these elements necessarily show higher levels in women with PCOS than in those without it.13,15 To the best of our knowledge, evidence of the differences between lipid ratios in women with or without PCOS has not been systematized. This is relevant because the varying lipid ratios could better reflect the metabolic interactions of lipid fractions and are cardiovascular risk markers.10,15–18 Therefore, through a systematic review and meta-analysis, this study aimed to synthesize the available evidence on the comparison of triglyceride–glucose index levels and relevant lipid ratios (total cholesterol/HDL-cholesterol, triglyceride/HDL-cholesterol, and low-density lipoprotein (LDL)-cholesterol/HDL-cholesterol) in women with and without PCOS.
Methods
Protocol registration, data sources, eligibility criteria, and data extractions
The Preferred Reporting Items for Systematic Reviews and Meta-Analysis Guidelines (PRISMA) were employed for the conception and reporting of this systematic review and meta-analysis (see the PRISMA checklist in Table S1). 19 An abbreviated version of the protocol was uploaded to the International Prospective Register of Systematic Reviews under the code CRD42024553484.
The literature search was carried out in PubMed, Scopus, Web of Science, Scielo, and Embase. In addition, a hand search was conducted based on the reference lists of the identified articles. Medical subject headings terms and free-text terms were used in the search strategy. No restrictions on the date or language were set. The complete search strategies are presented in Table S2. The systematic search was simultaneously run in all databases on November 26, 2024.
We included case–control, cohort, and cross-sectional studies that reported the triglyceride–glucose index and the total cholesterol/HDL-cholesterol, triglyceride/HDL-cholesterol, LDL-cholesterol/HDL-cholesterol ratios in women with (PCOS group) and without PCOS (control group). In addition, we excluded studies that were (1) conducted in animals, (2) conference abstracts, (3) duplicated, (4) case reports, (5) systematic reviews, and (6) scoping reviews. PCOS was defined according to the respective articles included in the meta-analysis and based on international recommendations.
The articles collected from various databases were imported into the data management software Rayyan Qatar Computing Research Institute, 20 and duplicate publications were removed. Four reviewers independently assessed the title and abstract of each study and compared them according to the selection criteria. The full text of the studies that passed this phase were evaluated by the same four reviewers. During the full-text screening phase, the Fleiss’ kappa coefficient (Fleiss κ) was applied to determine the level of agreement among the authors who reviewed the articles.21,22 Discrepancies in the inclusion or exclusion criteria for every article were resolved through consensus. The four reviewers independently extracted information from each included article. In the case of missing information, the authors of the corresponding articles were contacted. The following data were extracted: first author, publication date, study location, sample size, age, PCOS diagnostic criteria, triglyceride–glucose index, and selected lipid ratios in the PCOS and control groups. Meta-analyses were planned for the triglyceride–glucose index and the analyzed lipid ratios by comparing the PCOS and control groups. Other clinical parameters (age, BMI, and homeostatic model assessment of insulin resistance (HOMA-IR)) traditionally related to PCOS were studied as secondary outcomes in separate meta-analyses if reported in at least three publications for the respective main outcomes.
Risk of bias and publication bias
The risk of bias was independently assessed by two reviewers using the Newcastle–Ottawa scale (NOS) for cohorts and case–control studies. An adjusted version of the NOS was used for cross-sectional studies (NOS-C). 23 A rating of ⩾7 stars indicated a low risk of bias, whereas <7 stars meant a high risk of bias. 24 Publication bias was evaluated using funnel plots, the Egger test, and, if needed, the trim-and-fill method. 25
Data synthesis, meta-analyses, and subanalyses
The method by Hozo et al. 26 was employed to convert the medians and their interquartile ranges into means along with their corresponding standard deviations (SDs). For variables with standard errors (SE) reported, SD was determined using the following equation: SE × √(sample size). 27
Statistical analyses were conducted using STATA 17.0 (Stata Corporation, College Station, TX, USA). Mean differences (MDs) or standardized mean differences (SMDs) with their corresponding 95% confidence intervals (CIs) were used for the meta-analysis. Random-effect meta-analyses were performed using the Sidik–Jonkman method and 95% of CIs were corrected using the truncated Knapp–Hartung SE.28,29 Between-study heterogeneity was assessed using the I2 statistic (with their respective 95% CI), tau-squared (tau2) statistics, and Cochran’s Q test. High heterogeneity was defined as an I2 value >70% or a p-value <0.05 for the Cochran’s Q test. Subgroup analyses were planned based on the study design, world regions, menopausal status, insulin resistance, and hyperandrogenism if sufficient information is available. Sensitivity analyses were performed excluding studies with a high risk of bias and studies with MD/SMD >1.00.
Results
Selection of studies and clinical characteristics
The database searches yielded 1298 articles. After removing duplicates, the title and abstracts for 826 articles were screened. Finally, full-text screening (Fleiss κ = 0.561; moderate agreement) identified 61 articles that met all the eligibility criteria for this systematic review and meta-analysis.30–90 The flowchart of the selection process and observational studies are shown in Figure 1.

PRISMA flow diagram.
In total, 37 case–control, 22 cross-sectional, and 2 cohort studies, including a total of 14,402 women (PCOS group, n = 6230; control group, n = 8172), were identified. The countries that contributed the most to this review were India (12 studies) and Turkey (10 studies). PCOS was diagnosed according to the Rotterdam criteria (54 studies), 91 the United States National Institutes of Health (4 studies), 92 and Androgen Excess and Polycystic Ovary Syndrome Society criteria (2 studies), 93 and one study did not report the diagnostic criteria. The characteristics of all included studies are summarized in Table 1.
Characteristics of the included studies in women with and without PCOS, reporting triglyceride–glucose index, triglyceride/HDL-cholesterol, LDL-cholesterol/HDL-cholesterol, and total cholesterol/HDL-cholesterol ratios.

HDL, high-density lipoprotein; IQR, interquartile range; LDL, low-density lipoprotein; NIH, National Institutes of Health; PCOS, polycystic ovary syndrome; TC, total cholesterol; TG, triglyceride.
Quality assessment and publication bias
Thirty-one studies demonstrated a low risk of bias, whereas 30 had a high risk of bias (Table S3). Publication biases were found when evaluating the difference in the total cholesterol/HDL-cholesterol, triglyceride/HDL-cholesterol, and LDL-cholesterol/HDL-cholesterol ratios in the PCOS and control groups (Egger’s test, p < 0.10, and asymmetry was found in the funnel plots), which were corrected with the trim-and-fill method for the ratios of total cholesterol/HDL-cholesterol (SMD, 2.18; 95% CI, 1.36–3.00; Figure S1), triglyceride/HDL-cholesterol (SMD, 1.13; 95% CI, 0.80–1.45; Figure S2), and LDL-cholesterol/HDL-cholesterol (SMD, 3.43; 95% CI, 1.9–4.96; Figure S3). No publication bias was found when evaluating the difference in the triglyceride–glucose index (Egger’s test, p > 0.10).
Meta-analyses
Nine studies (n = 5367) evaluated the triglyceride–glucose index, which was higher in the PCOS group than in the control group (SMD, 0.41; 95% CI, 0.08–0.74; p < 0.05, tau2 = 0.16, I2 = 91.58%; I2 95% CI, 69.89%–96.26%; Figure 2(a)). In this population (n = 5 studies, n = 3941 women), no significant differences in age were found between the PCOS and control groups (MD, 0.36; 95% CI, −0.96 to 1.69; Figure 2(b)). In eight studies (n = 5243), the BMI was significantly higher in the PCOS group than in the control group (MD, 3.88; 95% CI, 0.89–6.87; Figure 2(c)). In six studies (n = 4984), the HOMA-IR was significantly higher in the PCOS group than in the control group (MD, 1.92; 95% CI, 0.29–3.55; Figure 2(d)).

Forest plots in participants with and without polycystic ovary syndrome assessing (a) triglyceride–glucose index, (b) age, (c) body mass index, and (d) HOMA-IR.
Thirty-five studies (n = 4440) reported higher total cholesterol/HDL-cholesterol ratios in the PCOS group than in the control group (SMD, 1.70; 95% CI, 0.69–2.70; p < 0.001, tau2 = 8.50, I2 = 99.48%; I2 95% CI, 94.47%–99.91%; Figure 3(a)). In this population (28 studies, n = 3544), the PCOS group was younger than the control group (MD, −1.33; 95% CI, −2.57 to −0.09; Figure 3(b)). In 31 studies (n = 4061), BMI was also significantly higher in the PCOS group than in the control group (MD, 2.78; 95% CI, 1.74–3.82; Figure 3(c)). In 18 studies (n = 2256), the HOMA-IR was significantly higher in the PCOS group than in the control group (MD, 1.67; 95% CI, 0.97–2.36; Figure 3(d)).

Forest plots in participants with and without polycystic ovary syndrome assessing (a) total cholesterol/HDL-cholesterol ratio, (b) age, (c) body mass index, and (d) HOMA-IR.
Thirty-one studies (n = 5983) evaluated the triglyceride/HDL-cholesterol ratio, which was higher in the PCOS group than in the control group (SMD, 0.81; 95% CI, 0.43–1.19; p < 0.001, tau2 = 1.03, I2 = 97.66%; I2 95% CI, 92.51%–99.05%; Figure 4(a)). In 23 studies (n = 4345), no significant differences in age were found in the PCOS and control groups (MD, −0.74; 95% CI, −1.90 to 0.41; Figure 4(b)). In 29 studies (n = 5675), BMI was significantly higher in the PCOS group (MD, 2.69; 95% CI, 1.23–4.15; Figure 4(c)). In 21 studies (n = 4636), the HOMA-IR was significantly higher in the PCOS group than in the control group (MD, 1.89; 95% CI, 1.27–2.52; Figure 4(d)).

Forest plots in participants with and without polycystic ovary syndrome assessing (a) triglyceride/HDL-cholesterol ratio, (b) age, (c) body mass index, and (d) HOMA-IR.
Twenty-five studies (n = 3440 women) evaluated the LDL-cholesterol/HDL-cholesterol ratio, which was higher in the PCOS group than in the control group (SMD, 2.40; 95% CI, 0.45–4.35; p < 0.05, tau2 = 22.21, I2 = 99.78%; I2 95% CI, 96.26%–99.99%; Figure 5(a)). In this population (19 studies, n = 2907), no significant differences in age were found between the PCOS and control groups (MD, −0.54; 95% CI, −1.67 to 0.60; Figure 5(b)). In 21 studies (n = 3061), BMI was significantly increased in the PCOS group (MD, 2.59; 95% CI, 1.40–3.77; Figure 5(c)). In 15 studies (n = 2237), HOMA-IR was significantly increased in the PCOS group (MD, 1.78; 95% CI, 1.00–2.56; Figure 5(d)).
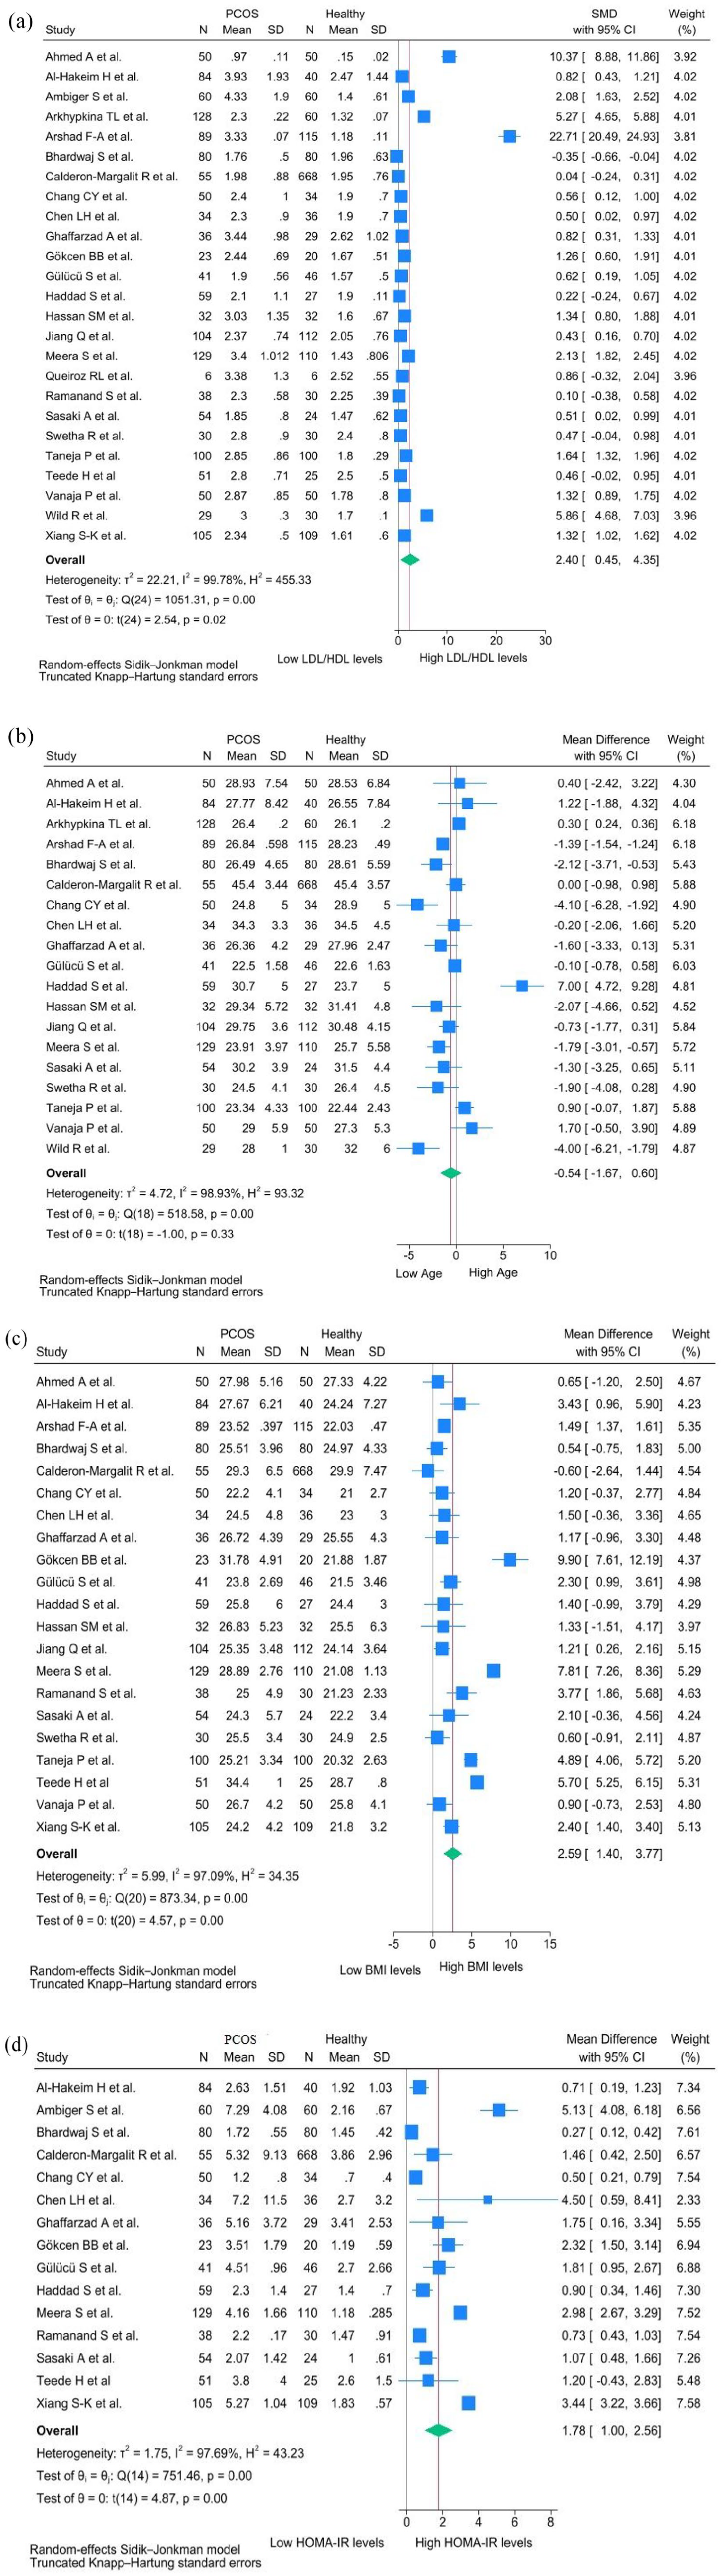
Forest plots in participants with and without polycystic ovary syndrome assessing (a) LDL-cholesterol/HDL-cholesterol ratio, (b) age, (c) body mass index, and (d) HOMA-IR.
Subgroup and sensitivity analyses
The triglyceride–glucose index subgroup analyses (Figure S4) by world regions and study designs did not reveal significant differences, except for cross-sectional studies and those conducted in Asia. In the sensitivity analysis including only studies with a low risk of bias (Figure S5(A)), no significant difference was found in the triglyceride–glucose index between the PCOS and control groups (SMD, 0.25; 95% CI, −0.16 to 0.65; p = 0.18), showing high heterogeneity (tau2 = 0.13, I2 = 91.41%; I2 95% CI, 74.32%–99.97%). In the sensitivity analysis where only studies with SMD <1.00 were included (Figure S5(B)), the PCOS group exhibited a higher triglyceride–glucose index than the control group (SMD, 0.33; 95% CI, 0.02–0.64; p < 0.05) displaying high heterogeneity (tau2 = 0.12, I2 = 89.23%; I2 95% CI, 69.7%–97.87%).
In the subgroup analyses (Figure S6) by world regions and study designs, differences in the total cholesterol/HDL-cholesterol ratio displayed high heterogeneity, and no significant differences were found only in studies conducted in the USA. In the sensitivity analysis including only studies with a low risk of bias (Figure S7(A)), the PCOS group had higher total cholesterol/HDL-cholesterol ratio than the control group (SMD, 1.40; 95% CI, 0.53–2.27; p < 0.001), showing high heterogeneity (tau2 = 2.22, I2 = 98.63%; I2 95% CI, 95.04%–99.89%). In the sensitivity analysis of studies with SMD <1.00 (Figure S7(B)), the PCOS group had a high total cholesterol/HDL-cholesterol ratio (SMD, 0.54; 95% CI, 0.40–0.68; p < 0.05), presenting low heterogeneity (tau2 = 0.05, I2 = 55.18%; I2 95% CI, 14.67%–74.79%).
In the subgroup analyses (Figure S8) by world regions and study designs, differences in the triglyceride/HDL-cholesterol ratio displayed high heterogeneity, and no significant differences were found in studies conducted in the USA. In the sensitivity analysis including only studies with a low risk of bias (Figure S9(A)), the PCOS group had consistently higher triglyceride/HDL-cholesterol ratio than the control group (SMD, 0.85; 95% CI, 0.17–1.54; p < 0.001), presenting high heterogeneity (tau2 = 1.63, I2 = 98.97%; I2 95% CI, 94.69%–99.45%). In the sensitivity analysis of only studies with SMD <1.00 (Figure S9(B)), the PCOS group had a higher triglyceride/HDL-cholesterol ratio than the control group (SMD, 0.36; 95% CI, 0.24–0.48; p < 0.05), showing low heterogeneity (tau2 = 0.05, I2 = 66.89%; I2 95% CI, 38.89%–78.94%).
The LDL-cholesterol/HDL-cholesterol ratio subgroup analyses (Figure S10) by world regions and study designs did not reveal significant differences, except for case–control studies (SMD, 2.55; 95% CI, 0.09–5.00; p < 0.001). In the sensitivity analysis including only studies with a low risk of bias (Figure S11(A)), no significant difference in the LDL-cholesterol/HDL-cholesterol ratio was found in the PCOS and control groups (SMD, 4.94; 95% CI, −1.61 to 11.49; p = 0.12), presenting with high heterogeneity (tau2 = 61.0, I2 = 99.94%; 95% CI, 97.83%–99.99%). In the sensitivity analysis where only studies with SMD <1.00 were included (Figure S11(B)), the PCOS group had a higher LDL-cholesterol/HDL-cholesterol ratio than the control group (SMD, 0.39; 95% CI: 0.18–0.59; p < 0.001), with low heterogeneity (tau2 = 0.08, I2 = 63.42%; 95% CI, 42.58%–87.14%).
No other analyses were feasible because of the lack of specific information in the available literature.
Discussion
This study primarily showed that the triglyceride–glucose index and total cholesterol/HDL-cholesterol, triglyceride/HDL-cholesterol, and LDL-cholesterol/HDL-cholesterol ratios were higher in the PCOS group than in the control group.
To improve the prediction of cardiovascular disease, several lipoprotein ratios have been defined. 17 These ratios can provide information about risk factors that are difficult to quantify through classic systematic analyses and evidence supports their utility as cardiovascular risk markers. 94 In this way, various systematic reviews have demonstrated the predictive value of the triglyceride–glucose index,95,96 LDL-cholesterol/HDL-cholesterol,97,98 and triglyceride/HDL-cholesterol ratios. 99 These lipid ratios have also been evaluated in patients with PCOS showing, for example, that the triglyceride–glucose index is positively and independently correlated with the prevalence of metabolic syndrome, possibly because it is a good indicator of insulin resistance, as are triglyceride/HDL-cholesterol and total cholesterol/HDL-cholesterol ratio.87,100 This is relevant because insulin resistance is a fundamental component of PCOS pathophysiology and explains why up to 70% of women diagnosed with PCOS have dyslipidemia 101 and compared with patients without PCOS, the values of lipid ratios are higher, as our results show. Thus, lipid ratios have been considered practical methods for detecting insulin resistance in other studies.51,102
Insulin resistance is the central factor that explains lipid abnormalities in patients with PCOS, as it stimulates lipolysis and alters the expression of lipoprotein and hepatic lipases. Insulin suppresses very LDL (VLDL) production by reducing free fatty acids and could directly suppress VLDL production. 103 Therefore, insulin resistance stimulates the activity of microsomal triglyceride transfer protein and enhances VLDL assembly. 103 In this sense, many women with PCOS exhibit characteristics consistent with metabolic syndrome, including high levels of triglycerides, total cholesterol, and LDL-cholesterol and decreased levels of HDL-cholesterol, as it is also involved in the pathophysiology of this other syndrome. 104
Despite this, not all studies have shown that patients with PCOS have an altered lipid profile. A study showed that although the PCOS group had higher triglyceride levels than the control group, blood lipoprotein levels assessed in the PCOS and healthy control groups were within the normal range. 105 However, because lipoprotein ratios may better reflect the clinical interactions of lipid fractions, evidence of the variations in their levels is clinically important. 17 To the best of our knowledge, only one systematic review evaluated this possibility, although only for lipoprotein (a). 94 This systematic review of 23 observational studies that included 2337 patients showed that the PCOS group had higher levels of lipoprotein (a) than the control group, with similar results based on BMI. 94
Therefore, considering that lipid ratios may be better predictors of insulin resistance than their individual components and that insulin resistance is a key component of PCOS, 106 our results confirm that, probably due to insulin resistance-related mechanisms, 9 lipid ratios were higher in the PCOS group than in the control group. This aligns with other markers showing high levels associated with adipose tissue in patients with PCOS. One example is visfatin, a protein cytokine highly expressed in adipose tissue and closely linked to glucose and lipid metabolism. 107 Thus, visfatin levels are positively correlated with HDL, and negatively correlated with HOMA-IR, Apo-B, cholesterol, LDL, and total cholesterol/HDL-cholesterol ratio. 107 Similarly, high levels of androgens have found to be closely related to insulin resistance, which impacts glucose and lipid metabolism have been found. Likewise, elevated levels of chemerin have been observed, a marker associated with insulin resistance in obese adults affecting adipose tissue and glucose metabolism in PCOS women. 108 In summary, insulin resistance increases the level of individual lipid components, thereby elevating lipid ratios.
This has significant clinical implications, as evidence shows that these ratios have value as predictors of cardiovascular events in the general population.95,97,109 Given their elevated values in patients with PCOS, it is likely they can also predict these events in this population, and this finding needs to be confirmed in future studies. 110 Similarly, considering that lipid ratios also predict metabolic syndrome in women with PCOS 63 and the presence of metabolic syndrome can further increase an existing cardiometabolic risk, evidence-based guidelines recommend its detection. Therefore, elevated levels of lipid ratios also have a clinical utility for this purpose. 111
One aspect to consider in the interpretation of our results is the high heterogeneity (I2 > 90%), probably related to the different phenotypes and PCOS severity and the different diagnostic criteria of the studies included in the meta-analysis. Nevertheless, the analyzed evidence was obtained from women of similar age, except for one outcome, where the PCOS group was younger than the control group.
Limitations and strengths
This systematic review has some limitations. First, high heterogeneity is the most significant limitation, as it suggests that the included studies may have clinical and methodological differences. This makes it challenging to draw firm conclusions and may restrict the applicability of the results to specific populations. Second, the high risk of bias in some studies can affect the reliability of the meta-analysis results. Third, publication bias suggests that studies with non-significant or unfavorable results may be underreported, leading to an overestimation of the differences between women with and without PCOS. However, in this case, the publication bias could be corrected by the trim-and-fill method. Fourth, limited subgroup and sensitivity analyses restrict the understanding of potential effect modifiers and the robustness of the results. Comorbidities, sociodemographic lifestyles, and other variables should be considered in future studies to avoid confounding bias. Fifth, the inclusion of several cross-sectional studies restricts our findings to associations rather than causal relationships. Nevertheless, this limitation continues to impede the understanding of the temporal association between PCOS and the studied outcomes. Future searches should prioritize evaluating the sensitivity, specificity, and optimal cut-off point of these markers to estimate the risk of developing PCOS.
The strength of this systematic review and meta-analysis included the exhaustive search of available evidence and the statistical approach based on the random-effect Sidik–Jonkman model and truncated Knapp–Hartung SE that provide more adequate error rates than the DerSimonian–Laird method for the evaluation of chronic medical conditions when statistical heterogeneity is substantial.112,113 To the best of our knowledge, this systematic review and meta-analysis presents the first comprehensive synthesis of existing studies examining these markers in patients with PCOS.
Conclusion
Patients with PCOS show significantly higher triglyceride–glucose index and total cholesterol/HDL-cholesterol, triglyceride/HDL-cholesterol, and LDL-cholesterol/HDL-cholesterol ratios than women without the syndrome. These new markers may allow for easy and practical monitoring of patients with PCOS; however, the limitations, particularly the high heterogeneity and risk of bias, should be considered when interpreting the results and applying them to clinical practice. Future research should focus on high-quality studies with comprehensive information to better elucidate the relationship between PCOS and these metabolic markers.
Supplemental Material
sj-docx-1-tae-10.1177_20420188251328840 – Supplemental material for Triglyceride–glucose index and lipid ratios in women with and without polycystic ovary syndrome: a systematic review and meta-analysis
Supplemental material, sj-docx-1-tae-10.1177_20420188251328840 for Triglyceride–glucose index and lipid ratios in women with and without polycystic ovary syndrome: a systematic review and meta-analysis by Juan R. Ulloque-Badaracco, Esteban A. Alarcon-Braga, Enrique A. Hernandez-Bustamante, Juan C. Cabrera-Guzmán, Giuseppe Dotto-Vasquez, Gian F. Maldonado-Basurto, Germán Rivera-Cabrera, Sherelym H. Maita-Arauco, Andres A. Horruitiner-Mendoza, Percy Herrera-Añazco, Vicente A. Benites-Zapata and Faustino R. Pérez-López in Therapeutic Advances in Endocrinology and Metabolism
Footnotes
References
Supplementary Material
Please find the following supplemental material available below.
For Open Access articles published under a Creative Commons License, all supplemental material carries the same license as the article it is associated with.
For non-Open Access articles published, all supplemental material carries a non-exclusive license, and permission requests for re-use of supplemental material or any part of supplemental material shall be sent directly to the copyright owner as specified in the copyright notice associated with the article.