
Abstract
Objective
Previous studies have reported inconsistent findings regarding alterations in lipid profiles among patients with acne vulgaris (acne). This meta-analysis aimed to resolve these inconsistencies.
Methods
A systematic search was conducted in Web of Science, Scopus, and PubMed. Lipid profile levels were compared between patients with acne and healthy controls. Mean values and standard deviations for total cholesterol, triglycerides, low-density lipoprotein, and high-density lipoprotein were used to calculate standardized mean differences with 95% confidence intervals.
Results
A total of 916 articles were initially identified, of which 38 studies comprising 2485 patients met the eligibility criteria. The pooled analysis demonstrated that patients with acne had significantly higher levels of total cholesterol (pooled standardized mean difference = 0.92, 95% confidence interval: 0.55–1.28), triglycerides (pooled standardized mean difference = 0.82, 95% confidence interval: 0.51–1.14), and low-density lipoprotein (pooled standardized mean difference = 1.52, 95% confidence interval: 1.11–1.92) as well as significantly lower high-density lipoprotein levels (pooled standardized mean difference = −0.45, 95% confidence interval: −0.69 to −0.21). Subgroup and meta-regression analyses were performed to identify the sources of significant heterogeneity. Subgroup analyses further revealed significant alterations in lipid profiles among female patients and in studies conducted in Egypt and Saudi Arabia.
Conclusion
Alterations in lipid profiles were observed in patients with acne.
Keywords
Introduction
Acne is the most common skin disease resulting from a dysfunctional pilosebaceous unit and can affect people of any age. Although a higher prevalence rate (28.3%) is noted among early adults (aged 16–24 years), it is not uncommon in the age group of 25–39 years, with a prevalence rate of 19.3%. Moreover, all races and ethnicities are affected, and the worldwide prevalence is 20.5%.1,2 The pilosebaceous unit is formed by hair shafts, hair follicles, and sebaceous glands. This unit is most abundant on the face, upper back, and upper chest. As a result, acne is seen predominantly in these areas. 3 Multiple components play a role in the development of acne. The four main factors are excessive sebum production, follicular hyperkeratinization, bacterial colonization specifically by Cutibacterium acnes, and inflammation. 4 Sebaceous gland activity is increased during puberty and adrenarche, which is triggered by excessive androgen hormone resulting in overproduction of sebum. Androgen hormone is significantly enhanced in the peripheral circulation during puberty. 5 Excessive sebum facilitates the colonization of C. acnes.6–8 The bacteria elicit dermal inflammation by secreting lipase enzyme. Lipases hydrolyze sebum triglycerides (TG) and produce glycerol and fatty acids, which provoke dermal inflammation.9,10 Acne lesions can be both noninflammatory (comedones) and inflammatory (papules, pustules, and nodules). 11 Pilosebaceous follicles are occluded by sebum and dead skin cells, leading to the formation of comedones. Comedones may be open (partially blocked) or closed (completely blocked). 12 Acne may lead to the development of scarring and pigmentary changes. 13 It has both psychosocial and physiological effects, contributing to mental strain, permanent scarring, and skin deformities. 14 Furthermore, dyslipidemia was noted in acne patients in several studies, noting elevated levels of total cholesterol (TC),15–18 TG,19–21 and low-density lipoprotein (LDL)22–24 and reduced levels of high-density lipoprotein (HDL).25–27 However alterations in lipid profiles in acne patients were not observed in various studies.28–33 These conflicting results need to be resolved by a meta-analysis.
The mechanism underlying the altered blood lipid profile in acne is not well understood. It has been suggested that plasma cholesterol may play a significant role, as androgens are synthesized from cholesterol. 21 Studies have found that when plasma cholesterol levels are elevated, androgen levels are simultaneously increased. 17 Genetic factors also contribute to acne pathogenesis; for example, polymorphisms in the resistin (RETN-420) and interleukin-6-572 (IL6-572) genes have been linked to acne. These variants are also associated with metabolic disorders. Signaling molecules such as mechanistic target of rapamycin complex 1 (mTORC1) and insulin-like growth factor 1 (IGF-1) are implicated in acne pathogenesis. mTORC1 accelerates lipid synthesis via sterol regulatory element-binding protein 1 (SREBP1) activation, while IGF-1 modulates the growth of the sebaceous gland. 34 In addition, lipid levels may be altered by some systemic medications used for acne management. 35 In systemic therapy, drugs are administered through oral, injectable, or infusion routes. 36 Oral antibiotics, hormonal therapies (e.g. oral corticosteroids, spironolactone, cyproterone acetate, and oral contraceptives), and isotretinoin are the most commonly used systemic drugs for acne management.37,38 However, several studies have reported that isotretinoin alters lipid profiles in acne patients.35,39–41 The aim of this meta-analysis was to explore alterations in blood lipid profile levels, including TC, TG, LDL, and HDL, in acne patients compared with those in healthy controls.
Methods
The study followed the Preferred Reporting Items for Systematic Reviews and Meta-Analyses (PRISMA) guidelines and was registered in PROSPERO (registration number CRD42024608329). Searches were conducted in Web of Science, Scopus, and PubMed databases up to 15 November 2024. An updated search was performed on 9 July 2025 to identify newly published studies. The following keywords were used in PubMed and Web of Science: (((lipid AND profile) OR (lipid AND level) OR (triglycerides) OR (total AND cholesterol) OR (high-density AND lipoprotein AND cholesterol) OR (hdl-c) OR (low-density AND lipoprotein AND cholesterol) OR (ldl-c)) AND ((blood) OR (serum) OR (plasma)) AND ((acne) OR (acne AND vulgaris))). In Scopus, the following keywords were applied: ((‘lipid AND profile’ OR ‘lipid AND level’ OR ‘triglycerides’ OR ‘total AND cholesterol’ OR ‘high-density AND lipoprotein AND cholesterol’ OR ‘hdl-c’ OR ‘low-density AND lipoprotein AND cholesterol’ OR ‘ldl-c’) AND (‘blood’ OR ‘serum’ OR ‘plasma’) AND (‘acne’ OR ‘acne AND vulgaris’)).
Inclusion and exclusion criteria
Studies were included in the final analysis based on the following criteria:
The study was original research conducted on human participants. The study included two groups: patients with acne and healthy controls, with both groups free from other systemic diseases. The study reported at least one of the following lipid measures: TC, TG, LDL, or HDL. Lipid levels were measured using blood samples. Lipid profiles were presented as mean ±standard deviations (SD) or provided sufficient data to calculate the mean and SD. The study clearly reported participants’ drug history. Included studies indicated that patients were not receiving systemic therapy, were not using oral retinoids (isotretinoin), or were not taking lipid-altering medications. Studies that did not report drug history, did not indicate oral retinoid use, or included patients undergoing oral isotretinoin treatment were excluded. Review articles, conference papers, animal studies, in vitro studies, non-English publications, theses, and dissertations were excluded. Studies on infantile acne or those without a healthy control group were also excluded.
Data extraction and quality assessments
The following information was extracted from the included studies: first author, publication year, study location, number of participants, mean age of patients and controls, sex distribution, body mass index (BMI), drug history, and the mean ± SD of TC, TG, LDL, and HDL levels for both acne patients and healthy controls. Group discussions were conducted whenever questions arose regarding the data. Some studies reported lipid levels as mean ± standard error (SE); these values were converted to mean ± SD using the formula SD = SE ×√N, where N is the sample size. The method described by Wan et al. was applied to convert median and interquartile range (IQR) values into mean ± SD. 42 The Modified Newcastle–Ottawa Scale (NOS) tool (Supplementary file 1) was used to assess study quality.43–45 Studies were considered high quality if the NOS score was 5 or higher.
Statistical analysis
The mean, SD, and sample size were used to calculate the pooled standardized mean difference (SMD) with its 95% confidence interval (CI). Due to differences in study design, methods, and populations among the included studies, a random-effects model was applied. Heterogeneity was evaluated using the chi-square test and I2 statistic, with high heterogeneity defined as I2 > 50% or p <0.05. Sources of heterogeneity were determined through subgroup and meta-regression analyses. The robustness of the pooled results was assessed via sensitivity analysis. Publication bias was evaluated via visual inspection of the funnel plot, Egger’s test, and Begg and Mazumdar’s rank correlation test. When publication bias was detected, the trim-and-fill method was applied to adjust for it. A p-value <0.05 was considered statistically significant. Review Manager (version 5.4) and Comprehensive Meta-Analysis (version 3) software were used for all analyses.
Results
Study selection
A total of 916 articles were identified: PubMed (n = 466), Web of Science (n = 356), and Scopus (n = 94). The titles of these articles were compiled into spreadsheets, and two authors manually checked for duplicates, resulting in the removal of 340 duplicate articles. The titles and abstracts of the remaining 576 articles were then screened, and full texts were assessed when abstracts suggested potential eligibility. Ultimately, 538 articles were excluded for the following reasons: 39 were reviews, 6 were case reports, 4 were unavailable as full-text articles, 36 were non-English publications, 14 were animal studies, and 439 were deemed irrelevant. The updated search conducted on 9 July 2025 did not identify any new eligible articles.
Finally, 38 articles including 2485 patients were deemed eligible for inclusion (Table 1, Figure 1).16–18,21–26,28,29,31,32,46–70 For studies reporting lipid profiles separately for males and females as well as combined values, we included the separate male and female data rather than the combined values. Two studies24,69 reported measurements in millimoles per liter (mmol/L), which were converted to milligrams per deciliter (mg/dL) to maintain consistency with other studies.
Characteristics of the included studies.

Abbreviations: M: male; F: female; TC: total cholesterol; TG: triglycerides; LDL: low-density lipoprotein; HDL: high-density lipoprotein; NR: not reported; BMI: body mass index.

Flow diagram illustrating the article search process.
Study characteristics
The studies were conducted across various countries: 10 in Türkiye, 9 in Egypt, 4 each in Saudi Arabia and India, 3 in Iran, and 1 each in Iraq, Pakistan, Poland, Brazil, South Korea, China, and Jordan. One study did not specify the location. A total of 16 studies reported lipid profiles for females, 7 focused on males, and 21 included combined data from both sexes. The publication years ranged from 2007 to 2024. Regarding sample types, 7 studies measured plasma lipid levels, 27 used serum, and 4 analyzed lipid levels using whole blood samples. Participants’ mean ages ranged from 17 to 32.2 years. The highest reported mean BMI was <35 kg/m2, and the lowest was 20.5 ± 2.1 kg/m2. The duration of fasting was not clearly reported in 16 studies. Among the included studies, 33 were rated as high quality and 5 as low quality.
Association of blood lipid levels and acne
TC levels in acne
A total of 34 studies, including 2310 patients and 1950 controls, reported blood TC levels. The results indicated that TC levels were significantly higher in acne patients than in controls (pooled SMD = 0.92, 95% CI = 0.55–1.28; p < 0.00001; Figure 2). Significant heterogeneity was observed (I2 = 97%, p < 0.00001). Sensitivity analysis was conducted by removing studies one by one and showed that no single study substantially altered the results, confirming the robustness of the pooled findings. Publication bias was detected using Egger’s test (p = 0.0002), Begg and Mazumdar’s rank correlation test (p = 0.008), and an asymmetrical funnel plot (Figure 3(a)). The trim-and-fill method was applied to adjust for publication bias, and the results remained largely unchanged (adjusted SMD = 1.39, 95% CI = 0.98–1.81).

Forest plot of TC levels. TC: total cholesterol.
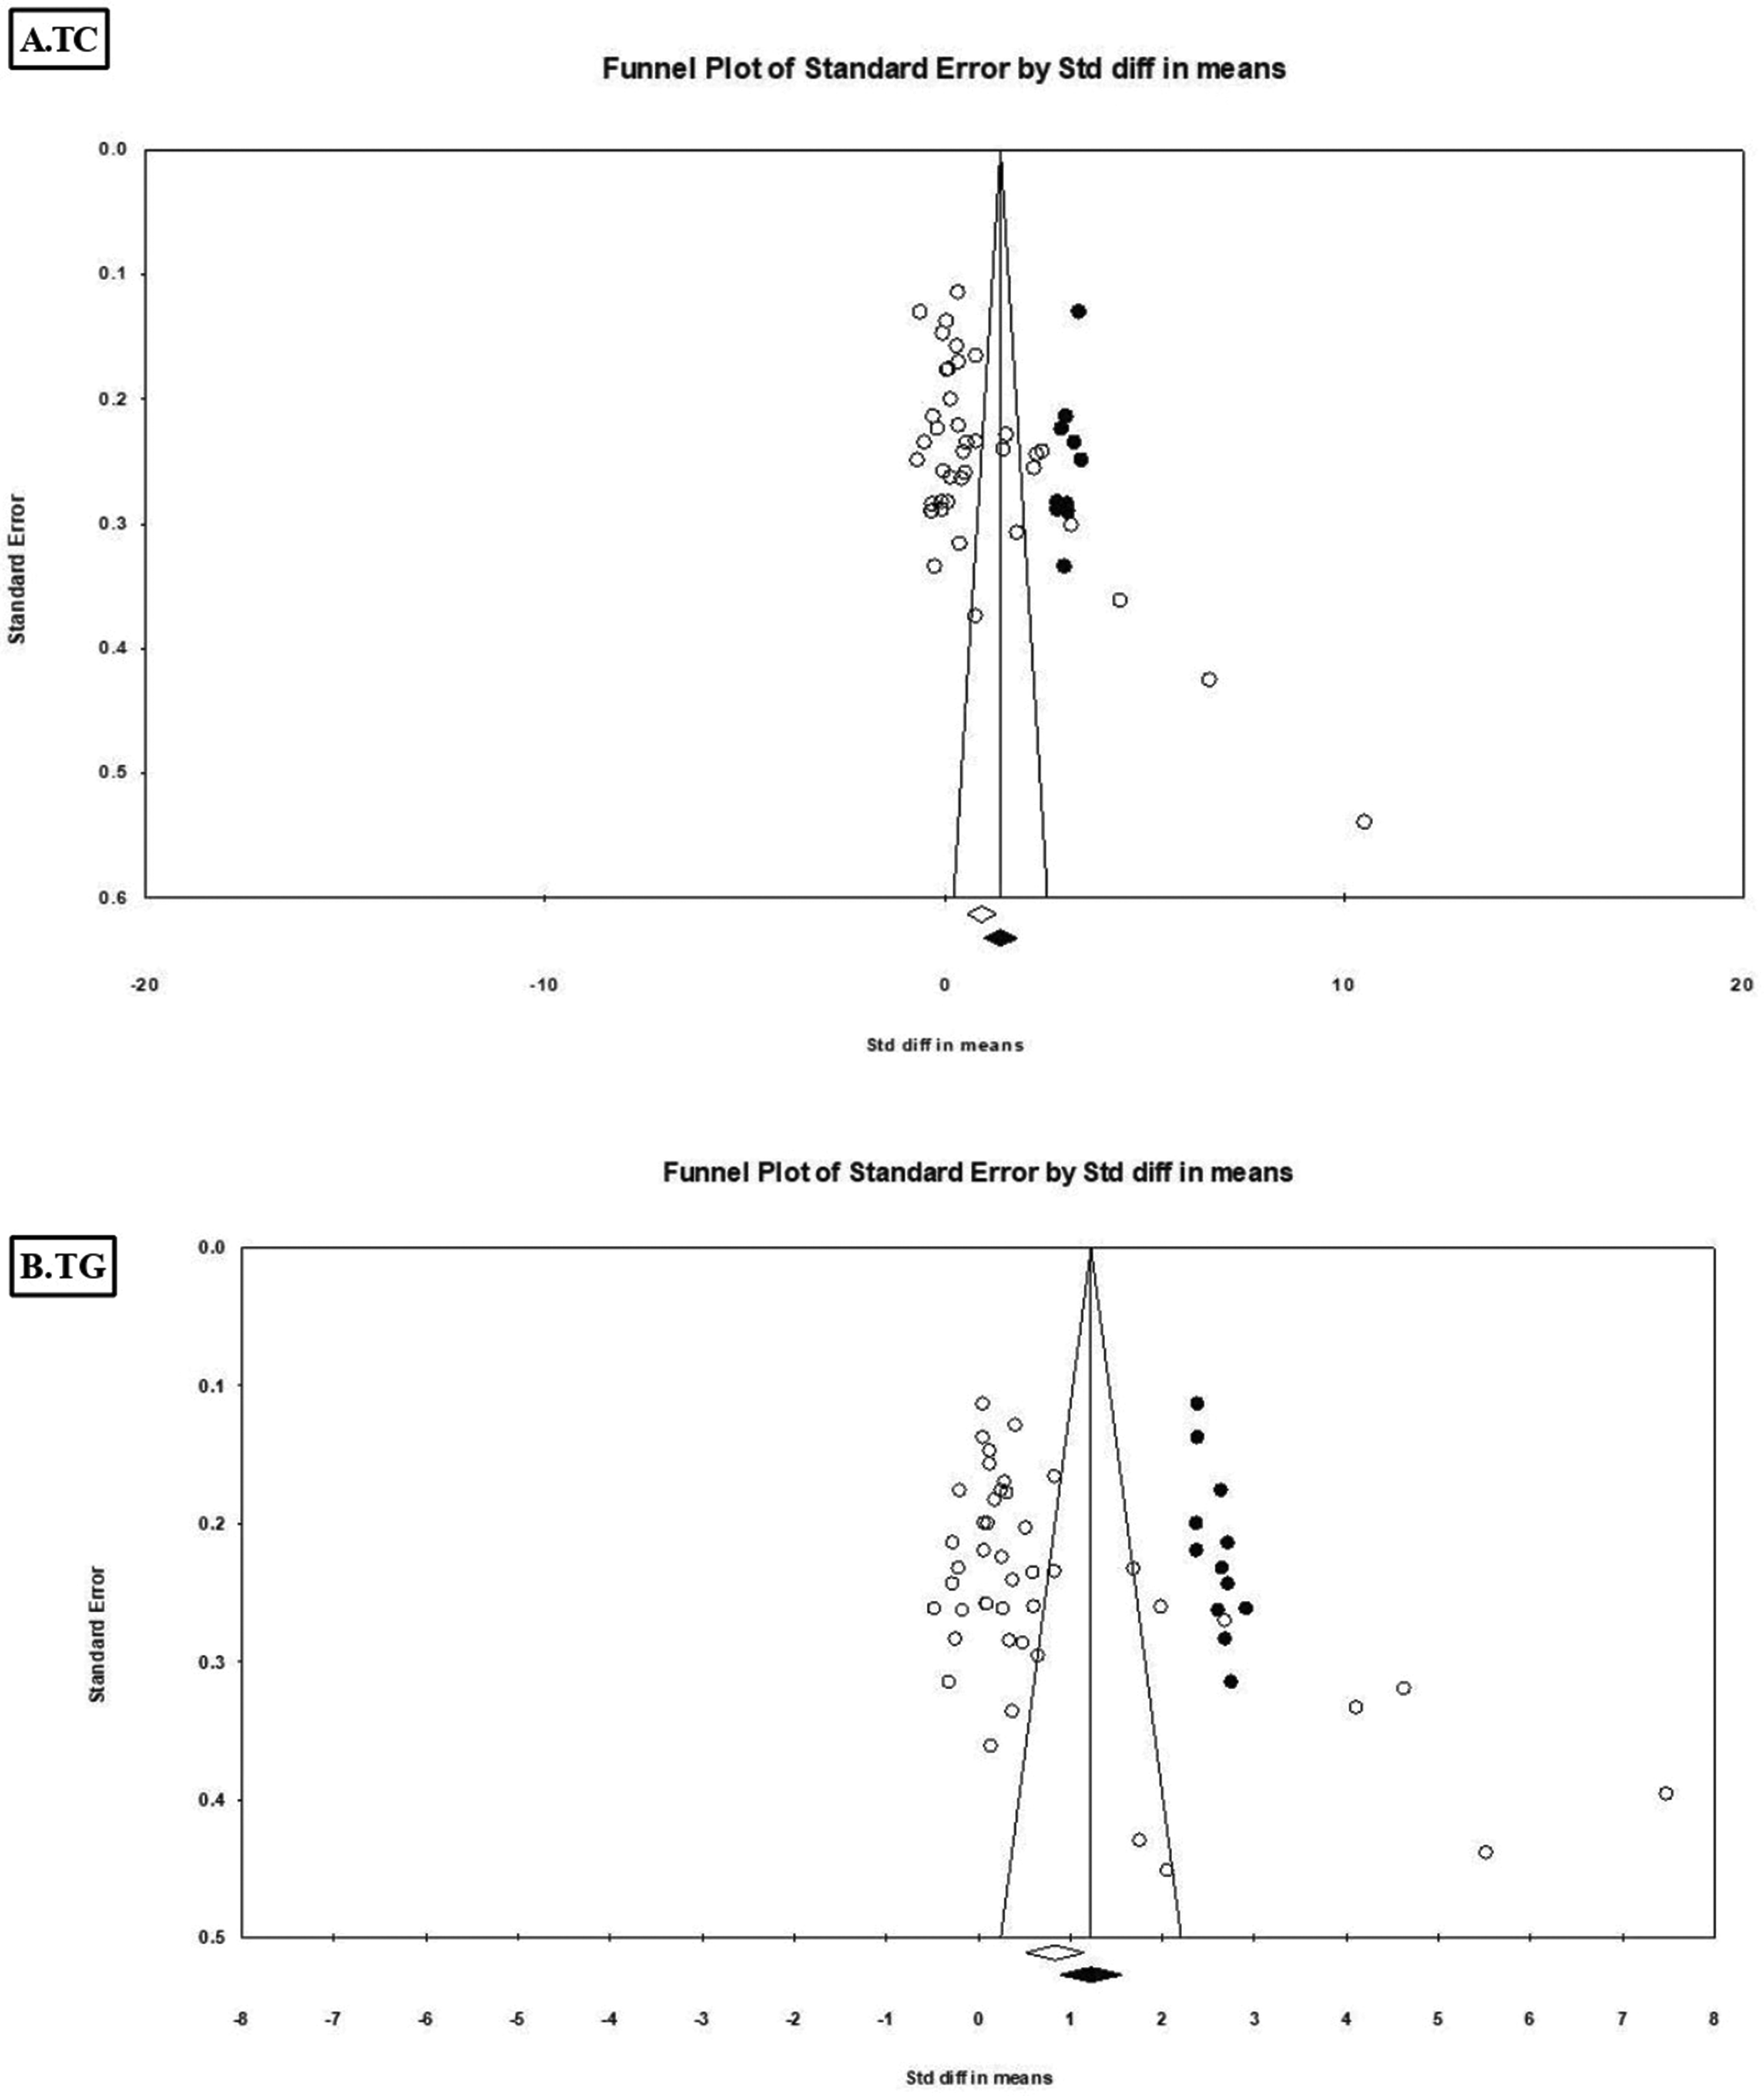
Funnel plots of TC and TG; the trim-and-fill method was applied. TC: total cholesterol; TG: triglycerides.
Subgroup analyses were conducted based on mean age (>24 years vs. <24 years), sex (male vs. female), study location (Egypt, Türkiye, Saudi Arabia, or Iran), drug history (sufficient vs. partial), and sample type (serum vs. plasma). High heterogeneity was observed across most subgroups: mean age > 24 years (I2 = 98%, p < 0.00001) and <24 years (I2 = 92%, p < 0.00001); Egypt (I2 = 93%, p < 0.00001); Saudi Arabia (I2 = 98%, p < 0.00001); Iran (I2 = 75%, p = 0.003); serum (I2 = 93%, p < 0.00001); plasma (I2 = 98%, p < 0.00001); sufficient drug history (I2 = 97%, p < 0.00001); partial drug history (I2 = 97%, p < 0.00001); female (I2 = 95%, p < 0.00001); and male (I2 = 93%, p < 0.00001). Notably, heterogeneity was low in studies conducted in Türkiye (I2 = 41%, p = 0.09).
A meta-regression analysis (Supplementary file 2) was performed using sex, publication year, study location, sample type, mean age, and drug history as covariates. The univariate meta-regression analysis identified sample type (p = 0.0002), study location (p < 0.001), mean age (p = 0.010), and sex (p = 0.023) as significant contributors to heterogeneity. In the multivariate meta-regression analysis, study location (p < 0.001) and sample type (p = 0.002) remained significant contributors to heterogeneity.
Subgroup analyses revealed higher TC levels in Egypt (SMD = 0.96, 95% CI = 0.40–1.52), Saudi Arabia (SMD = 7.14, 95% CI = 3.85–10.43), female patients (SMD = 0.93, 95% CI = 0.40–1.46), participants with mean age >24 years (SMD = 1.56, 95% CI = 0.76–2.36) and <24 years (SMD = 0.46, 95% CI = 0.15–0.76), those with sufficient drug history (SMD =0.82, 95% CI = 0.25–1.39) and partial drug history (SMD = 1.02, 95% CI = 0.53–1.51), and in both plasma (SMD = 1.60, 95% CI = 0.61–2.59) and serum (SMD = 0.47, 95% CI = 0.16–0.78) samples. In contrast, TC levels were not significantly higher in studies from Türkiye (SMD = −0.12, 95% CI = −0.33 to 0.09), Iran (SMD = 0.15, 95% CI = −0.24 to 0.54), or among male patients (SMD = 0.33, 95% CI = −0.29 to 0.95). Notably, the effect size (ES) was large in participants with mean age >24 years and in plasma samples but small in those with mean age <24 years and in serum samples. The forest plot for the subgroup analyses is provided in Supplementary file 3.
TG levels in acne
A total of 37 studies, including 2425 patients and 2085 controls, reported blood TG levels. The results showed that TG levels were significantly higher in acne patients than in controls (pooled SMD = 0.82, 95% CI = 0.51–1.14; p < 0.00001; Figure 4). Significant heterogeneity was observed (I2 = 96%, p < 0.00001). Sensitivity analysis indicated that no single study substantially affected the pooled result. Evidence of publication bias was suggested by an asymmetrical funnel plot (Figure 3(b)), Egger’s test (p = 0.000), and Begg and Mazumdar’s rank correlation test (p = 0.000). The trim-and-fill method did not significantly alter the results (adjusted SMD = 1.22, 95% CI = 0.88–1.56).
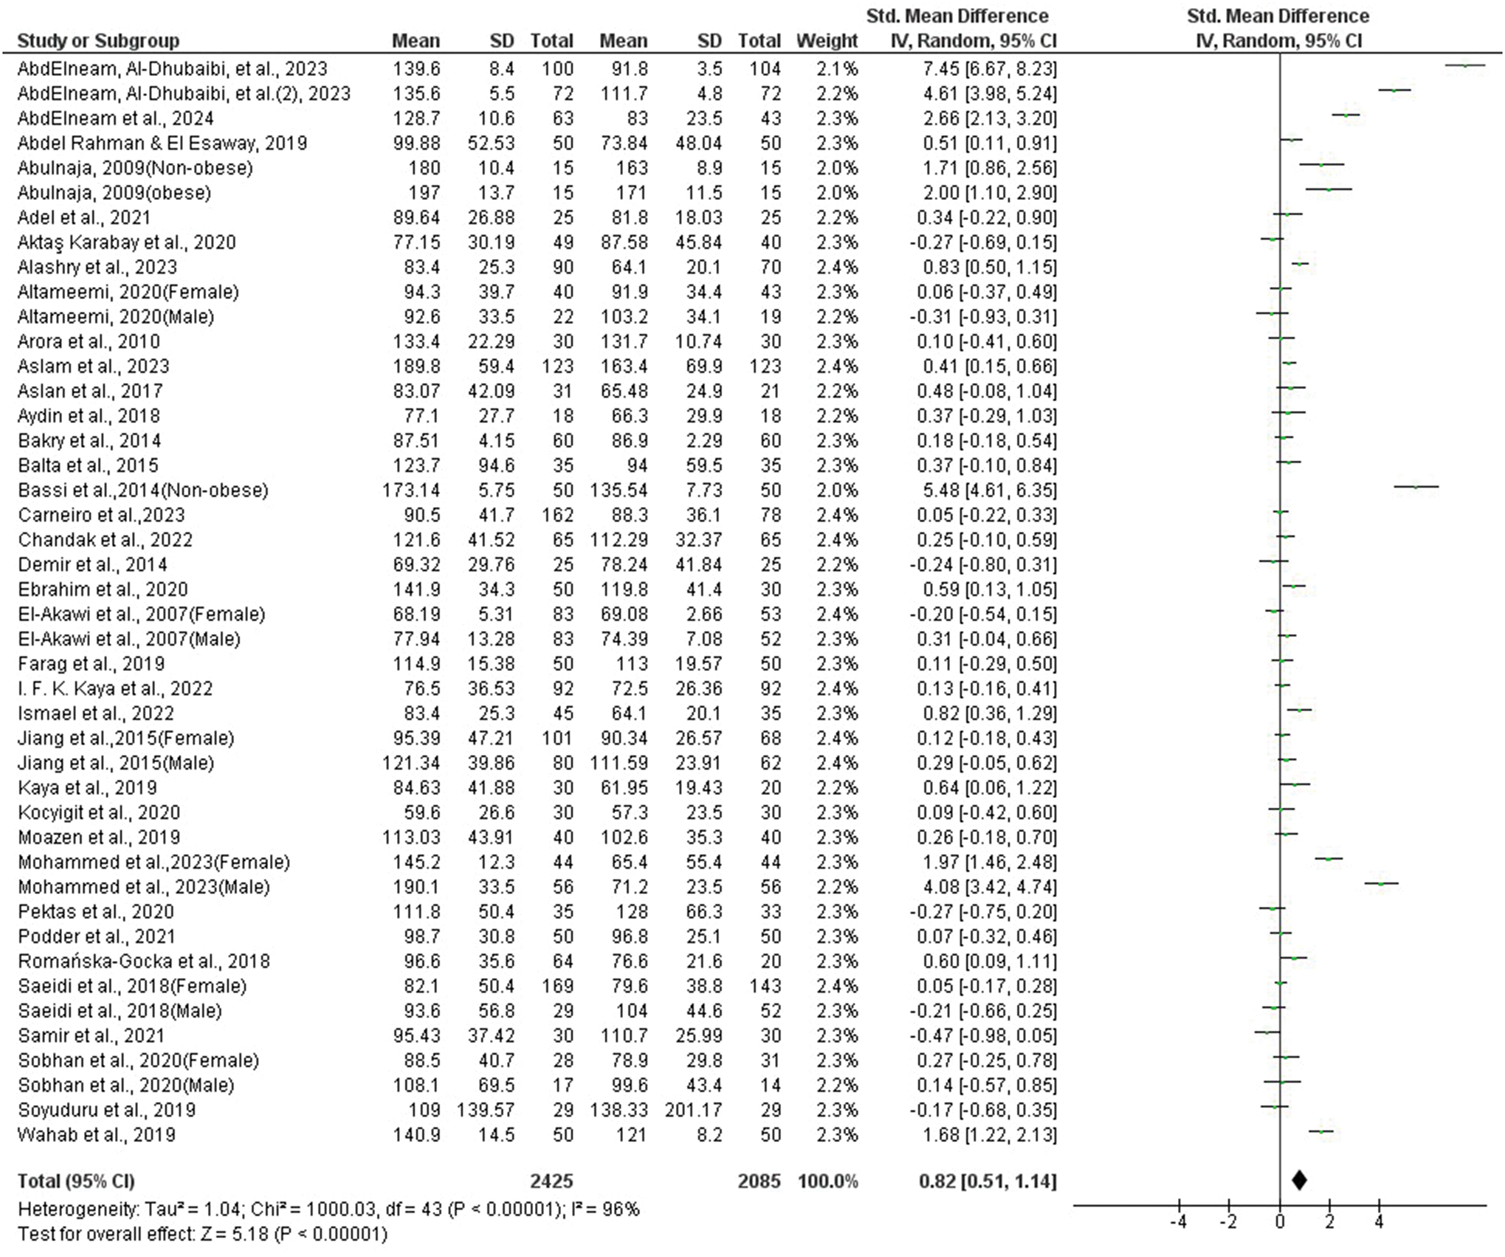
Forest plot of TG levels. TG: triglycerides.
Subgroup analyses revealed high heterogeneity in studies conducted in Egypt (I2 = 85%, p < 0.00001) and Saudi Arabia (I2 = 97%, p < 0.00001), among participants with mean age > 24 years (I2 = 98%, p < 0.00001) and <24 years (I2 = 90%, p < 0.00001), those with sufficient (I2 = 97%, p < 0.00001) or partial drug history (I2 = 94%, p < 0.00001), and in serum (I2 = 93%, p < 0.00001) and plasma (I2 = 97%, p < 0.00001) subgroups. In contrast, low heterogeneity was observed in studies from Iran (I2 = 0%, p = 0.60) and Türkiye (I2 = 39%, p = 0.10). Univariate meta-regression analysis identified study location (p = 0.000) as a significant contributor to the observed heterogeneity (Supplementary file 4).
Subgroup analysis further showed that TG levels were notably elevated in female patients (SMD = 0.76, 95% CI = 0.35–1.17; p = 0.0003), in studies from Saudi Arabia (SMD = 3.69, 95% CI = 1.76–5.62; p = 0.0002) and Egypt (SMD = 0.51, 95% CI = 0.15–0.88; p = 0.005), and among participants with mean age > 24 years (SMD = 1.40, 95% CI = 0.63–2.16; p = 0.0003) and <24 years (SMD = 0.47, 95% CI = 0.22–0.72; p = 0.0002). Elevated TG levels were also observed in both plasma (SMD = 1.05, 95% CI = 0.21–1.88; p = 0.01) and serum (SMD = 0.67, 95% CI = 0.36–0.97; p < 0.0001) samples as well as in patients with sufficient (SMD = 1.12, 95% CI = 0.55–1.69; p = 0.0001) and partial drug history (SMD = 0.55, 95% CI = 0.22–0.89; p = 0.001). However, TG levels were not significantly higher in studies from Türkiye (SMD = 0.09, 95% CI = −0.11 to 0.28; p = 0.38), Iran (SMD = 0.08, 95% CI =−0.09 to 0.24; p = 0.37), or in male patients (SMD = 0.56, 95% CI = −0.30 to 1.43; p = 0.20). The forest plot for the subgroup analysis is provided in Supplementary file 5.
LDL levels in acne
A total of 34 studies, including 2280 patients and 1950 controls, were analyzed for blood LDL levels. The results demonstrated that LDL levels were significantly higher in acne patients than in controls (pooled SMD = 1.52, 95% CI = 1.11–1.92; p < 0.00001; Figure 5). Significant heterogeneity was observed (I2 = 97%, p < 0.00001). Sensitivity analysis indicated that no single study substantially influenced the overall result. Evidence of publication bias was suggested by an asymmetrical funnel plot (Figure 6(a)), Egger’s test (p = 0.000), and Begg and Mazumdar’s rank correlation test (p = 0.0003). The trim-and-fill method did not substantially alter the results (adjusted SMD = 2.49, 95% CI = 1.91–3.07).

Forest plot of LDL levels. LDL: low-density lipoprotein.

Funnel plots of LDL and HDL; the trim-and-fill method was applied. LDL: low-density lipoprotein; HDL: high-density lipoprotein.
Subgroup analyses identified several sources of high heterogeneity, including mean age >24 years (I2 = 98%, p < 0.00001), mean age <24 years (I2 = 93%, p < 0.00001), male (I2 = 95%, p < 0.00001), female (I2 = 94%, p < 0.00001), Saudi Arabia (I2 = 99%, p < 0.00001), Egypt (I2 = 92%, p < 0.00001), Türkiye (I2 = 67%, p = 0.002), plasma samples (I2 = 99%, p < 0.00001), serum samples (I2 = 93%, p < 0.00001), sufficient drug history (I2 = 97%, p < 0.00001), and partial drug history (I2 = 97%, p < 0.00001). In contrast, studies from Iran (I2 = 38%, p = 0.17) did not contribute to heterogeneity.
Univariate meta-regression analysis demonstrated that publication year (p = 0.000), sex (p = 0.000), mean age (p = 0.000), sample type (p = 0.000), and study location (p = 0.000) were significant contributors to heterogeneity (Supplementary file 6). Multivariate meta-regression confirmed that publication year (p = 0.000), sex (p = 0.032), mean age (p = 0.039), sample type (p = 0.000), and study location (p = 0.000) remained significant sources of heterogeneity.
Subgroup analyses showed that LDL levels were significantly higher in Egypt (SMD = 1.25, 95% CI = 0.69–1.81), Saudi Arabia (SMD = 9.95, 95% CI = 3.75–16.15), female patients (SMD = 1.00, 95% CI = 0.53–1.48), participants with mean age >24 years (SMD = 3.07, 95% CI = 2.10–4.05) and <24 years (SMD = 0.78, 95% CI = 0.45–1.12), plasma samples (SMD = 3.89, 95% CI = 2.54–5.24), serum samples (SMD = 0.87, 95% CI = 0.53–1.21), participants with sufficient drug history (SMD = 1.39, 95% CI = 0.77–2.02), and those with partial drug history (SMD =1.61, 95% CI = 1.07–2.15). LDL levels were not significantly higher in studies from Türkiye (SMD = 0.05, 95% CI = −0.23 to 0.33), Iran (SMD = 0.11, 95% CI = −0.13 to 0.35), or among male patients (SMD = 0.48, 95% CI = −0.28 to 1.24). The forest plot for the subgroup analyses is provided in Supplementary file 7.
HDL levels in acne
A total of 36 studies including 2395 patients and 2065 controls reported blood HDL levels. The initial analysis showed no significant difference between patients with acne and controls (pooled SMD = −0.25, 95% CI = −0.54 to 0.04; p = 0.09). However, sensitivity analysis indicated that two studies46,50 had a substantial influence on the pooled results. After excluding one of these studies, 46 the pooled SMD changed to −0.32 (95% CI = −0.60 to −0.05; p = 0.02). When the other study 50 (female) was excluded, the pooled result was SMD = −0.31 (95% CI = −0.59 to −0.02; p = 0.03), whereas the exclusion of the study 50 (male) yielded an SMD of −0.32 (95% CI = −0.59 to −0.04; p = 0.02). After excluding these studies, the pooled analysis demonstrated a significant reduction in HDL levels among patients with acne (SMD = −0.45, 95% CI = −0.69 to −0.21; p = 0.0002; I2 = 93%; Figure 7).

Forest plot of HDL levels. HDL: high-density lipoprotein.
Although the funnel plot (Figure 6(b)) appeared asymmetric, Egger’s test (p = 0.17) and Begg and Mazumdar rank correlation test (p = 0.45) did not indicate statistically significant publication bias. Furthermore, the trim-and-fill method did not significantly alter the results (adjusted SMD = −0.68, 95% CI = −0.95 to −0.42).
Subgroup analysis revealed substantial heterogeneity across the male (I2 = 79%, p < 0.0001), female (I2 = 94%, p < 0.00001), serum (I2 = 93%, p < 0.00001), plasma (I2 = 90%, p < 0.00001), Egypt (I2 = 93%, p < 0.00001), Iran (I2 = 84%, p < 0.0001), Saudi Arabia (I2 = 97%, p < 0.00001), sufficient drug history (I2 = 90%, p < 0.00001), mean age <24 years (I2 = 93%, p < 0.00001), mean age >24 years (I2 = 93%, p < 0.00001), and partial drug history (I2 = 94%, p < 0.00001) subgroups. In contrast, the Türkiye subgroup (I2 = 12%, p = 0.34) did not show significant heterogeneity. Univariate meta-regression analysis identified study location (p = 0.0007) as the only significant source of heterogeneity (Supplementary file 8). Further subgroup analyses demonstrated significantly lower HDL levels in serum samples (SMD = −0.43, 95% CI = −0.76 to −0.10; p = 0.01), plasma samples (SMD = −0.42, 95% CI = −0.85 to 0.00; p = 0.05), Egypt (SMD = −1.05, 95% CI = −1.61 to −0.50; p = 0.0002), sufficient drug history (SMD = −0.51, 95% CI = −0.84 to −0.18; p = 0.002), partial drug history (SMD = −0.40, 95% CI = −0.75 to −0.05; p = 0.02), and mean age <24 years (SMD = −0.54, 95% CI = −0.85 to −0.23; p = 0.0005). No significant differences were observed in the male (SMD = −0.07, 95% CI = −0.46 to 0.32), female (SMD = −0.43, 95% CI = −0.89 to 0.03), mean age > 24 years (SMD = −0.29, 95% CI = −0.70 to 0.13), Türkiye (SMD =−0.04, 95% CI = −0.21 to 0.12), Iran (SMD = 0.27, 95% CI = −0.22 to 0.76), or Saudi Arabia (SMD = −0.57, 95% CI = −2.01 to 0.87) subgroups. The forest plot for the subgroup analysis is presented in Supplementary file 9.
Discussion
Cholesterol is an integral component of cell membranes and contributes significantly to maintaining membrane integrity and fluidity as well as to cell signaling and intercellular transport. In addition, cholesterol serves as a precursor for the synthesis of steroid hormones, vitamin D, and bile acids. 71 Lipoproteins carry cholesterol in the blood circulation. The core of lipoproteins contains cholesterol and TG, which are surrounded by phospholipids and apolipoproteins. 72 Based on density, lipoproteins are classified into five types: chylomicrons, very low-density lipoproteins (VLDL), intermediate-density lipoproteins (IDL), LDL, and HDL. 73 Among these, LDL transports cholesterol from the liver to peripheral tissues, whereas HDL facilitates reverse transport from peripheral tissues to the liver. 74 In contrast, VLDL primarily transports TG, which represents the lipid storage form. 75 To measure TC, TG, HDL, and LDL levels in the blood, a test known as a lipid profile or standard lipid panel is performed.76,77 Abnormal lipid profiles have been reported among patients with acne. 78 Such abnormalities increase skin fragility and worsen acne lesions. 79 The sebaceous gland plays a major role in maintaining skin integrity by secreting sebum, with approximately 90% of the skin surface lipids produced by this gland. 80 Sebum is composed of cholesterol esters, TG, wax esters, and squalene. 81 The sebum-secreting sebaceous gland is involved in acne pathogenesis when it becomes hyperactive. Hyperactivity alters sebum composition, resulting in changes in lipid content, particularly a reduction in linoleic acid. Linoleic acid is essential for preventing comedogenesis. In addition, alterations in lipid composition may increase the levels of oxidizable squalene, thereby promoting inflammation. 82 Oxidized squalene stimulates keratinocyte lipoxygenase, leading to the release of IL6. IL6 further enhances keratinocyte proliferation, resulting in hyperkeratinization. 83 Several receptors expressed in sebocytes, including histamine receptors, dihydrotestosterone receptors, neuromodulator receptors, and corticotropin-releasing hormone receptors, regulate sebum production.84–86 Sebocytes also secrete leptin, which induces lipid droplet formation and promotes the release of proinflammatory cytokines, such as IL6 and IL8, thereby contributing to inflammation. 87 C. acnes further induces inflammation by producing proinflammatory cytokines and matrix metalloproteinase-9 (MMP-9) as well as by activating Toll-like receptor-2 on keratinocytes. 88 MMP-9 promotes follicular rupture and CD4+ cell infiltration, which further exacerbates inflammation. 89 Currently, six gene loci, including 11q13.1, 5q11.2, 11p11.2, 1q41, 1q24.2, and 8q24, have been identified as being associated with severe acne. Moreover, these loci are involved in androgen metabolism, inflammatory pathways, and scar formation.90–92 Patients with acne exhibit significantly higher tumor necrosis factor (TNF) gene transcript levels. 93 Furthermore, the −308 G/A polymorphism in the TNF gene has been reported to increase the risk of acne among Caucasians, as demonstrated by a meta-analysis. 94
To the best of our knowledge, this study is the first meta-analysis to evaluate lipid profile levels in patients with acne compared with healthy controls. The analysis included 38 original articles, of which 34 reported TC, LDL, and HDL levels, whereas 37 studies reported TG levels. The results demonstrated that TC, TG, and LDL levels were significantly higher and HDL levels were lower in patients with acne. Moreover, the pooled ESs were large for TC (SMD = 0.92), TG (SMD = 0.82), and LDL (SMD = 1.52). In contrast, although HDL levels were reduced in acne, the ES was small (SMD = −0.45). A pooled ES is considered large when the SMD exceeds 0.8, moderate when the SMD ranges from 0.5 to 0.8, and small when the SMD ranges from 0.2 to 0.5. 95
Lipid abnormalities are associated with vascular endothelial dysfunction and atherogenesis, which may lead to the development of atherosclerotic diseases. 96 Previous studies have reported a relationship between androgens and abnormal lipid levels, demonstrating that androgens increase LDL levels while reducing HDL levels. This lipid imbalance promotes the development of atherosclerosis.34,97 Although current evidence has not yet confirmed a direct association between acne and atherosclerosis or other cardiovascular diseases, acne has been linked to several cardiovascular risk factors, including obesity, hyperlipidemia, hypertension, and diabetes. 34 These findings suggest a potential link between acne and atherosclerosis. Recently, a narrative review described the association between lipid abnormalities and acne. 78 However, the review provided only descriptive findings without quantitative analysis and included only 20 studies, whereas the present meta-analysis incorporated 38 studies. In addition, the current study performed subgroup analyses to explore the association between acne and factors such as sex, geographical location, and age. Although the narrative review reported abnormal lipid profiles in patients with acne, the present statistical analysis confirmed these findings quantitatively. The robustness of the results was further supported by sensitivity analyses. Despite these findings, significant heterogeneity was observed. Subgroup and meta-regression analyses were therefore conducted to identify potential sources of heterogeneity. Mean age (<24 years vs. > 24 years), drug history (sufficient vs. partial), sex (female vs. male), sample type (plasma vs. serum), and studies conducted in Egypt were identified as major contributors to heterogeneity. Meta-regression analysis further indicated that study location was a significant source of heterogeneity across all lipid parameters, suggesting that geographical variation influenced the results.
Subgroup analysis also revealed that all lipids were significantly altered in Egyptian studies. Higher TC, TG, and LDL were observed in Saudi Arabian studies, but no alterations were noted in Turkish and Iranian studies. Female patients showed significant changes in their lipid profiles, whereas male patients did not. Although higher lipid levels (TC, TG, and LDL) were found in both age groups (mean <24 years and >24 years), the ESs were larger in the >24 years group. In contrast, the younger group (<24 years) had reduced HDL values, but this was not observed in the older group. The ES were also higher for plasma TC and LDL than for serum. Based on drug history, we performed subgroup analysis and divided the studies into two categories: sufficient drug history and partial drug history. In the sufficient drug history group, no participants were taking oral hormonal therapy, oral isotretinoin, or other oral acne medications. In the partial drug history group, participants did not take lipid-affecting drugs or oral isotretinoin. Significant lipid alterations were observed in both groups; however, no significant differences were found between them.
Acne patients exhibited higher TC, TG, and LDL levels as well as lower HDL levels compared with controls, indicating abnormal lipid profiles as reported by multiple studies. Lipid profiles are considered abnormal when TC exceeds 200 mg/dL, TG exceeds 150 mg/dL, LDL exceeds 100 mg/dL, and HDL falls below 40 mg/dL.98–100 Several studies included in our meta-analysis reported lipid abnormalities in acne patients. Abnormal TC levels were reported by 6 studies,16–18,26,50,62 abnormal TG levels were reported by 4 studies,16,21,50,70 abnormal LDL levels were reported by 19 studies,16–18,21–24,26,32,46,47,49,50,61,64,66,68–70 and low HDL levels were reported by 5 studies.17,21,23,25,26 In conclusion, our findings suggest that individuals with acne should undergo regular lipid profile assessment. Targeting lipid abnormalities may be an important component of effective acne management, and further research is warranted to clarify the role of lipids in acne.
Limitations
This meta-analysis had certain limitations, including the inability to perform subgroup analysis based on acne severity. The studies included participants with acne ranging from mild to severe and reported their lipid profiles collectively; therefore, we could not perform a subgroup analysis by acne severity. Although we conducted a subgroup analysis based on mean age, further research should separately examine teenagers and adults, especially those over 24 years of age. Furthermore, we could not perform a subgroup analysis based on obesity due to the insufficient number of studies including only obese or only non-obese patients. The highest mean BMI in the included studies was <35, reported in only two studies; the remaining studies had a mean BMI <30. We excluded these two studies one at a time during sensitivity analysis, but the pooled results were not significantly altered. Results from the subgroup analysis of Saudi Arabian studies should be interpreted with caution. The ES was abnormally high; therefore, we excluded all these studies at a time during sensitivity analysis, and the pooled results were not significantly altered. Consequently, these studies were retained in the meta-analysis. Another limitation of the study was significant heterogeneity; substantial heterogeneity may arise from factors not assessed in the original studies. We recommend that future research include an evaluation of factors influencing lipid levels, such as BMI, diet, sedentary lifestyle, smoking status, family history, medication history, and ethnicity, in relation to acne.
Conclusion
Patients with acne vulgaris exhibited altered lipid profiles, particularly in female patients, older age groups, and individuals from Saudi Arabia and Egypt.
Supplemental Material
sj-pdf-1-imr-10.1177_03000605261417135 - Supplemental material for Alterations in the lipid profile in acne vulgaris patients: A meta-analysis
Supplemental material, sj-pdf-1-imr-10.1177_03000605261417135 for Alterations in the lipid profile in acne vulgaris patients: A meta-analysis by Md. Mojahidur Hasan, Sehreen Tory, Yusuf Kemal Arslan and Yusuf Tutar in Journal of International Medical Research
Supplemental Material
sj-pdf-2-imr-10.1177_03000605261417135 - Supplemental material for Alterations in the lipid profile in acne vulgaris patients: A meta-analysis
Supplemental material, sj-pdf-2-imr-10.1177_03000605261417135 for Alterations in the lipid profile in acne vulgaris patients: A meta-analysis by Md. Mojahidur Hasan, Sehreen Tory, Yusuf Kemal Arslan and Yusuf Tutar in Journal of International Medical Research
Supplemental Material
sj-pdf-3-imr-10.1177_03000605261417135 - Supplemental material for Alterations in the lipid profile in acne vulgaris patients: A meta-analysis
Supplemental material, sj-pdf-3-imr-10.1177_03000605261417135 for Alterations in the lipid profile in acne vulgaris patients: A meta-analysis by Md. Mojahidur Hasan, Sehreen Tory, Yusuf Kemal Arslan and Yusuf Tutar in Journal of International Medical Research
Supplemental Material
sj-pdf-4-imr-10.1177_03000605261417135 - Supplemental material for Alterations in the lipid profile in acne vulgaris patients: A meta-analysis
Supplemental material, sj-pdf-4-imr-10.1177_03000605261417135 for Alterations in the lipid profile in acne vulgaris patients: A meta-analysis by Md. Mojahidur Hasan, Sehreen Tory, Yusuf Kemal Arslan and Yusuf Tutar in Journal of International Medical Research
Supplemental Material
sj-pdf-5-imr-10.1177_03000605261417135 - Supplemental material for Alterations in the lipid profile in acne vulgaris patients: A meta-analysis
Supplemental material, sj-pdf-5-imr-10.1177_03000605261417135 for Alterations in the lipid profile in acne vulgaris patients: A meta-analysis by Md. Mojahidur Hasan, Sehreen Tory, Yusuf Kemal Arslan and Yusuf Tutar in Journal of International Medical Research
Supplemental Material
sj-pdf-6-imr-10.1177_03000605261417135 - Supplemental material for Alterations in the lipid profile in acne vulgaris patients: A meta-analysis
Supplemental material, sj-pdf-6-imr-10.1177_03000605261417135 for Alterations in the lipid profile in acne vulgaris patients: A meta-analysis by Md. Mojahidur Hasan, Sehreen Tory, Yusuf Kemal Arslan and Yusuf Tutar in Journal of International Medical Research
Supplemental Material
sj-pdf-7-imr-10.1177_03000605261417135 - Supplemental material for Alterations in the lipid profile in acne vulgaris patients: A meta-analysis
Supplemental material, sj-pdf-7-imr-10.1177_03000605261417135 for Alterations in the lipid profile in acne vulgaris patients: A meta-analysis by Md. Mojahidur Hasan, Sehreen Tory, Yusuf Kemal Arslan and Yusuf Tutar in Journal of International Medical Research
Supplemental Material
sj-pdf-8-imr-10.1177_03000605261417135 - Supplemental material for Alterations in the lipid profile in acne vulgaris patients: A meta-analysis
Supplemental material, sj-pdf-8-imr-10.1177_03000605261417135 for Alterations in the lipid profile in acne vulgaris patients: A meta-analysis by Md. Mojahidur Hasan, Sehreen Tory, Yusuf Kemal Arslan and Yusuf Tutar in Journal of International Medical Research
Supplemental Material
sj-pdf-9-imr-10.1177_03000605261417135 - Supplemental material for Alterations in the lipid profile in acne vulgaris patients: A meta-analysis
Supplemental material, sj-pdf-9-imr-10.1177_03000605261417135 for Alterations in the lipid profile in acne vulgaris patients: A meta-analysis by Md. Mojahidur Hasan, Sehreen Tory, Yusuf Kemal Arslan and Yusuf Tutar in Journal of International Medical Research
Footnotes
Acknowledgments
We gratefully acknowledge Recep Tayyip Erdoğan University for providing institutional access to Web of Science, Scopus, and PubMed, which facilitated the literature search and retrieval of full-text articles required for this study.
Authors’ contribution
MMH and ST: Conceptualization, writing of the original draft, methodology, data extraction, statistical analysis, validation, visualization, software, review and editing; YKA: Visualization, statistical analysis, review and editing; YT: Supervision, visualization, statistical analysis, review and editing.
Data availability statement
All data used in this meta-analysis were extracted from previously published research listed in the reference list and are publicly accessible online.
Declaration of conflicting interests
The authors declare no conflicts of interest.
Ethical statement
No ethical approval was required for this study.
Funding
The authors have no relevant financial or nonfinancial interests to disclose.
Supplemental material
Supplemental material for this article is available online.
References
Supplementary Material
Please find the following supplemental material available below.
For Open Access articles published under a Creative Commons License, all supplemental material carries the same license as the article it is associated with.
For non-Open Access articles published, all supplemental material carries a non-exclusive license, and permission requests for re-use of supplemental material or any part of supplemental material shall be sent directly to the copyright owner as specified in the copyright notice associated with the article.