
Abstract
Nonalcoholic fatty liver disease (NAFLD) is the most common chronic liver disease in western countries, affecting 25–30% of the general population and up to 65% in those with obesity and/or type 2 diabetes. Accumulation of visceral adipose tissue and insulin resistance (IR) contributes to NAFLD. NAFLD is not an innocent entity as it not only may cause nonalcoholic steatohepatitis and cirrhosis but also contribute to cardiovascular morbidity and mortality. More and more people with type 1 diabetes (T1D) are becoming overweight and present with features of IR, but the prevalence and impact of NAFLD in this population are still unclear. The utility of noninvasive screening tools for NAFLD in T1D is being explored. Recent data indicate that based upon ultrasonographic criteria NAFLD is present in 27% (ranging between 19% and 31%) of adults with T1D. Magnetic resonance imaging data indicate a prevalence rate of 8.6% (ranging between 2.1% and 18.6%). There are, however, multiple factors affecting these data, ranging from study design and referral bias to discrepancies in between diagnostic modalities. Individuals with T1D have a 7-fold higher risk of cardiovascular disease (CVD) and cardiovascular mortality is the most prominent cause of death in T1D. Patients with T1D and NALFD are also more prone to develop CVD, but the independent contribution of NAFLD to cardiovascular events has to be determined in this population. Furthermore, limited data in T1D also point towards a 2 to 3 times higher risk for microvascular complications in those with NAFLD. In this article, we will discuss epidemiological and diagnostic challenges of NAFLD in T1D, explore the link between IR and NAFLD and chronic complications, and examine the independent contribution of NAFLD to the presence of macro-, and microvascular complications.
Introduction
Nonalcoholic fatty liver disease (NAFLD) encompasses a spectrum of chronic liver disorders hallmarked by intrahepatic triglyceride accumulation in the absence of excessive alcohol consumption and other causes for steatosis such as use of steatogenic drug or chronic liver disorders associated with steatosis such as viral hepatitis, Wilson’s disease or alpha-1 antitrypsin deficiency. 1 NAFLD ranges from isolated or ‘simple’ steatosis, which is relatively benign, to more harmful nonalcoholic steatohepatitis (NASH). NASH can induce progressive fibrosis which can ultimately lead to cirrhosis, with a risk of decompensation and also increasing the risk of hepatocellular carcinoma (in up to 0.5–2.6% of those with NAFLD-cirrhosis). 2 The latter can, however, also occur in noncirrhotic NAFLD. 3 NAFLD is a complex heterogeneous condition with hepatic and systemic manifestations involving multiple pathways influenced by genetic, epigenetic, and environmental factors. 4 Accumulation of visceral adipose tissue (VAT) and ensuing insulin resistance (IR) contributes to NAFLD; hence, NAFLD is regarded as the hepatic manifestation of the metabolic syndrome. The pathophysiological relationship between NAFLD and IR is bidirectional.5,6 NAFLD is present in up to 65% of individuals with obesity and/or type 2 diabetes (T2D), whereas the global prevalence is estimated around 25%.7,8 Both obesity and T2D act as accelerators of disease progression, as the proportion of people that evolve towards NASH and/or fibrosis is greater in these risk groups. 9 However, NAFLD is not always associated with IR or the metabolic syndrome, which is referred to as NAFLD in lean people.10–12 Although the strongest genetic risk alleles for NAFLD, such as the I148M allele in PNPLA3 and the E167 K allele in TM6SF2, have been associated with an increased liver fat content and progression to NASH and significant fibrosis, they are not linked to IR or the metabolic syndrome, and are unexpectedly associated with a lower risk of cardiovascular disease (CVD).13–16
At present NAFLD is the second leading cause for liver transplantation in the United States and is expected to become the primary cause of liver transplantation in Europe.17,18 Moreover, NAFLD may also contribute to cardiovascular disease (CVD). Recent meta-analyses show an increased risk for incident CVD in all NAFLD stages, which increases with histological severity in terms of activity of the disease as well as fibrosis stage, in particular with the presence of significant fibrosis.19–21 As mentioned above, to elucidate the contribution of NAFLD to CVD, independent of the intrinsic contribution of the metabolic syndrome, genetic analyses may be warranted since some of the genes most robustly associated with NAFLD have been associated with an apparent protection from CVD, possibly via their effects on lipoprotein metabolism.13–16
Type 1 diabetes (T1D) is a chronic autoimmune disease characterized by pancreatic beta-cell destruction resulting in hyperglycaemia and lifelong insulin dependency. In contrast to the classical phenotype of the person with NAFLD, patients with T1D are typically considered lean and insulin sensitive. However, having T1D does not protect against overweight. Indeed, recent evidence demonstrates that more and more people with T1D are becoming overweight and present with features of IR due to sedentary lifestyle, caloric excess, and intensive insulin therapy,22,23 but the prevalence and impact of NAFLD in this population is still unclear. Based upon ultrasonographic criteria NAFLD is reported in 27% (ranging between 19% and 31%) of adults with T1D, while magnetic resonance imaging (MRI) data indicate a prevalence rate of 8.6% (ranging between 2.1% and 18.6%). 24 There are, however, multiple factors affecting the accuracy of these data including study design and referral bias, but also discrepancies in diagnostic accuracy of the diagnostic modalities.
Individuals with T1D have a 7-fold higher risk of CVD, arising 10 years earlier in life as compared to healthy controls, and being responsible for a significant quality of life reduction and a loss of approximately 11 years of life expectancy. Furthermore, an association exists between excess VAT, IR and micro-, and macrovascular complications.22,25–30 In addition, limited data in T1D indicate that patients with T1D and NALFD are more prone to develop CVD and present a 2 to 3 times higher risk for microvascular complications as compared to those without NAFLD.29,31,32
In this article, we will discuss epidemiological and diagnostic challenges of NAFLD in T1D, explore the link between IR and NAFLD and chronic complications, and examine the potential independent contribution of NAFLD to the presence of macro-, and microvascular complications (see Figure 1).
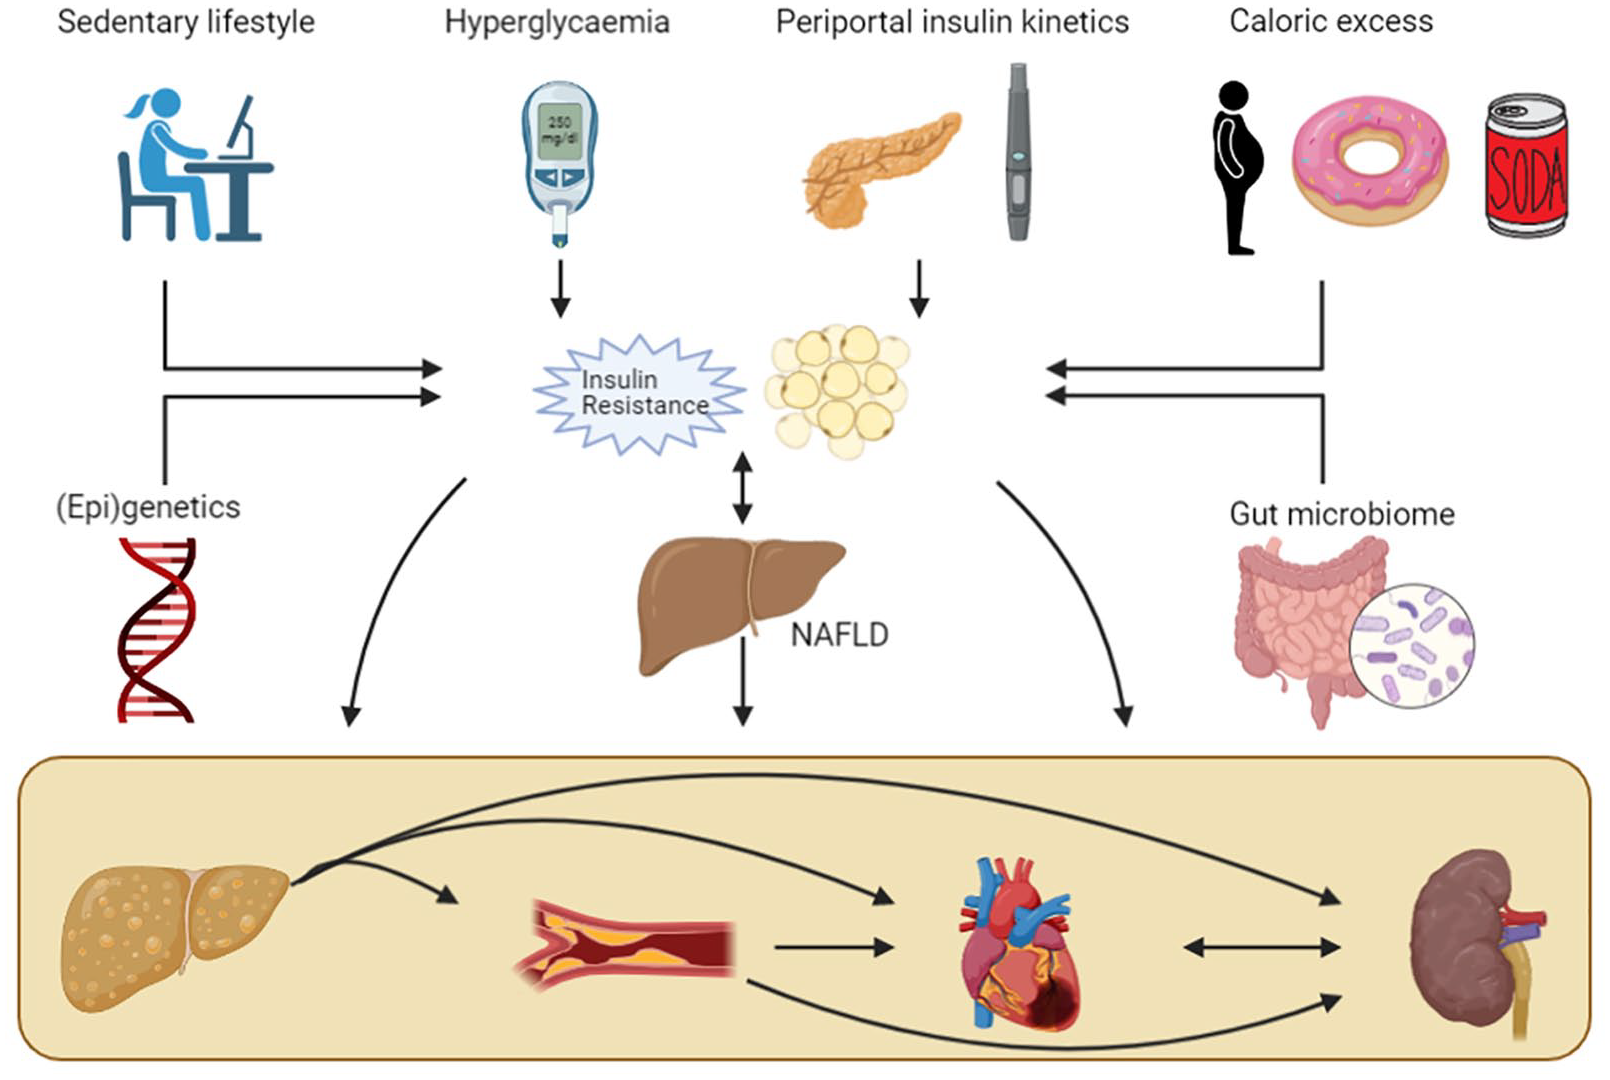
The complex relationship between T1D, NAFLD, and chronic complications.
Methodology
A structured search was conducted using PubMed (MEDLINE), Web of Science and Google Scholar for studies reporting on T1D and NAFLD entering Medical Subject Headings (MeSH) terms: ‘Nonalcoholic Fatty Liver Disease’ or/and ‘type 1 diabetes mellitus’ combined with the subheadings ‘epidemiology’, ‘diagnostic imaging’, and ‘physiopathology’. We ranked articles based on their relevance and methodology. All abstracts were screened for relevance. The latest search was conducted in May 2021. Studies with a diagnosis based solely on abnormal liver enzymes were excluded. No other restrictions to type of diagnostic method were applied. All articles had to have a clear description of exclusion of patients with secondary causes of fatty liver disease to be included in the article database, in accordance with the definition of NAFLD. Language was restricted to English, articles written in other languages but with English translation were also included. Second, reference lists of relevant articles were searched for additional articles.
Pathogenesis of NAFLD in T1D
The pathogenesis of NAFLD is multifactorial, with multiple hits contributing sequentially and/or in parallel to the development of a fatty liver and steatohepatitis. 33 Fat accumulation in the liver occurs when the rate of hepatic lipogenesis due to increased hepatic free fatty acid (FFA) uptake and triglyceride synthesis exceeds the rate of triglyceride oxidation or efflux as very-low density lipoproteins (VLDLs). 34 Factors that may contribute to a fatty liver in T1D include ( 1 ) Acquired hepatic and peripheral IR, ( 2 ) hyperglycaemia-induced activation and upregulation of transcription factors that regulate intrahepatic lipid handling, ( 3 ) altered kinetics of insulin delivery to the liver, ( 4 ) lipoprotein abnormalities, and ( 5 ) nutritional factors5,35–43 (Figure 1). Genetic polymorphisms and alterations in gut microbial composition and functions have also been associated with NAFLD pathogenesis, but are unexplored so far in patients with T1D.
IR is often mentioned as the first hit in the pathogenesis of NAFLD, at least in the classical phenotype of metabolic syndrome-associated NAFLD, directly by increasing de novo lipogenesis and indirectly by increasing FFA flux to the liver via decreased peripheral inhibition of lipolysis. 44 Hepatic IR can be induced by several mechanisms that interfere with the insulin signalling cascade including hyperglycaemia, high concentrations of FFA, oxidative and endoplasmic reticulum stress, systemic and cellular inflammation [resulting in nuclear factor-kappa B (NF-KB) and c-Jun N-terminal kinase (JNK) pathway activation which inhibit phosphorylation of insulin receptor substrate 1 (IRS-1)], and genetic factors.
Hyperglycaemia induces IR via different pathways including the hexaminose pathway, protein kinase C pathway, sorbitol pathway, and accumulation of advanced glycation end products and oxidative stress–driven pathways.45,46 Furthermore, hyperglycaemia has been shown to increase both sterol regulatory element-binding proteins (SREBPs) and GLUT2 expression in hepatocytes. SREBPs are transcription factors that activate the expression of multiple genes dedicated to the synthesis and uptake of cholesterol, fatty acids, triglycerides, and phospholipids. 47 In the presence of high glucose levels, and independent of insulin, SREBPs such as SREBP-1c and carbohydrate-responsive element-binding protein (ChREBP) upregulate the expression of multiple lipogenic genes.37,48 Therefore, SREBPs and ChREBP may contribute to fatty liver development in T1D. 35 GLUT2 is a glucose transporter found primarily in the liver and β-cells. Several studies have demonstrated that liver GLUT2 expression is upregulated according to glycaemia and downregulated by insulin. 49 Furthermore, SREBP-1c mediates glucose-stimulated upregulation of GLUT2 gene expression. 36 Insulin decreases hepatic gluconeogenesis by suppressing gene expression of the key gluconeogenic enzymes phosphoenolpyruvate carboxykinase and glucose-6-phosphatase. 50 Insulin stimulates glycogenesis in the liver by activating glycogen synthetase. 51 If more glucose is taken up and/or produced by the hepatocytes than can be converted to glycogen, this additional glucose is moved towards pathways leading to synthesis of fatty acids. Thus, both hyperglycaemia and hypoinsulinaemia, which may characterize poorly-controlled T1D, may potentiate multiple pathways promoting sugar into fat conversion and lipid synthesis. 35
It is important to highlight the paradoxical increase in hepatic lipogenesis, since one would expect hepatic IR to promote hyperglycaemia, due to continuous gluconeogenesis, along with inhibition of lipogenesis. However, as outlined before, several other mechanisms can lead to increased lipogenesis in hepatocytes. 52 Furthermore, peripheral IR also needs to be taken into account, the latter leading to an increase in FFA flux from the periphery to the liver. In this regard, adipose tissue IR, mostly in relation to overweight, creating metabolically unhealthy fat depots, is increasingly considered to be relevant in T1D. 53 Adipose tissue inflammation is known to contribute to the progression of NAFLD, leading to the development of steatohepatitis and fibrosis, and its contribution to NAFLD in T1D warrants further study.54,55
Lipoprotein abnormalities are present in patients with T1D with poor metabolic control or acquired nephropathy. These abnormalities include, among others, increased serum triglycerides, increased cholesterol-to-triglyceride ratios within VLDLs, an increase in small, dense low-density lipoprotein particles and other qualitative changes in lipoproteins likely impairing their function. 43 These lipoprotein derangements are associated with hyperglycaemia and peripheral hyperinsulinaemia and could therefore contribute to hepatic fat accumulation in T1D.35,43
One potentially crucial difference between T1D and T2D is the portal concentration of insulin and its fluctuations over time. In T1D, insulin is delivered peripherally by means of subcutaneous insulin administration. This is substantially different from physiological insulin delivery directly into the portal circulation where 50–80% of insulin is subsequently cleared by the liver (first passage effect). 56 This altered exposure of hepatocytes to insulin concentrations might considerably change the rate of intrahepatic fat deposition. Wanless et al. compared liver histology of 11 patients with T1D who had received intraperitoneal insulin during peritoneal dialysis to controls not receiving intraperitoneal insulin during dialysis. Steatosis occurred in 10 out of 11 patients treated with intraperitoneal insulin compared to 0 out of 9 control patients. Mainly the subcapsular hepatocytes developed steatosis, supposedly be due to their proximity to the high concentrations of glucose and insulin in the peritoneal dialysate, stressing the steatogenic role of hyperinsulinaemia. 57 The primary cellular mechanism for hepatic uptake and degradation of insulin is receptor-mediated and is altered by IR.58,59 Interestingly, pinocytosis, which is a nonreceptor mediated uptake of insulin by hepatocytes, may be significantly upscaled in hyperinsulinaemia. 60 Hyperinsulinaemia will therefore regulate its own degradation, but not when IR is present. In normal conditions, insulin release in the portal vein is pulsatile, which is lowered in T2D, but completely absent in T1D. This loss of pulsatile action is known to alter insulin action in the liver, however, its direct effects on liver steatosis are not yet examined.38,61 The kinetics of insulin delivery may hence be a key factor leading to steatosis, but this also needs further study. This idea is strengthened by the differences seen in NAFLD prevalence between insulin-dependent and insulin-naïve T2D patients, the latter being higher compared to the first. 62
Aside from the molecular basis for NAFLD, special attention should be given to lifestyle factors. Sedentarism is an important risk factor for metabolic syndrome, and exercise is crucial for patients with T1D to ameliorate insulin sensitivity, obtain glycaemic control and keep a healthy weight.63,64 However, glycaemia remains difficult to control during exercise, and therefore many persons with T1D are reluctant to perform prolonged physical activity, mainly because of fear of hypoglycaemia. 63 A healthy diet is essential in the treatment of diabetes. Patients must try to avoid excessive intake of carbohydrates and fat to control their blood sugar, lipid profile and weight. 65
Another difference between T1D and T2D is that people with T1D are more prone to hypoglycaemia. Hypoglycaemia needs to be treated by intake of fast-acting carbohydrates such as glucose, dextrose and/or fructose. Fructose is a simple sugar that is present in fruit and honey but is also a major component of the two most commonly used sweeteners, namely sucrose (table sugar, a disaccharide of fructose and glucose), and high-fructose corn syrup (a mixture of fructose and glucose monosaccharides). Dietary fructose, sucrose, and high-fructose corn syrup have been shown to have a particular tendency to induce fatty liver.39–41 Further investigation of the independent role of dietary-induced fatty liver disease, specifically in patients with T1D patients, is therefore needed.
In addition, due to ‘defensive snacking’ in order to avoid possible impending hypoglycaemia, weight gain can occur, leading to higher insulin demands, thereby possibly increasing the risk of hypoglycaemia and thus initiating a vicious cycle. 23 In the DCCT trial, patients with intensive insulin therapy had a 33% increased risk of being overweight, and their mean weight gain was 4.6 kg more compared to people with T1D treated by conventional insulin therapy. 66
Diagnostic modalities of NAFLD and their application in T1D cohorts
The presence of liver steatosis in ⩾5% of hepatocytes is a conditio sine qua non for the diagnosis of NAFLD. 67 Liver histology remains the gold standard to assess and grade the presence of steatosis (S1 or mild steatosis = 5–33% fat content, S2 or moderate steatosis = 33–66%, S3 or severe steatosis >66%), inflammation (ballooning and influx of inflammatory cells), and/or fibrosis [ranging, according to the most widely used staging system, from no fibrosis (F0) to minimal (F1) or significant fibrosis (F2–F3) to cirrhosis (F4)], but a biopsy is invasive and not suited for epidemiological studies.1,68,69 Multiple noninvasive tools have been developed to aid in the differentiation, but to date there is no accepted method to diagnose or grade NAFLD/NASH other than biopsy.1,68,69 Nevertheless, all guidelines recommend stratification using noninvasive tools first, and biopsy when NASH or advanced fibrosis are likely present,1,68 or when co-existing liver disease cannot be ruled out. 69
In this section, we describe the most commonly used noninvasive imaging studies in NAFLD and T1D. Computed tomography (CT) can also be used to evaluate liver fat content but has not been thoroughly validated and not recommended in any guideline, also due to radiation burden and its inferiority as compared to MRI, and as no studies on patients with T1D used CT, we will not discuss CT in more detail.
Ultrasound
Ultrasound allows to estimate the degree of fat infiltration based on echogenicity of the liver compared to the kidney parenchyma, echo beam attenuation, and loss of periportal signalling. Furthermore, it provides additional information about liver tissue integrity, biliary structures, and features of cirrhosis. It has adequate overall sensitivity to detect moderate to severe steatosis (sensitivity 84.8%, specificity 93.6%), but lacks accuracy for mild steatosis (sensitivity 61–65%) compared to histology or other imaging techniques.70–72 However, it goes without quantitative reporting. Other ultrasound-based techniques include the hepatorenal steatosis index (HSI) and Hamaguchi score, but they lack general validation. 73 Assessment of NAFLD by ultrasonography has substantial inter-observer variability and reproducibility of results is limited.74,75 Nevertheless, ultrasound is widely available, cheap, and has adequate diagnostic accuracy, and is therefore recommended (A1) as first-line diagnostic procedure in the European guideline. 1 Ultrasound is also the most commonly used method in studies in T1D cohorts. 24 However, in addition to the above-mentioned shortcomings, it is possible that ultrasound is less accurate in T1D patients than in the general population due to the presence of glycogen disturbances.76,77 More specifically, glycogenic hepatopathy, a rare condition seen in badly controlled T1D, can mimic steatosis on ultrasound since it presents with ultrasonographic hyperechogenicity resembling NAFLD.76,77 However, glycogenic hepatopathy is often accompanied by mildly to robustly elevated liver enzymes and distinct hepatomegaly, which is not commonly seen in simple steatosis. 78 Because the few data on glycogenic hepatopathy originate from case series, it is uncertain whether this condition is a mimicker of NAFLD or a confounder. Furthermore, the presence of glycogenic hepatopathy does not rule out the co-presence of NAFLD. Diagnosis is made histologically, which implies there are no reliable data available on its prevalence in T1D patients. Because of the potential for progressive liver disease and CVD in NAFLD, it is crucial to distinguish NAFLD from glycogenic hepatopathy which is generally considered a more benign and reversible condition. MRI studies could aid in the differentiation between NAFLD and glycogenic hepatopathy due to a more accurate image of steatosis on MRI (vide infra). Therefore, cross-validation of ultrasound versus MRI are needed in T1D-NAFLD studies.
Transient elastography
The most commonly used noninvasive tool to assess fibrosis is transient elastography (TE), as liver stiffness correlates with the severity of the fibrosis. Similar to magnetic resonance elastography (MRE), it utilizes ultrasound wave propagation through the liver to evaluate liver stiffness. The faster the shear wave propagates, the stiffer (and thus potentially more fibrotic) the liver is. The benefit of TE over biopsy, besides its noninvasive character, is the approximately 100 times larger sample area. 79 TE is most commonly performed using Fibroscan® (Echosens, Paris, France), which allows to simultaneously evaluate liver fat content using the controlled attenuation parameter (CAP). The Fibroscan® commonly features two probes, M and XL, to evaluate both liver stiffness and CAP, with the choice of the probe based on the skin-to-liver capsule distance (⩽25 mm for the M probe or >25 mm for the XL probe). A third probe, the S probe is used for paediatric patients, with a preferred measurement depth of 15 to 50 mm. To evaluate NAFLD in lean people studies using the S probe could be helpful, but none have been performed to date in a T1D population.
In contrast to MRE, TE is affected by body composition, inflammation, congestion, and cholestasis. 80 The diagnostic accuracies of the M and XL probes are reported to be similar. 81 TE has excellent accuracy for the detection of advanced fibrosis (sensitivity ranging 85–92% for F3 to F4), but moderate accuracy for F2 (sensitivity 79%). It is superior to prediction scores but strictu sensu inferior to MRE. However, when taking practical considerations into account, TE is the preferred first-line noninvasive tool to assess fibrosis.82–84 It is level A2 recommended in the European guideline. 1 A level B2 recommendation was also made to combine both TE and scores in the decision-making, but more studies are needed to evaluate this additional benefit. 85
A few studies have used TE in T1D cohorts. De Lédighen et al. cross-sectionally screened in a mixed diabetes cohort of 277 hospitalized patients (52% with T1D) and found a very low prevalence of hepatic fibrosis in T1D (2.1%). 86 An Egyptian study in 100 paediatric T1D patients found that liver stiffness was higher in those with abnormal liver ultrasound, but this was not always due to NAFLD. 87 A third study screened T1D patient with the FIB-4 scores and performed elastography when the score was intermediary or elevated. Of those patients (29% of patients), only 18 appeared for Fibroscan®. Of those 18 patients, only 2 had elevated liver stiffness. 88
Score systems
To allow routine screening for NAFLD several markers and risk scores have been developed. The fatty liver index (FLI) and hepatic steatosis index (HSI) are based on biochemical and anthropometrical data such as aspartate transaminase (AST), alanine transaminase (ALT), gamma-glutamyl transferase (gGT), triglycerides (TG), BMI, and waist circumference and have demonstrated good performance to screen for hepatic steatosis in several populations, but in patients with obesity and T2D, the clinical accuracy of HSI and FLI is variable. 1 However, little is known about the diagnostic value of these risk scores in people with T1D. In a small Latvian study examining 40 patients with T1D with MRS, the area under the receiver-operator curve for FLI (⩾60) was 0.86 and for HSI (⩾36) was 0.75. 89 Many factors may contribute to variable diagnostic efficacy of these risk scores including ethnicity, comorbidities, and mainly modality to diagnose hepatic steatosis. Important to note is that triglycerides can be high in case of metabolic dysregulation and hypoinsulinaemia in T1D, thereby influencing the score.
There is paucity of data on the use of hepatic fibrosis markers such as the FIB-4 or NAFLD Fibrosis Score (NFS) to identify liver fibrosis in a T1D population. In a retrospective chart analysis of 4,899 patients with T1D (87% Caucasian and 67% overweight or obese), Singh et al. studied the estimated prevalence of NAFLD using the HSI (and also that of advanced fibrosis using appropriate fibrosis scores such as the NAFLD Fibrosis Score (NFS), the Fibrosis-4 (FIB-4) index, AST-to-platelet ratio index (APRI) and AST/ALT ratio). NAFLD based on HSI >36 was present in 71.3% of patients and advanced fibrosis was present in 20.3% based on NFS >0.676, 6.7% based on FIB-4 >2.67, 2.1% based on APRI >1.5% and 22.1% based on AST/ALT >1.4%. 90 Despite the high prevalence of NAFLD based on HSI in this study, the mean AST and ALT were within normal limits, suggesting that normal liver enzymes do not exclude fatty liver. However, these scores were not tested/validated against ultrasound or MR. Furthermore, the wide variations in the percentages among different scores indicate the need for further validation of these scores in a T1D population. Finally, many risk scores include the absence/presence of diabetes, thereby inducing bias and risk of overestimation (see Table 1).
Overview of commonly used NAFLD risk scores for steatosis in T1D.

ALT, alanine transferase; AST, aspartate transferase; BMI, body mass index; gGT, gamma-glutamyltransferase; FIB-4, fibrosis-4; FLI, fatty liver index; HSI, hepatic steatosis index; NAFLD, nonalcoholic fatty liver disease; NFS, NAFLD fibrosis score; T1D, type 1 diabetes.
Controlled attenuation parameter (CAPTM)
CAP is an ultrasound-based technique available on the Fibroscan® device which allows evaluation of liver fat content. The CAP measures the attenuation of the ultrasound beam while traversing the liver. The results are given in decibels per metre and range from 100 to 400 dB/m. As mentioned above, the Fibroscan® features an M and XL probe (and an S probe in a paediatric population) to evaluate both liver stiffness and CAP, with the choice of the probe based on the skin-to-liver capsule distance. There are, however, no specific technical parameters recommended by the producers to ensure reliable measurements of CAP. As a consequence, most authors copied the quality criteria recommended for liver stiffness evaluation, which incorporates 10 valid measurements with an IQR/median < 30%. A recent study established that this quality cut-off is accurate in predicting steatosis. 91 A systematic review from 2019 reported that CAP could be a noninvasive substitute for liver biopsy with excellent sensitivity (87%) for mild steatosis but decreasing sensitivity for moderate (85%) and severe (76%) sensitivity, probably partly due to the technical difficulties to obtain valid measures in more obese patients. 92 This partially explains why the inter-observer reproducibility is good (overall concordance correlation coefficient: 0.82, >95% reliability), but lower with the use of the XL probe compared to the M probe.93,94 A meta-analysis including data of 3830 patients with different aetiologies of liver disease concluded that CAP provides an adequate measure of hepatic steatosis but that the CAP value should be corrected for the presence of NAFLD (−10 dB/m), the presence of diabetes (−10 dB/m), and body mass index (BMI; −4.4 dB/m per unit above/below 25 kg/m2 over the range of 20 to 30 kg/m2). 95 A more recent analysis of 2,979 patients with NAFLD reported a similar loss of accuracy with increasing grades of steatosis. Furthermore, this meta-analysis compared CAP with MRI and concluded that MRI was significantly more accurate to diagnose steatosis. 96 A large individual patient data meta-analysis evaluated the use of the XL probe, which is predominantly used in NAFLD patients due to the link with obesity, and concluded that CAP can help in diagnosing steatosis, but cannot adequately grade steatosis. 97 A Canadian meta-analysis compared all meta-analyses and proposed the following cut-off values: 248 dB/m, 268 dB/m, and 280 dB/m, corrected by BMI and presence of co-morbidities, to respectively diagnose S ⩾ 1, S ⩾ 2, and S3. 98 Since the XL probe is a more recent tool as compared to the M probe, the question arises whether the same cut-offs can be used for both probes. Preliminary evidence suggests small differences,35,36 and maybe universal cut-offs can be used. 99 There are no studies exploring cohort-specific cut-offs in T1D to the best of our knowledge. One study explored fibrosis in T1D with Fibroscan® but did not evaluate CAP.
MRI
MRI, either by spectroscopy (MRS) or by proton density fat fraction (MRI-PDFF) is considered as a superior noninvasive method to evaluate liver fat content, as has been demonstrated in studies using liver histology as gold standard.100–105 MR imaging is thus increasingly used in clinical trials focusing on the reduction of liver fat content.106,107 According to international guidelines, there is no indication to solely assess liver steatosis and not evaluate the presence of inflammation or fibrosis.1,68,69 Therefore, MR imaging alone is not guideline-recommended, since it does not give any information on NASH or fibrosis. 68 However, evidence is emerging that liver steatosis, even in the absence of NASH or fibrosis, can be linked to a higher risk of CVD.20,31 Therefore, the role of MRI is likely to become more prominent. A recent meta-analysis evaluated the potential use of MRI to diagnose NASH and concluded good overall diagnostic accuracy (sensitivity ranging from 76.4% to 95.3%, specificity ranging from 62.4% to 84.6%), but more studies are needed to evaluate the clinical applicability. 108 Therefore, for the time being, only histology is recommended to evaluate the presence of NASH and MRI is limited to research or trial purposes. Several studies have used MRI to assess NAFLD in T1D as will be discussed in the following.62,89,109,110 The prevalence of NAFLD is dramatically lower in these studies based on MRI compared to ultrasound studies, which can result from differences in patient characteristics and referral bias, but might also be indicative for a higher false-positive rate in case of ultrasound imaging. 24
MRE
MRE is able to determine liver stiffness through analysis of mechanical waves transmitted through the liver, similar to transient elastography (TE). 111 A pooled analysis comprising 910 patients from 12 studies concluded that MRE has a high accuracy to diagnose and stage fibrosis in patients with NAFLD with the lowest sensitivity for mild fibrosis (0.77%, 9% CI: 0.69–0.83%), and increasing accuracy as fibrosis stage inclines. MRE has an important advantage over TE because it is not influenced by BMI nor inflammation and allows for mapping of the entire liver (so accounting for regional variations in fibrosis severity and hence sampling variability). On the other hand, MRE has a long processing time, a high cost and limited availability of the required software and tools.111,112 To the best of our knowledge, there are no studies assessing liver stiffness in T1D based on MRE so far.
Epidemiology of NAFLD in T1D
The prevalence of NAFLD has been described in one meta-analysis including 20 studies conducted between 2009 and 2019 involving 3,901 patients, both children and adults with T1D. 24 Thirteen studies used ultrasound including 3054 patients, four used MRI including 394 patients, two used a combination of risk scores and transient elastography including 396 patients, and only one study used histology to diagnose NAFLD in 57 individuals with T1D. Most studies included in the meta-analysis defined NAFLD by the presence of steatosis, while only two studies looked at fibrosis. The pooled prevalence was 19.3% (95% CI: 12.3–27.5%) but there was a very high level of heterogeneity, depending mostly on the age of the patients and the diagnostic modality. The prevalence rate was highest in ultrasound studies (27.1%, 95% CI: 18.7–36.3%), lower in MRI studies (8.6%, 95% CI: 2.1–18.6%) and lowest in the two studies combining risk scores with transient elastography (2.3%, 95% CI: 0.6–4.8%). The biopsy study reported a prevalence of 19.4% (95% CI: 10.0–30.7%) in 57 individuals with T1D, but this number needs to be interpreted with caution because of potential selection bias.
Since no age- and/or BMI-matched group exists, and differences in ethnicities also play a role, no direct comparisons can be made to other populations. In a meta-analysis of 45 studies including 55,936 lean/nonobese patients, the pooled prevalence of NALFD was 10.2% (95% CI: 7.6–13.6%) and 15.7% (95% CI: 12.5–19.6%) in lean or nonobese individuals, respectively. 113 Compared with Western studies, the NAFLD prevalence in the lean or nonobese population was lower in Eastern studies. Furthermore, the prevalence rates reported differ greatly depending on the diagnostic modality used. Only one study compared the MRI-based prevalence of NALFD between patients with T1D and age- and BMI-matched individuals without diabetes and concluded that T1D is not associated with an increased prevalence of NALFD (4.7% in T1D versus 13.4% in matched controls). 109 Although most studies included in the meta-analysis adjusted for BMI or obesity or waist circumference as well as for age, it is possible that other unidentified factors might explain the different prevalence rates of steatosis. It is also important to note that the haemoglobin A1c (HbA1c) values reported in all studies ranged from 60 to 115 mmol/mol (or 7.6% to 12.7%), which exceeds target HbA1c and is on average above the mean HbA1c observed in recent T1D epidemiological reports.114,115 A higher HbA1c has been observed in individuals with compared to those without NAFLD (mean difference of 2.7 mmol/mol (95% CI: 1.4–4.0 mmol/mol). 24 Metabolic control is highly dependent on patient education, motivation, socioeconomic status, and access to healthcare services.116,117 Therefore, it is important to collect data on NAFLD in people with T1D with different levels of metabolic control.
When it comes to NASH, evidence is scarce. Only Harman et al. assessed the presence of NASH in 49 patients by retrospectively assessing liver biopsies and yielded a prevalence of 20.4%. 118 However, liver biopsy studies are prone to selection bias including only patients with a high suspicion (e.g. substantially elevated liver tests), thereby most likely inducing overestimation. Histologically proven significant fibrosis was never reported in studies of T1D patients. Unpublished results from our own study group obtained in 407 consecutively screened T1D patients without preselection showed indeed a low prevalence of significant fibrosis on TE (3.7%).
Risk scores for fibrosis are highly discrepant compared to each other in T1D, as demonstrated by Singh et al. 90 Since the NFS gives additional weight to the presence of diabetes, it is confounded in T1D patients and therefore the results are generally higher compared to the FIB-4. Indeed, the FIB-4 score estimates the presence of significant fibrosis based on clinico-biochemical variables that are not substantially influenced by the sole presence of T1D. In our own cohort, no patients had a FIB-4 score >3.25, but 2% of patients had a high risk according to the NFS >0.765 (unpublished data). Finally, there are no data regarding cirrhosis or liver transplantation due to NAFLD in patients with T1D.
NAFLD and cardiovascular risk
Several cross-sectional studies support a link between NAFLD and subclinical manifestations of atherosclerosis in nondiabetic and in T2D patients,119–128 although not all studies confirmed these observations.129,130 Data in T1D are scarce (see Figure 2). In a cross-sectional study of 722 patients with T1D, Zhang et al. observed that individuals with ultrasound-diagnosed NAFLD had a markedly greater carotid intima media thickness and higher frequency of carotid plaques (28.9% versus 16.9%) than those without liver steatosis. Regression analysis revealed that age, NAFLD, and high-sensitive C-reactive protein were independently associated with intima media thickness in all patients. 131

Macrovascular complications in relation to NAFLD in T1D.
Accumulating evidence suggests that NAFLD, especially in its necro-inflammatory form (NASH), is not only a marker of CVD, but also might contribute to its pathogenesis through the systemic release of several pro-inflammatory (e.g. C-reactive protein, interleukin-6, tumour necrosis factor-alpha) and pro-coagulant factors (e.g. plasminogen activator inhibitor-1, fibrinogen, factor VII, factor VIII) from the fatty and/or inflamed liver or through the contribution of NAFLD itself to hepatic and systemic IR, atherogenic dyslipidaemia, and post-prandial lipaemia. 132 The presence of NAFLD has indeed been linked to an increased prevalence of cardiovascular morbidity and mortality in both nondiabetic and T2D individuals. The proportion of deaths due to CVD in patients with NAFLD ranges between 12.7% and 38%. 42 In a recent meta-analysis of 498,501 patients, the presence of NAFLD was associated with an elevated risk of all-cause mortality, but not with an increased risk of death by CVD. 133 Another review by Wu et al. encompassing 164,494 patients concluded that NAFLD was associated with an increased risk of incident and prevalent CVD, but not with overall mortality nor with CVD mortality. 21 A meta-analysis by Targher et al. corroborated this conclusion, but in their analysis of 16 observational studies, the risk of fatal CVD was elevated, and higher with increasing NAFLD severity. 19 The association between the histological severity and the likelihood of CVD was confirmed in the meta-analysis of Wu et al. 21 Within the NAFLD spectrum, the fibrosis stage is the strongest predictor not only of hepatic but also cardiovascular morbidity and mortality. 20 Several factors may confound the results, namely the great heterogeneity between included studies, the presence of different cardiovascular risk factors among patients, the use of different diagnostic criteria to grade NAFLD and CVD, and the study design of several included studies. In summary, the association with CVD is dependent on the number of metabolic comorbidities, the diagnostic modality, and stage of severity of NAFLD. 20
The group of Targher and colleagues examined the association between CVD and ultrasound-diagnosed NAFLD in a cross-sectional study of 202 patients with T1D. 134 CVD was assessed by patient history, chart review, electrocardiogram, and echo-Doppler scanning of carotid and lower limb arteries. When compared to those without steatosis, individuals with NAFLD (n = 111) had a remarkably higher age- and sex-adjusted prevalence of coronary (10.8% versus 1.1%), cerebrovascular (37.3% versus 5.5%), and peripheral arterial (24.5% versus 2.5%) diseases. In logistic regression analysis, NAFLD was associated with prevalent CVD (as composite endpoint) independently of age, sex, diabetes duration, HbA1c, smoking status, systolic blood pressure, low-density lipoprotein cholesterol, high-density lipoprotein cholesterol, triglycerides, and medication use (adjusted odds ratio 7.36, 95% CI: 1.60–34.3). In another study of the group of Targher, examining 343 patients with T1D, individuals with NAFLD (n = 182) had a higher age- and sex-adjusted prevalence of coronary (15.4% versus 1.2%), cerebrovascular (41.4% versus 9.3%) and peripheral arterial (29.7 versus 6.2%) diseases as compared to those without steatosis. 132 NAFLD was associated with a 7.6-fold higher odds ratio of composite CVD independent of age, sex, BMI, family history of CVD, smoking status, physical activity, alcohol consumption, diabetes duration, HbA1c, systolic blood pressure, plasma lipids, estimated glomerular filtration rate, albuminuria, and use of anti-hypertensive, lipid-lowering and anti-platelet drugs. It is important to underline that there was no overlap between the two studies because the patients attended two different diabetes clinics. Targher et al. concluded that because NAFLD was associated with CVD independently of the above-mentioned risk factors, it is possible that NAFLD itself could, at least in part, contribute to accelerated atherogenesis. However, cross-sectional studies cannot prove causality. In a retrospective cohort study of 286 T1D patients, NAFLD was suggested to be an independent predictor of CVD. 31 In comparison with patients without NAFLD, during a mean follow-up period of 5.3 ± 2.1 years, the incidence of composite CVD was 8.16 times higher (95% CI: 1.9–35.1) in patients with NAFLD (17.3% versus 1.5%). The hazard ratio adjusted for age, sex, BMI, smoking, diabetes duration, HbA1c, dyslipidaemia, hypertension, chronic kidney disease, prior ischaemic heart disease and serum gGT levels did not appreciably attenuate the association between NAFLD and incident CVD (HR: 6.73, 95% CI: 1.2–38.1). This study was limited by several factors including the diagnostic modality not being the gold standard, a small number of events, selection bias due to retrospective design and it being a single-centre study, but nonetheless provides a suggestion that NAFLD itself acts as a predictor of incident CVD in T1D. In a Spanish study evaluating 100 T1D individuals for the presence of subclinical atherosclerosis, all patients were also evaluated by liver ultrasound. NAFLD was present in 12% and patients with NAFLD had a greater carotid intima media thickness (CIMT), but no differences were observed in coronary artery calcification score or presence of carotid plaques. Linear regression analysis identified age and BMI as factors independently with CIMT, but not NAFLD. 135
It is important to highlight that all reports of a positive association come from one group of researchers, while the only study that indicates otherwise is from another research group. This emphasizes the need for additional research. The above-mentioned findings nevertheless suggest that the identification of NAFLD in individuals with T1D might help in CVD risk stratification with relevant implications for clinical management. Whether NAFLD is related to cardiovascular mortality in T1D, and treatment of NAFLD would result in a reduction in mortality, has to the best of our knowledge not yet been examined.
NAFLD and chronic kidney disease
Patients with diabetes have an increased risk to develop chronic kidney disease (CKD) mainly caused by the negative effects of hyperglycaemia and arterial hypertension on the glomerulus. Other contributing factors are age and metabolic risk factors but there is no information on the role of NAFLD in the development of CKD in people with T1D. Growing evidence suggests that NAFLD and CKD share common pathogenetic mechanisms (such as increased caloric intake, abdominal obesity, and insulin resistance) and potential therapeutic targets, as reviewed by Musso et al. 136 Special interest must be taken into dietary fructose because it not only increases hepatic de novo lipogenesis but it also increases serum uric acid levels and in case of hyperuricemia the increased urinary excretion of uric acid can lead to CKD. 137 Furthermore, NAFLD per se may affect CKD through hypertension, altered lipoprotein metabolism, and hepatokine secretion, which have pro-inflammatory and procoagulant characteristics. 138 Targeting the renal tubule by sodium–glucose cotransporter 2 inhibitors may hold the potential to improve both CKD and NAFLD. 139 Other drug pipelines for both nephropathy and liver steatosis are summarized in a recent article by Sumida and Yoneda. 140
Cross-sectional studies have documented that NAFLD is associated with an increased prevalence of CKD both in nondiabetic and T2D patients.141–144 In a meta-analysis of nine observational studies with nearly 100,000 individuals of predominantly Asian descent who were followed over a median period of 5.2 years, individuals with NAFLD had a higher risk of incident CKD compared to controls (HR: 1.37, 95% CI: 1.20–1.53). The risk also seemed higher with progressive fibrosis. NAFLD was diagnosed using biochemistry, FLI, or ultrasound. 145 An older meta-analysis, which includes biopsy-proven NAFLD, also provided evidence for the link between NASH or advanced fibrosis and the risk of incident CKD. 136 It is important to highlight that CKD patients have an increased risk of CVD. In light of this knowledge, a study in 1148 CKD patients showed that those with CKD and ultrasound-proven NAFLD had an additional twofold risk of CVD (HR: 2.00, 95% CI: 1.10–3.66). 146
There is paucity of data on the link between NAFLD and CKD in T1D (Figure 3). One retrospective cohort study of 261 T1D patients with preserved kidney function and no macroalbuminuria at baseline evaluated the link between ultrasound-diagnosed NAFLD and incident CKD, defined as estimated glomerular filtration rate (eGFR < 60 mL/min/1.72 m2 and/or macroalbuminuria) after a follow-up period of 5.2 years. 32 During follow-up, 61 patients developed incident CKD. The frequency of a renal functional decline (arbitrarily defined as ⩾25% loss of baseline eGFR) was greater among those with than among those without NAFLD (26% versus 11%, p = 0.005). NAFLD was associated with an increased risk of incident CKD (HR: 2.85, 95% CI: 1.59–5.10). Adjustments for age, sex, duration of diabetes, HbA1c, hypertension, and baseline eGFR did not appreciably attenuate this association (adjusted HR: 2.03, 95% CI: 1.10–3.77). Previously, the same authors observed in a cross-sectional study of 202 patients with T1D that the prevalence of CKD was higher in those with NAFLD (OR: 3.90, 95% CI: 1.5–10.1). 142 These studies have some limitations; NAFLD was diagnosed using ultrasound, number of people developing CKD was small, and selection bias due to retrospective design and single-centre study. Nevertheless, the possible clinical implication of these findings is that T1D patients with NAFLD may benefit from more intensive surveillance or early treatment interventions to decrease the risk for CKD.
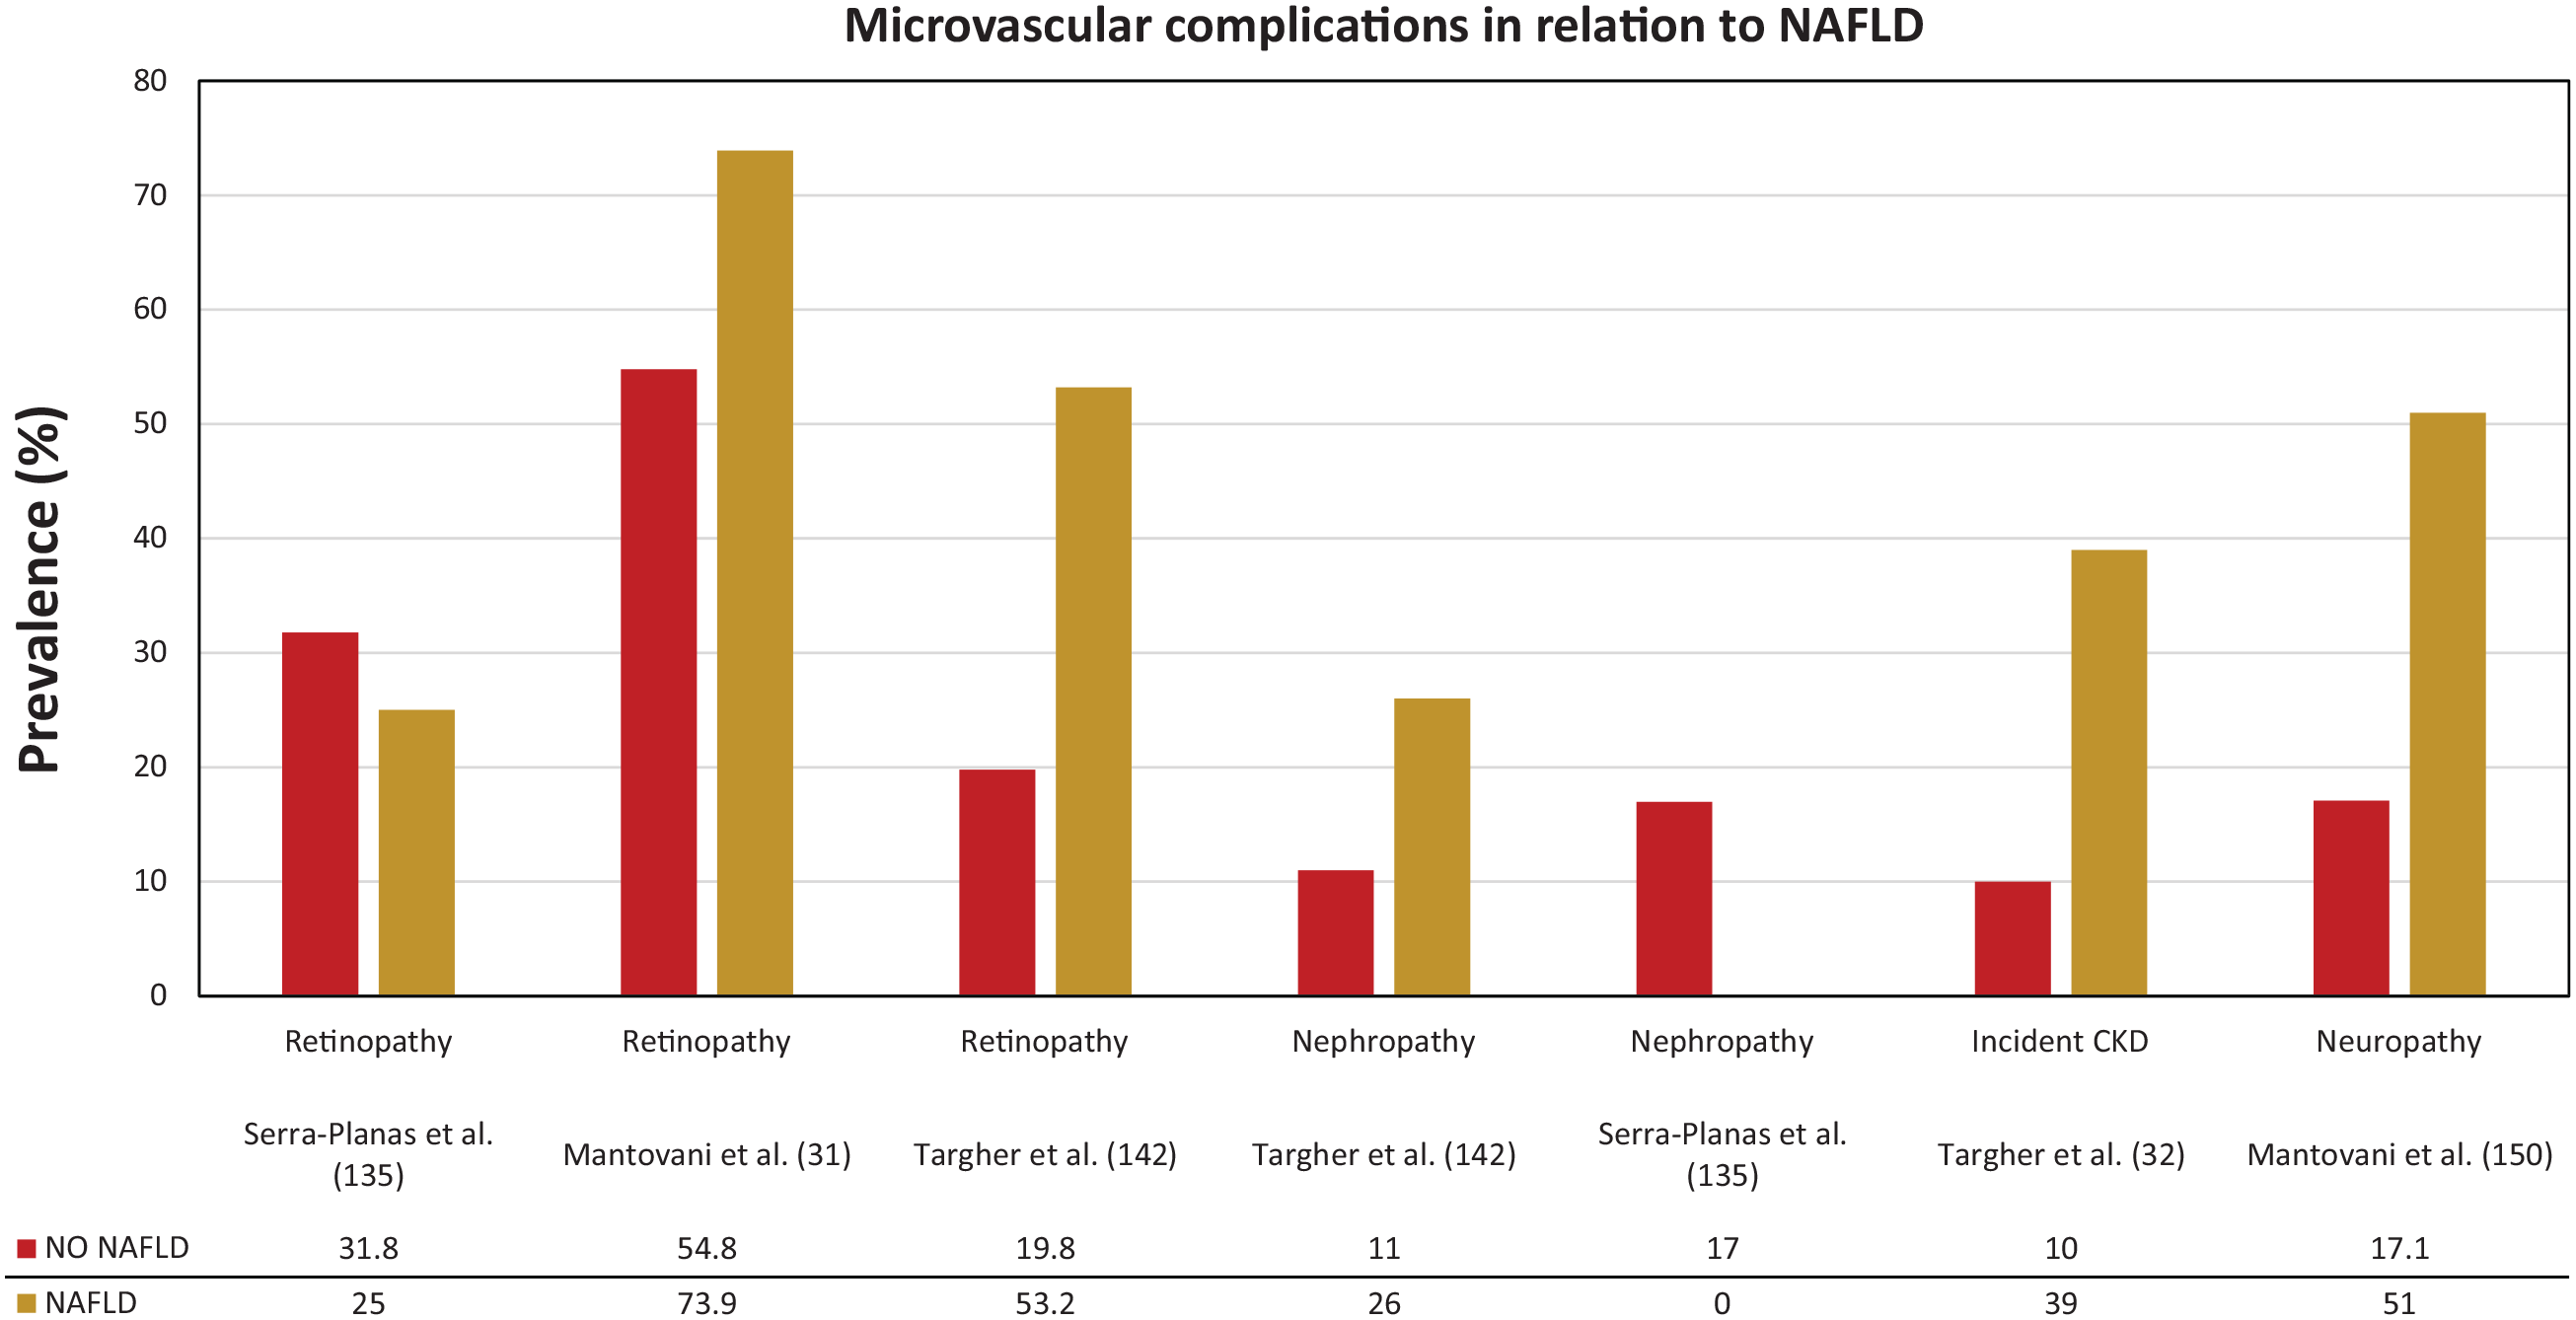
Microvascular complications in relation to NAFLD in T1D.
NAFLD and other microvascular complications
The group of Targher and colleagues also published cross-sectional data on the association between ultrasound-diagnosed NAFLD and diabetic retinopathy (Figure 3). The age- and sex-adjusted prevalence of diabetic retinopathy (53.2% versus 19.8%) was markedly higher in patients with compared to those without NAFLD. In multivariate logistic regression analysis, NAFLD was associated with prevalent retinopathy (adjusted OR: 3.31, 95% CI: 1.4–7.6). These associations were independent of age, sex, diabetes duration, HbA1c, medication use, and presence of the metabolic syndrome. 142
Data on the link between NAFLD and distal symmetric polyneuropathy in people with diabetes are scarce and conflicting. At least one-third of patients with diabetes have diabetic polyneuropathy.147–149 Poor glycaemic control is the strongest risk factor for the development of diabetic peripheral neuropathy, but other factors, namely dyslipidaemia, hypertension, presence of diabetic retinopathy, presence of nephropathy and smoking, may also contribute to the increased risk estimation. Whether NAFLD might also contribute to the presence of diabetic polyneuropathy is not well studied. In a cohort of 286 patients with T1D, the group of Mantovani observed an association between ultrasound-diagnosed NAFLD and the presence of distal symmetric polyneuropathy (detected using the Michigan Neuropathy Screening Instrument and the biothesiometer Vibrotest). 150 Individuals with NAFLD had a higher prevalence of distal symmetric polyneuropathy compared to their counterparts without NAFLD (51.0% versus 17.1%; Figure 3). After adjustment for age, sex, diabetes duration, HbA1c, diabetic retinopathy, smoking, metabolic syndrome, chronic kidney disease, and carotid artery stenoses ⩾40%, this association remained significant (adjusted OR: 2.23, 95% CI: 1.1–4.8).
Conclusion
NAFLD appears to be rather common in T1D but available studies show great heterogeneity, mostly due to differences in diagnostic accuracy of the used noninvasive diagnostics, selection bias due to retrospective study designs, but also other factors such as metabolic control and patient education or additional (yet unidentified) parameters. Further studies are needed that include cross-validation of noninvasive diagnostics in T1D patients and identification of possible additional risk factors for steatosis. T1D is a very heterogeneous disease with some individuals being more prone to develop overweight, obesity, and IR. Longitudinal data from new-onset T1D are essential to clarify the natural history and importance of NAFLD in the cardiometabolic profile of T1D patients. Data from mainly one group of researchers suggest an independent association between NALFD and microvascular (retino-, neuro-, and nephropathy) and macrovascular disease. Evidence is growing that features of IR are increasingly prevalent among patients with T1D, making them vulnerable for NAFLD and NAFLD-associated comorbidities.
Footnotes
Acknowledgements
We would like to thank Kristof Van Dessel for the design of the figures.
Author contributions
J.M. contributed to data curation, formal analysis, methodology, and wrote the manuscript. L.V.G. contributed to conceptualization, provided supervision, and edited the manuscript. S.F. contributed to conceptualization, methodology, provided supervision, and reviewed the manuscript. C.D.B. provided the initial idea, contributed to conceptualization, data curation, formal analysis, methodology, project administration, and edited and reviewed the manuscript.
Conflict of interest statement
The authors declared no potential conflicts of interest with respect to the specific research, authorship, and/or publication of this article.
JM has no conflicts of interest in general. LVG declares to be a member of the advisory board J Mertens, LF Van Gaal et al. journals.sagepub.com/home/tae 15 and/or speakers bureau of Astrazeneca, Boehringer Ingelheim, Eli Lilly, MSD, and Novo Nordisk. SF has a senior clinical research mandate from the Fund for Scientific Research (FWO) Flanders (1802154N) and has acted as adviser and/or lecturer for Roche, Gilead, Abbvie, Bayer, BMS, MSD, Janssen, Actelion, Astellas, Genfit, Inventiva, Intercept, Genentech, Galmed, Promethera, Coherus and NGM Bio. CDB reports consulting fees and honoraria for speaking for Abbott, AstraZeneca, Boehringer Ingelheim, Menarini Diagnostics, Eli Lilly, Medtronic, Novo Nordisk and Roche.
Funding
The authors received no financial support for the research, authorship, and/or publication of this article.
Prior publications
This work was presented in part at the 14th International Conference on Advanced Technologies & Treatments for Diabetes (ATTD), 2–5 June 2021 and the preliminary data discussed in this paper were presented in part at the 56th annual meeting of the European Association for the Study of Diabetes (EASD), 21–25 September 2020.