
Abstract
Background:
Paraoxonase 1 (PON1) and soluble intercellular adhesion molecule-1(sICAM-1) are intricately involved in metabolic syndrome (MetS) and type 2 diabetes mellitus (T2DM) pathophysiology. This study aimed to investigate PON1 and sICAM-1 plasma levels in addition to correlating them with adiposity, atherogenicity and hematological indices in T2DM and MetS.
Methods:
This cross-sectional study composed of 28 healthy lean subjects (control), 29 normoglycemic MetS subjects and 30 MetS-Pre/T2DM.
Results:
The sICAM-1 levels (ng/ml) were markedly higher in the pre/diabetic MetS group (828 ± 250.37 versus controls’ 608.62 ± 184; p < 0.05). Conversely, PON1 levels (mlU/ml) were markedly lower in the pre/diabetic MetS group [252,700 (163,950, 362,800) versus controls’ 394,900 (212,550, 469,350); p < 0.05]. sICAM-1 correlated directly with all adiposity indices [conicity index (CI), waist circumference (WC), waist–hip ratio (WHR) waist-to-height (WHtR) ratio, hip circumference (HC) and body adiposity index (BAI)] in addition to the atherogenicity index of plasma (AIP). PON1 correlated negatively and significantly with CI, WC, WHR, WHtR and HC but directly with lymphocyte. Significantly, a reciprocal sICAM-1–PON1 relationship was observed in the total population (r = −0.262, p = 0.015).
Conclusion:
Utility of sICAM-1 and PON1 as surrogate prognostic biomarkers and putative therapeutic targets in the management of diabetes and MetS is strongly suggested.
Keywords
Introduction
Soluble intercellular adhesion molecule-1 (sICAM-1) represents a circulating form of intercellular adhesion molecule-1 (ICAM-1) that is constitutively expressed on the cell surface of different cell lines. Primarily, ICAM-1 is an adhesive molecule of the immunoglobulin superfamily that is regulated by proinflammatory cytokines. Epidemiologic studies have shown that plasma concentrations of sICAM-1 are elevated in patients with unstable angina and myocardial infarction. 1 Moreover, prospective studies indicate that elevated baseline levels of sICAM-1 are associated with increased risk for future coronary events in healthy individuals and in patients at risk of or with established coronary artery disease. 2 In addition, metabolic syndrome (MetS) components have been linked to endothelial dysfunction molecules. 3 Paraoxonase 1 (PON1) is an extracellular esterase composed of 354 amino acids 4 and located on (high-density lipoprotein-cholesterol ) HDL-C. 5 It has an antioxidative function that acts as a good barrier against oxidized (low-density lipoprotein-cholesterol) LDL-C as well as hydrogen peroxide; 6 thus, HDL-C anti-atherogenic and anti-inflammatory properties can be attributed, at least partially, to PON1 function, and apparently, a significant decrease in PON1 activity has been shown in diseases with accelerated atherogenesis such as familial hypercholesterolemia, 7 diabetes mellitus, 8 advancing age and smoking.9,10 In general, abdominal obesity in addition to total body fat distribution can be practically estimated through simple calculations using the basic anthropometric measurement. These adiposity indices are waist circumference (WC), waist–hip ratio (WHR), waist–height ratio (WHtR), conicity index (CI) and body adiposity index (BAI). Interestingly, they can be utilized to identify the possible risk of having coronary heart diseases in diabetic patients. 11 In addition to adiposity indices, atherogenicity indices or lipid ratios such as atherogenicity index of plasma (AIP), total cholesterol-to-HDL-C (TC/HDL-C) ratio and HDL-C-to-LDL-C (LDL-C/HDL-C) ratio are simple inexpensive parameters that can predict cardiovascular complications in diabetic populations.12,13 In addition, hematological indices – namely mean platelet volume (MPV), red distribution width (RDW), monocyte-to-lymphocyte ratio (MLR), neutrophil-to-lymphocyte ratio (NLR) and platelet-to-lymphocyte ratio (PLR) – can reflect the general inflammatory status of the body as well as being useful indicators of vascular complications and glycemic control in type 2 diabetes mellitus (T2DM) patients. 14
This study aims to investigate the association of sICAM-1 and PON-1 plasma levels in both non-diabetic MetS and newly diagnosed drug naïve pre/T2DM MetS patients versus healthy lean controls, in addition to evaluating possible correlations between the biomarkers and hematological, atherogenic and adiposity markers in the same study population.
Participants, materials and methods
Study design and clinical setting
A cross-sectional study was implemented in the diabetes and endocrinology outpatient clinics and blood bank in the Jordan University Hospital (JUH) after obtaining approval from the scientific research committee at the School of Pharmacy at the University of Jordan and the JUH Institutional Review Board. Informed consent was obtained from each participant. Eligible patients were approached and assessed according to our inclusion and exclusion criteria. The study was composed of three comparative arms: the control arm of 28 healthy, lean [body mass index (BMI < 25 kg/m2)] and non-diabetic participants; the MetS arm of 29 patients who were defined according to the IDF definition of MetS; 15 and the pre-diabetic/T2DM MetS arm of 30 pre-diabetic or newly diagnosed drug naïve T2DM patients who were defined according to the American Diabetes Association (ADA) and International Diabetes Federation (IDF)F definitions of T2DM and MetS respectively.15,16 Patients who met our exclusion criteria included:
patients with autoimmune or life-threatening disease, alcohol/drug abuse, recently diagnosed and untreated endocrine disorder;
patients with inflammatory diseases such as the inflammatory bowel disease;
any prior treatment with anti-diabetic agents;
obesity secondary to endocrine derangement other than DM;
ages under 18 years or over 75 years.
Sample size calculation
Sample size was calculated using G*power® 3.0.10 using the F-tests, ANOVA: fixed effects, omnibus, one way option. The sample was based on extrapolation from a study of Aburawi and colleagues. 17 The study compared sICAM-1 levels between two groups of T2DM (n = 55) and non-diabetic controls (n = 47). The difference between the two study arms was 97 ng/ml with pooled SD of 84. To achieve a statistically significant difference in sICAM-1 levels between groups, 26 patients/group were required at α = 5% and power (1-beta) = 0.8.
Data collection
Data collection of candidates began in June 2016 and was completed by the end of December 2016. Blood samples were collected after 10–12 h fasting for biochemistry and biomarker analysis. Both biomarkers were analyzed using sandwich

Statistical analysis
All data were coded, entered and analyzed using SPSS© 22 (SPSS, Inc.,Chicago Illinois, USA). A Chi-square test was used to compare categorical variables among the groups. For continuous variables, comparison between study groups was conducted by an ANCOVA (analysis of covariance) test using age as a covariate. Spearman correlation was used to assess the relationship between continuous variables. All the differences were considered to be significant if the p value was <0.05.
Results
Demographic and clinical characteristics
Gender, but not age, was homogeneously distributed among the study arms, as shown in Table 1. Females constituted 52.8% while men constituted 47.2% of the study population. All the studied adiposity indices, AIP (p < 0.001) and MPV (p < 0.05) were significantly elevated in both MetS groups. PLR displayed higher levels in the pre-diabetic/diabetic MetS group compared to the non-diabetic MetS group (p < 0.05) (Table 2).
Comparison of clinical characteristics, metabolic biomarkers, adiposity, atherogenicity and hematological indices between study groups.
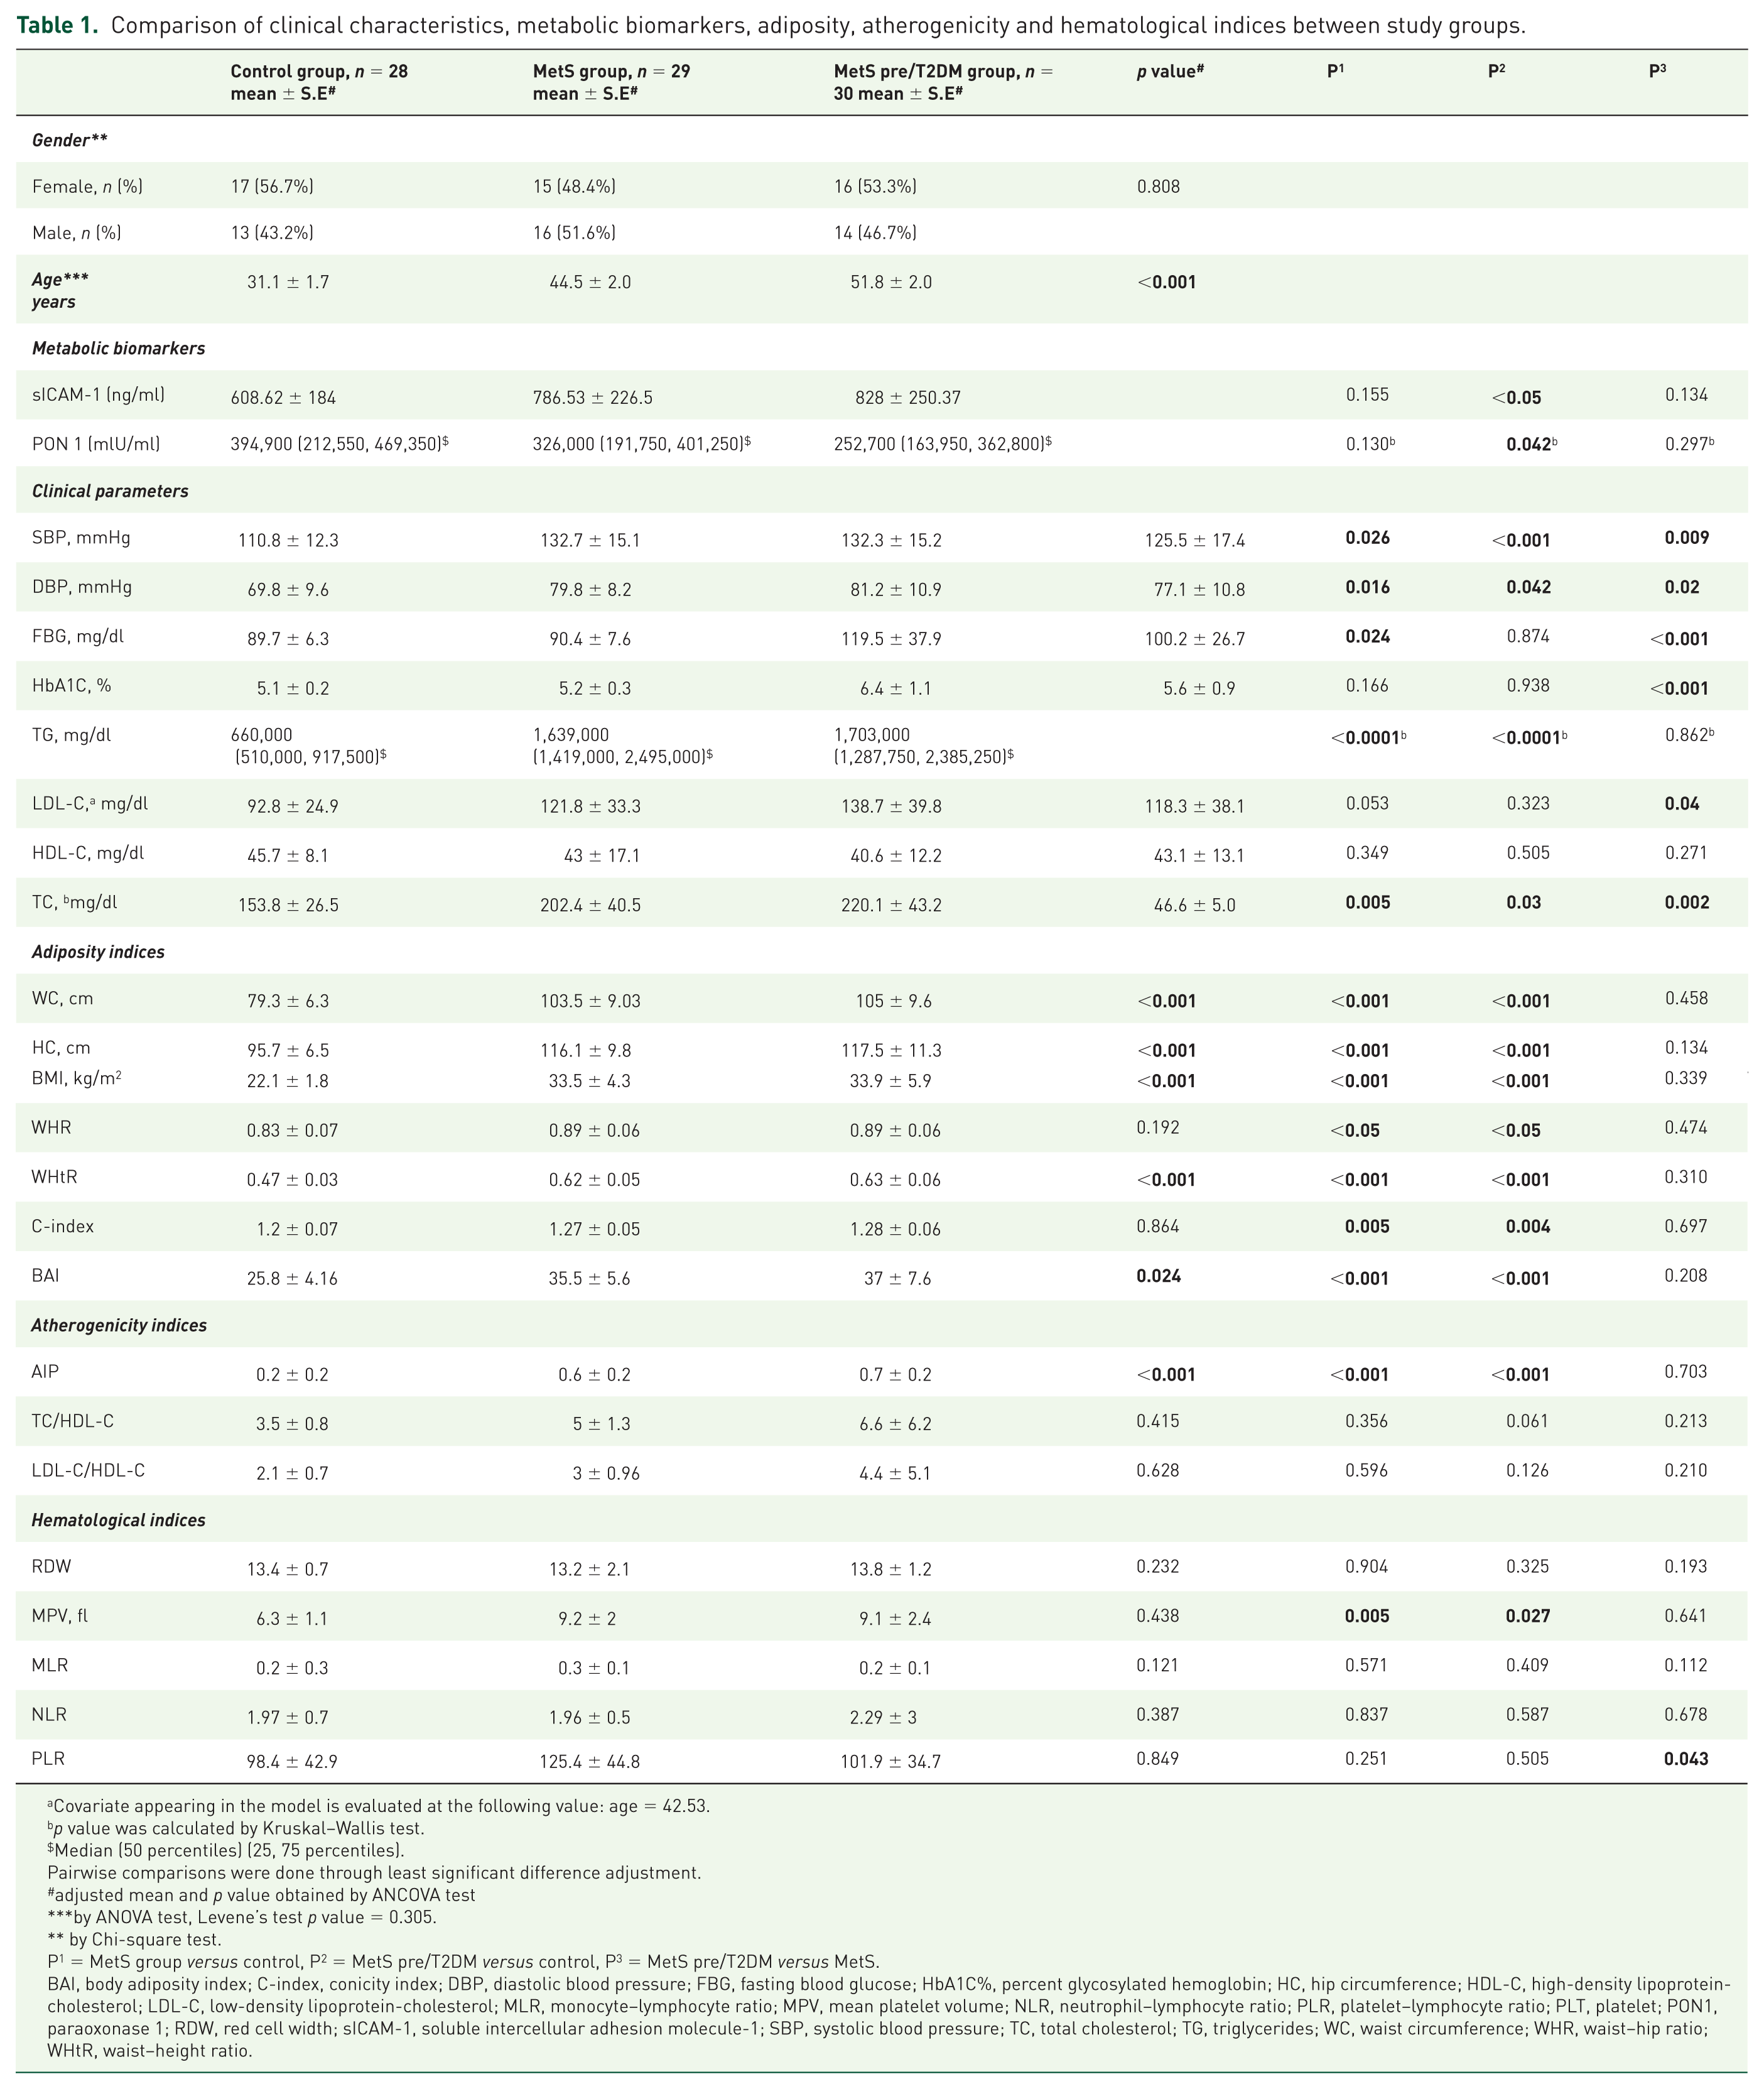
Covariate appearing in the model is evaluated at the following value: age = 42.53.
p value was calculated by Kruskal–Wallis test.
Median (50 percentiles) (25, 75 percentiles).
Pairwise comparisons were done through least significant difference adjustment.
adjusted mean and p value obtained by ANCOVA test
by ANOVA test, Levene’s test p value = 0.305.
by Chi-square test.
P1 = MetS group versus control, P2 = MetS pre/T2DM versus control, P3 = MetS pre/T2DM versus MetS.
BAI, body adiposity index; C-index, conicity index; DBP, diastolic blood pressure; FBG, fasting blood glucose; HbA1C%, percent glycosylated hemoglobin; HC, hip circumference; HDL-C, high-density lipoprotein-cholesterol; LDL-C, low-density lipoprotein-cholesterol; MLR, monocyte–lymphocyte ratio; MPV, mean platelet volume; NLR, neutrophil–lymphocyte ratio; PLR, platelet–lymphocyte ratio; PLT, platelet; PON1, paraoxonase 1; RDW, red cell width; sICAM-1, soluble intercellular adhesion molecule-1; SBP, systolic blood pressure; TC, total cholesterol; TG, triglycerides; WC, waist circumference; WHR, waist–hip ratio; WHtR, waist–height ratio.
sICAM-1 and PON1 correlations.

rs*, Pearson correlation; rs$, Spearman correlation.
BAI, body adiposity index; C-index, conicity index; DPB, diastolic blood pressure; FBG, fasting blood glucose; HbA1C%, percent glycosylated hemoglobin; HC, hip circumference; HDL-C, high-density lipoprotein-cholesterol; LDL-C, low-density lipoprotein-cholesterol; MLR, monocyte–lymphocyte ratio; MPV, mean platelet volume; NLR, neutrophil–lymphocyte ratio; PLR, platelet–lymphocyte ratio; PLT, platelet; PON1, paraoxonase1; RDW, red cell width; sICAM-1, soluble intercellular adhesion molecule-1; SBP, systolic blood pressure; TC, total cholesterol; TG, triglycerides; WC, waist circumference; WHR, waist–hip ratio; WHtR, waist–height ratio.
PON2 and sICAM-1 levels
Substantial discrepancies were detected between the MetS pre/diabetics group versus controls for sICAM-1 (p < 0.05) (Table 1). Conversely, PON1 levels (mlU/ml) were markedly lower in the pre/diabetic MetS group versus controls (p < 0.05) (Table 1).
sICAM-1 and PON1 correlation
sICAM-1 correlated significantly and directly with HbA1c (p = 0.002) and fasting blood glucose (FBG) (p = 0.008). Additionally, a marked significant correlation between sICAM-1 levels and WC (p < 0.001), HC (p = 0.006), WHR (p = 0.004), WHtR (p < 0.001) and AIP (p = 0.017) was reported, but correlated inversely with HDL-C (p = 0.031) (Table 2) in the study population. On the other hand, PON1 was inversely correlated with SBP (systolic blood pressure) (p = 0.045), FBG (p = 0.005), HbA1c (p = 0.016) and triglycerides (TG) (p = 0.002), but directly with HDL-C (p = 0.001) in the study population (Table 2). sICAM
Discussion and conclusion
sICAM-1 levels comparison and correlations
Several studies have confirmed the sICAM-1 findings, although they recruited slightly different study cohorts. sICAM-1 has higher levels in the medicated diabetic population, irrespective of whether the patient has T1DM or T2DM, 17 in addition to the MetS population having cardiovascular disease. 20 Thompson and colleagues’ study is the one with the most similar design; 21 it involved controls, normoglycemic MetS and pre/diabetic MetS patients. MetS patients, either normoglycemic or hyperglycemic, recorded significantly higher sICAM-1 plasma levels in comparison to controls (377.6 ± 89.5 and 325.7 ± 94.7 ng/ml versus 315.3 ± 93.4 ng/ml, p < 0.05).This implies that elevated sICAM-1 levels accompany the metabolic deterioration of normal physiological status. Furthermore, the study addressed some sICAM-1 correlations. Comparable to the studies of Thompson and colleagues 21 and Hsu and colleagues, 20 plasma sICAM-1 correlated directly with FBG and WC but negatively with HDL-C (Table 2). Conversely, in those studies, substantial associations of sICAM-1 with TG, SBP and diastolic blood pressure (DBP) were lacking. These correlations reflect sICAM-1 and obesity crosslinking.
PON1 level comparison and correlations
This study has shown a declining trend in PON1 levels, reporting the lowest levels in the pre/T2DM cohort although insignificant. Several studies agree with this trend.9,22,23,24,25 Additionally, PON1 is associated with MetS components as it is inversely correlated with SBP, FBG, HbA1c and TG, but directly correlated with HDL-C (Table 2), which is in accordance with the study by Göçmen and colleagues, 25 in which HDL-C was associated with the coronary artery disease patient group (r = 0.207, p < 0.05). On the contrary, Saha and colleagues had conflicting findings of direct correlation between TG and PON1 (r = 0.3225, p < 0.01). 26 In our study, PON1 correlated inversely with AIP, which was not reported in any previous study. This can support, at least partially, the anti-atherogenic properties of PON1.
sICAM-1–PON1 correlations
This work marked an inverse correlation between sICAM-1 and PON1. Impressively, Canales and colleagues 27 identified such a correlation (r = −0.471, p < 0.01). Principally, sICAM-1 expression is known to be upregulated by oxidative stress. 28 However, HDL-C has been found to inhibit sICAM-1 expression. 29 The HDL-associated enzyme PON-1 may exert important antioxidant effects. 30 Taking these effects into consideration leads to the conclusion that sICAM-1 and PON1 are negatively correlated. In conclusion, this study’s findings emphasize the sICAM-1–PON1 linkage to MetS pathophysiology through the multiple correlation studies in the Jordanian population. This linkage can be further extended to diabetic disturbances, specifically T2DM.
Briefly, sICAM-1 and PON1 associations with adiposity, hematological and atherogenic indices can direct pharmacological intervention that may slow down the progressive nature of T2DM and MetS. Additionally, drawing on the relationships between these markers can pinpoint them as potential therapeutic targets. As this is a cross-sectional study; no causality relationship could be concluded. It cannot be precisely speculated whether the biomarker itself caused the metabolic disturbances of diabetes and MetS or whether the diabetes and MetS caused the altered levels of the biomarker. For future studies, it is recommended to conduct an observational prospective cohort study to establish a cause–effect relationship. Utility of sICAM-1 and PON1 as surrogate prognostic biomarkers and putative therapeutic targets in the management of diabetes and MetS is strongly suggested.
Footnotes
Acknowledgements
The Deanship of Academic Research and Quality Assurance/The University of Jordan is graciously thanked for supporting this research.
Statement
This manuscript has not been published or submitted elsewhere.
Funding
This research received no specific grant from any funding agency in the public, commercial or not-for-profit sectors.
Conflict of interest statement
The authors declare that there is no conflict of interest.