
Abstract
Background:
Adipose differentiation-related protein (ADRP) is an adipokine. In vitro and animal studies have verified the role of ADRP in lipid metabolism and non-alcoholic fatty liver disease (NAFLD). The aim of this study was to evaluate the interaction between levels of ADRP and NAFLD in type 2 diabetes mellitus (T2DM).
Methods:
Cross-sectional design. A total of 142 patients with T2DM were assigned to NAFLD (Group-I) and non-NAFLD (Group-II). Anthropometric data were collected. Serum ADRP levels and biochemical parameters were also determined. t test or χ2 test was conducted to compare the data between two groups. Receiver operating characteristic (ROC) curve analysis and logistic regression models were used to assess the interaction between ADRP levels and NAFLD in T2DM. Pearson correlation analysis and linear regression model were used to assess the correlations between serum ADRP levels and other parameters.
Results:
The serum ADRP level was higher in Group-I than in Group-II. Further, binary logistic regression models demonstrated that ADRP was an independent risk factor related to NAFLD in patients with T2DM. Moreover, as the ADRP level elevated across its tertiles, the percentage of NAFLD in T2DM increased. Multivariate logistic regression models demonstrated that the odds ratio of NAFLD was 8.831 in the highest tertile of ADRP, after adjustment for potential confounders. Area under THE ROC curve of ADRP for predicting the presence of NAFLD in T2DM was 0.738. Finally, multiple stepwise regression analysis indicated that age, waist circumference (WC), homeostasis model assessment of insulin resistance index (HOMA-IR) and triglyceride (TG) were independent factors associated with ADRP levels.
Conclusion:
High serum ADRP level may be used as an independent risk factor for NAFLD in T2DM. The expression of ADRP may be affected by age, WC, HOMA-IR and TG.
Keywords
Introduction
Non-alcoholic fatty liver disease (NAFLD) is a metabolic disease with a high prevalence worldwide. 1 Unhealthy lifestyles and diets have greatly increased the prevalence of obesity and type 2 diabetes mellitus (T2DM), and both often increase the incidence of NAFLD. The prevalence of NAFLD reaches 30% in adults and 70–80% in the obese and diabetic population of the world. 2 Regionally, NAFLD has become the most common liver disease in China, with a prevalence of 32.9%. 3 It is widely considered that NAFLD is the hepatic manifestation of metabolic syndrome and insulin resistance (IR). 4 T2DM and NAFLD share the same pathogenesis: visceral fat overaccumulation, lipid dysmetabolism, liver lipid accumulation, all leading to IR. IR is the initiator of T2DM and NAFLD. 5 NAFLD is primarily characterized by disordered lipid metabolism. The development of NAFLD is affected by many factors, including adipokine. Adipokine plays an important role in the process of lipid metabolism, energy expenditure, insulin sensitivity, inflammation and glucose homeostasis.6,7 Although intensive studies have been conducted, the pathogenesis of NAFLD is not fully understood.
It has been found that adipose differentiation-related protein [(ADRP) Adipophilin, Plin2) is a kind of adipokine, which is mainly expressed in adipose tissue and skeletal muscle in both rodents and humans. The expression level of this protein correlates positively with lipid droplet content. 8 ADRP is a sensitive marker for early differentiation of adipocytes and storage of lipids. 9 Studies have found that ADRP can increase the accumulation of lipids in islet cells, fat cells and muscle cells, and distort insulin secretion and resistance.10,11 Animal studies have verified that ADRP overexpression leads to triglyceride (TG) overaccumulation (a hallmark of NAFLD) in liver cells. 12 Deficient ADRP expression hinders the lipid accumulation at the liver, thus preventing hepatic steatosis. 13 In HepG2 cells, overexpressed ADRP could promote the formation of lipid droplets, resulting in lipid accumulation in liver tissues. 14 Previously, ADRP was mainly profiled with in vitro and animal studies. However, to our knowledge, no study has been carried out to clarify the link between serum ADRP level and NAFLD in patients with T2DM, which is the objective of the present cross-sectional study.
Subjects and methods
Subjects
This research included 142 patients with T2DM (81 males, 61 females) hospitalized by the Department of Endocrinology and Metabolism at the First Hospital Affiliated of Soochow University, from January to October 2016. Informed written consent was obtained from all patients and ethical approval was obtained from Medical Ethics Committee of the First Affiliated Hospital of Soochow University (Ethics approval number 2016012). This research complied with the Declaration of Helsinki to protect the health and rights of the participants. T2DM was defined in line with the criteria recommended by American Diabetes Association in 2014. 15 Abdominal ultrasonography was performed in all the participants. NAFLD was diagnosed based on the ultrasonic manifestation. 16 Liver presenting the same parenchyma echogenicity as the kidney cortex was defined as normal liver. Steatosis was defined as hyper-echogenic liver with fine, tightly packed echoes. The patients were divided into T2DM with NAFLD (Group-I, n = 72) and T2DM with non-NAFLD (Group-II, n = 70). The exclusion criteria were as follows: T1DM, T2DM with acute complications, severe cardiovascular and cerebrovascular diseases, renal dysfunction, chronic or acute inflammatory diseases, tumor, pregnancy, familial hyperlipidemia, viral hepatitis, drug-induced liver disease, autoimmune hepatitis, use of lipid-lowering drugs or thiazolidinediones in the previous one month and excessive alcohol consumption (men: more than 140 g per week; women: more than 70 g per week 17 ).
Anthropometric measurement
Anthropometric data were collected by appointed nurses. Body weight (accuracy 0.1 kg) and height (accuracy 0.01 m) were measured with the subjects wearing only light indoor clothing and no shoes. Body mass index (BMI) was calculated as weight (kg)/height squared (m2). Waist circumference (WC; accuracy 0.01 m) was measured at the midpoint between the lower costal margin and the superior iliac crest. Having rested for at least 10 min, the subjects were placed in a sitting position. Blood pressure was measured three times via an electronic sphygmomanometer (OMRON, Japan) and averaged.
Biochemical measurement
After overnight fast (for at least 8 h), blood samples were taken and centrifuged. Fasting plasma glucose (FPG), alanine aminotransferase (ALT), aspartate aminotransferase (AST), TG, total cholesterol (TC), high-density lipoprotein cholesterol (HDL-C) and low-density lipoprotein cholesterol (LDL-C) were determined via a Hitachi 7600 analyzer (Hitachi, Tokyo, Japan). Fasting insulin was measured by an automated immunoassay analyzer (AIA-2000ST, TOSOH, Japan). IR status was evaluated using homeostasis model assessment of IR index (HOMA-IR). HOMA-IR formula = [FPG (mmol/L) × fasting insulin (mIU/L)]/22.5. High-performance liquid chromatography was used to determine hemoglobin A1c (HbA1c) levels (HLC-723G8, TOSOH Company, Japan).
Measurement of ADRP
Within 2 h after blood sampling, the serum was isolated after centrifugation (3000 rev/min, 10 min) and stored at −80°C. Serum ADRP levels were measured via enzyme linked immunosorbent assay kit for human (IC, USA). The measurement was performed following the instructions of the manufacturer. The intra-assay coefficient of variation (CV) was <10% and the inter-CV was <12%.
Statistical analysis
SPSS 21.0 was performed for all statistical analyses. Kolmogorov–Smirnov test was used to test data distribution. Data in normal distribution were presented as mean ± standard deviation (SD), and data in skewed distribution as median (interquartile range, 25th–75th). Then independent samples t test or Mann–Whitney U test was performed to evaluate differences of continuous variables between two groups. χ2 test was conducted to compare categorical data. To identify independent factors of the prevalence of NAFLD in T2DM, binary and multinomial logistic regression models were performed. To assess the correlation between ADRP levels and the prevalence of NAFLD in T2DM, all subjects were stratified into trisection according to ADRP tertiles (T1: <3.85 ng/mL; T2: 3.85−4.79 ng/mL; T3: ⩾4.79 ng/mL), then trend χ2 test was used. To control potential confounders which could be risk factors of NAFLD in T2DM, multivariate logistic regression models were performed to calculate odds ratios (ORs) and 95% confidence intervals (CIs) for NAFLD in T2DM. ADRP levels for detecting NAFLD in T2DM were demonstrated by receiver operating characteristic (ROC) curve. The threshold of ADRP was set according to the largest Youden index. Pearson correlation analysis was used to analyze bivariate correlation between ADRP and other variables. To identify independent factors related to ADRP, multiple linear regression analysis was performed. Before correlation and stepwise regression analysis, skewed distributed data were log-transformed. In the linear regression models, variance inflation factor (VIF) was used to test multi-collinearity of independent variables. A variable with VIF ⩾5.0 was considered to be collinear and removed from the model. p value <0.05 (two sided) was considered to be statistically significant.
Results
Participants’ characteristics
All participants were divided into two groups: T2DM concurrent with NAFLD (Group-I) and T2DM with non-NAFLD (Group-II). Sex and age were comparable between two groups. As expected, Group-I presented more abnormal obesity related indexes and lipid profiles than Group-II (WC, BMI, HOMA-IR, ALT, TG and HDL-C included, p < 0.05). Serum ADRP levels were significantly increased in Group-I compared with Group-II (4.61 ± 0.84 versus 3.93 ± 0.75 ng/mL, p < 0.01). Between the two groups, other variables, including systolic blood pressure (SBP), diastolic blood pressure (DBP), HbA1c, FPG, TC, LDL-C and AST, showed no significant differences (Table 1).
General clinical and laboratory parameter in participants without and with non-alcoholic fatty liver disease in type 2 diabetes mellitus.
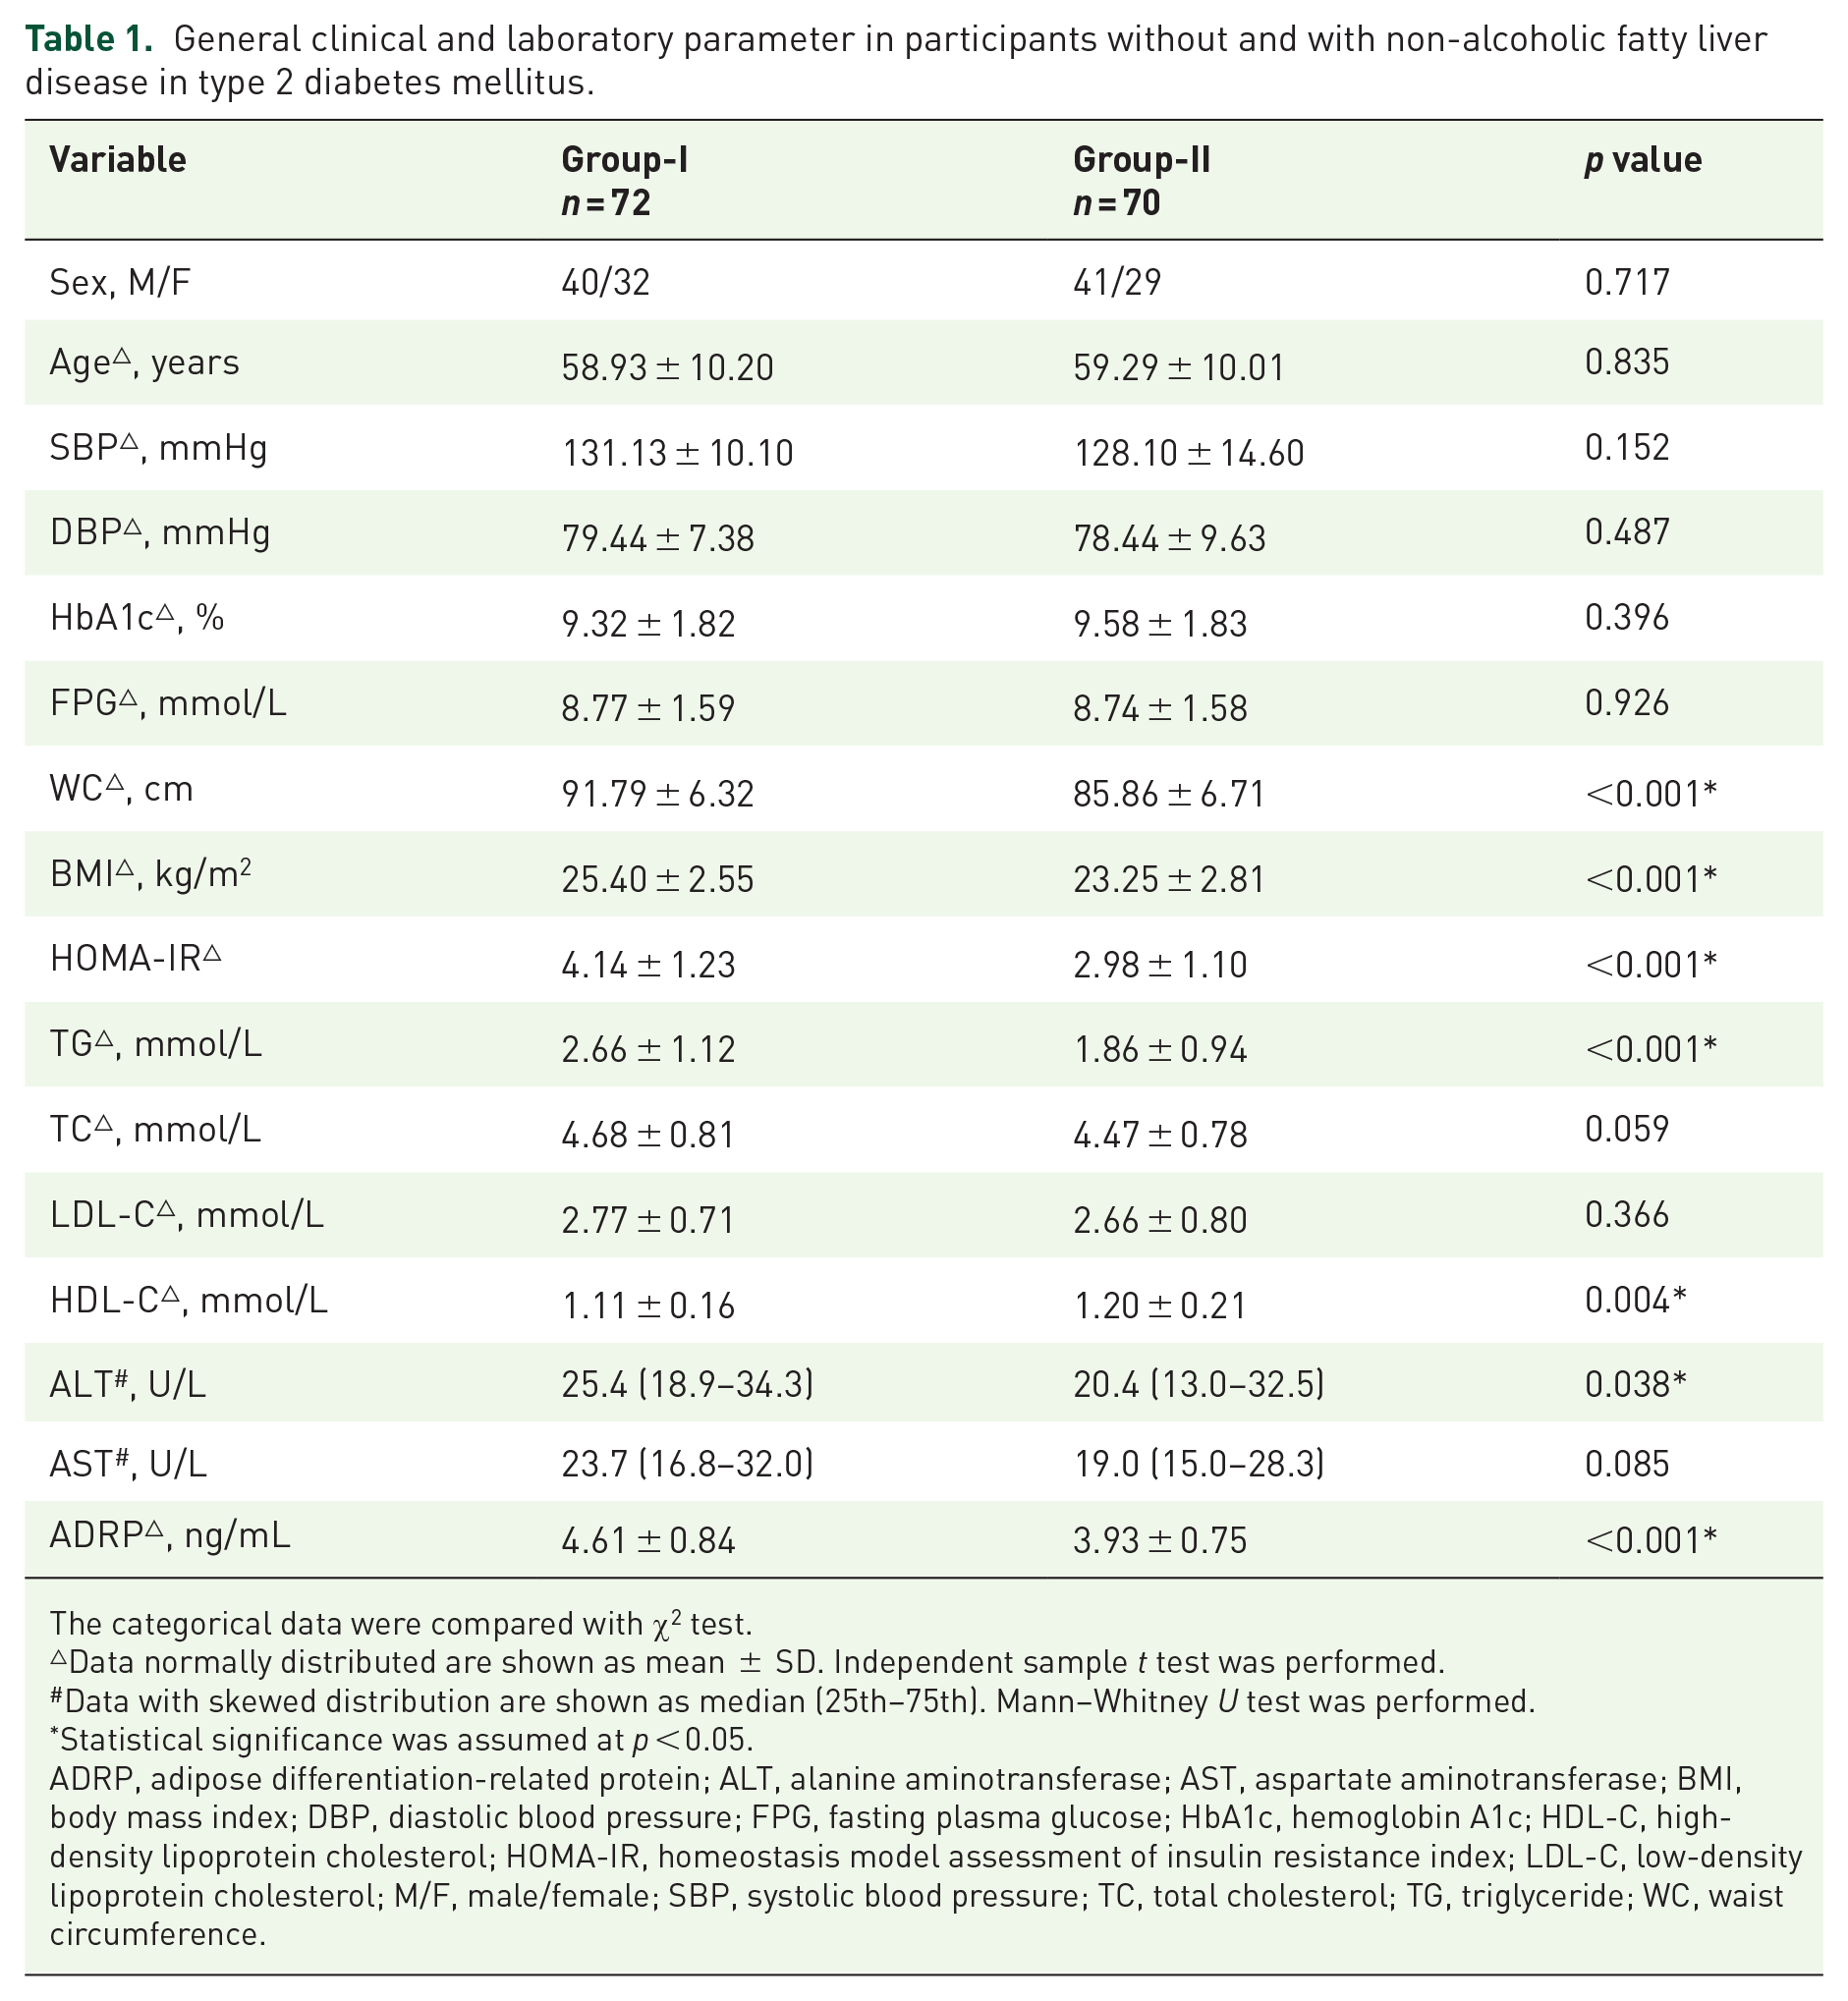
The categorical data were compared with χ2 test.
Data normally distributed are shown as mean ± SD. Independent sample t test was performed.
Data with skewed distribution are shown as median (25th−75th). Mann–Whitney U test was performed.
Statistical significance was assumed at p < 0.05.
ADRP, adipose differentiation-related protein; ALT, alanine aminotransferase; AST, aspartate aminotransferase; BMI, body mass index; DBP, diastolic blood pressure; FPG, fasting plasma glucose; HbA1c, hemoglobin A1c; HDL-C, high-density lipoprotein cholesterol; HOMA-IR, homeostasis model assessment of insulin resistance index; LDL-C, low-density lipoprotein cholesterol; M/F, male/female; SBP, systolic blood pressure; TC, total cholesterol; TG, triglyceride; WC, waist circumference.
Risk factors for NAFLD in T2DM
To evaluate risk factors associated with NAFLD in T2DM, we constructed binary logistic regression models for both univariate and multivariate analysis (Table 2). In the univariate models, increased BMI, WC, HOMA-IR, TG and ADRP, and reduced HDL-C levels were related to higher incidence of NAFLD in T2DM patients. In the multivariate model, after adjustment of covariates which were associated with NAFLD in the univariate models, only increased WC and ADRP, and reduced HDL-C levels were independent risk factors for T2DM concurrent with NAFLD.
Independent factors associated with non-alcoholic fatty liver disease in binary logistic regression models.
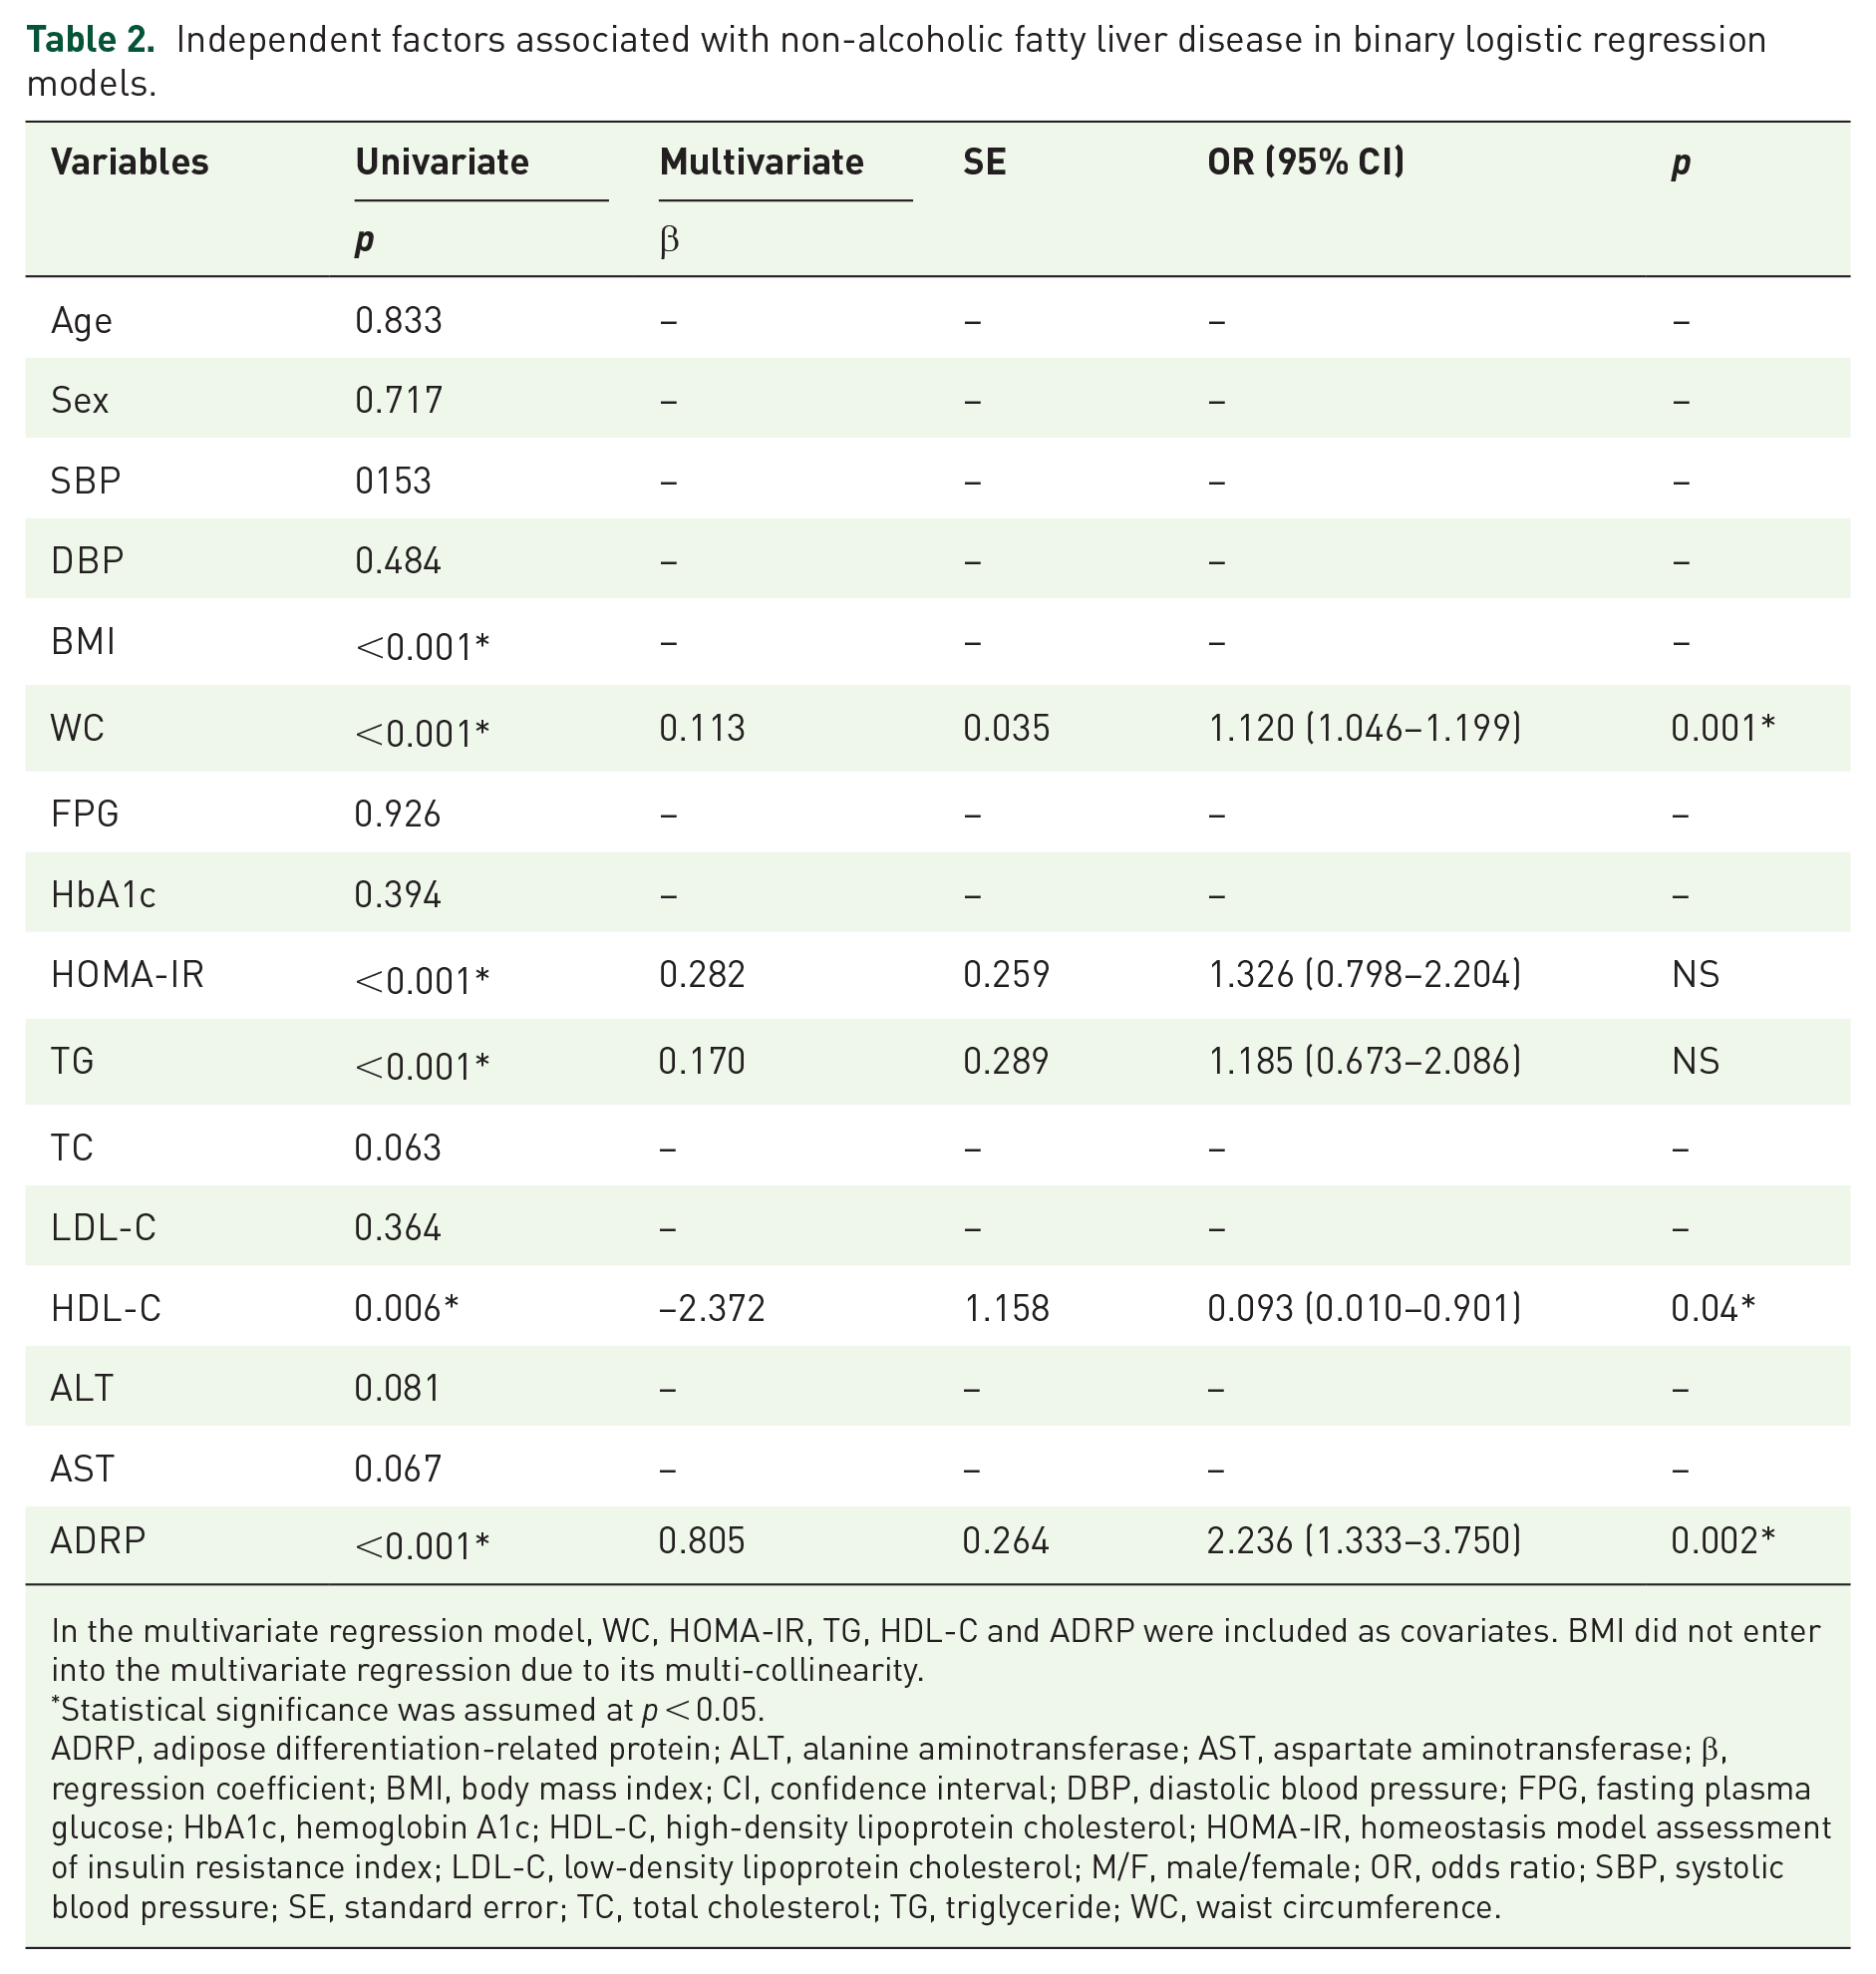
In the multivariate regression model, WC, HOMA-IR, TG, HDL-C and ADRP were included as covariates. BMI did not enter into the multivariate regression due to its multi-collinearity.
Statistical significance was assumed at p < 0.05.
ADRP, adipose differentiation-related protein; ALT, alanine aminotransferase; AST, aspartate aminotransferase; β, regression coefficient; BMI, body mass index; CI, confidence interval; DBP, diastolic blood pressure; FPG, fasting plasma glucose; HbA1c, hemoglobin A1c; HDL-C, high-density lipoprotein cholesterol; HOMA-IR, homeostasis model assessment of insulin resistance index; LDL-C, low-density lipoprotein cholesterol; M/F, male/female; OR, odds ratio; SBP, systolic blood pressure; SE, standard error; TC, total cholesterol; TG, triglyceride; WC, waist circumference.
Serum ADRP levels and NAFLD
All participants were stratified into trisection according to ADRP tertiles (T1: <3.85 ng/mL; T2: 3.85−4.79 ng/mL; T3: ⩾4.79 ng/mL). Trend χ2 test indicated that the incidence of NAFLD in T2DM patients increased with ADRP levels across the three tertiles (T1: 29.17%, T2: 44.68% and T3: 78.72%; p value for trend <0.001).
Multiple logistic regression analysis was performed using NAFLD as a dependent variable and ADRP as an independent variable. In the unadjusted model, subjects in the highest ADRP tertile showed a higher risk of NAFLD compared with those in the lowest ADRP tertile (OR 8.986; 95% CI 3.526–22.902; p < 0.001). Furthermore, multivariate analysis revealed that the association between NAFLD and ADRP levels remained significant even after adjustment of potential confounders, such as age, sex, SBP, DBP, FPG, HbA1c, WC, BMI, HOMA-IR, ALT and AST (OR 8.831; 95% CI 2.126–24.240, highest versus lowest ADRP tertile; p = 0.002) (Table 3).
Non-alcoholic fatty liver disease risk according to adipose differentiation-related protein tertiles in multinomial logistic regression models.
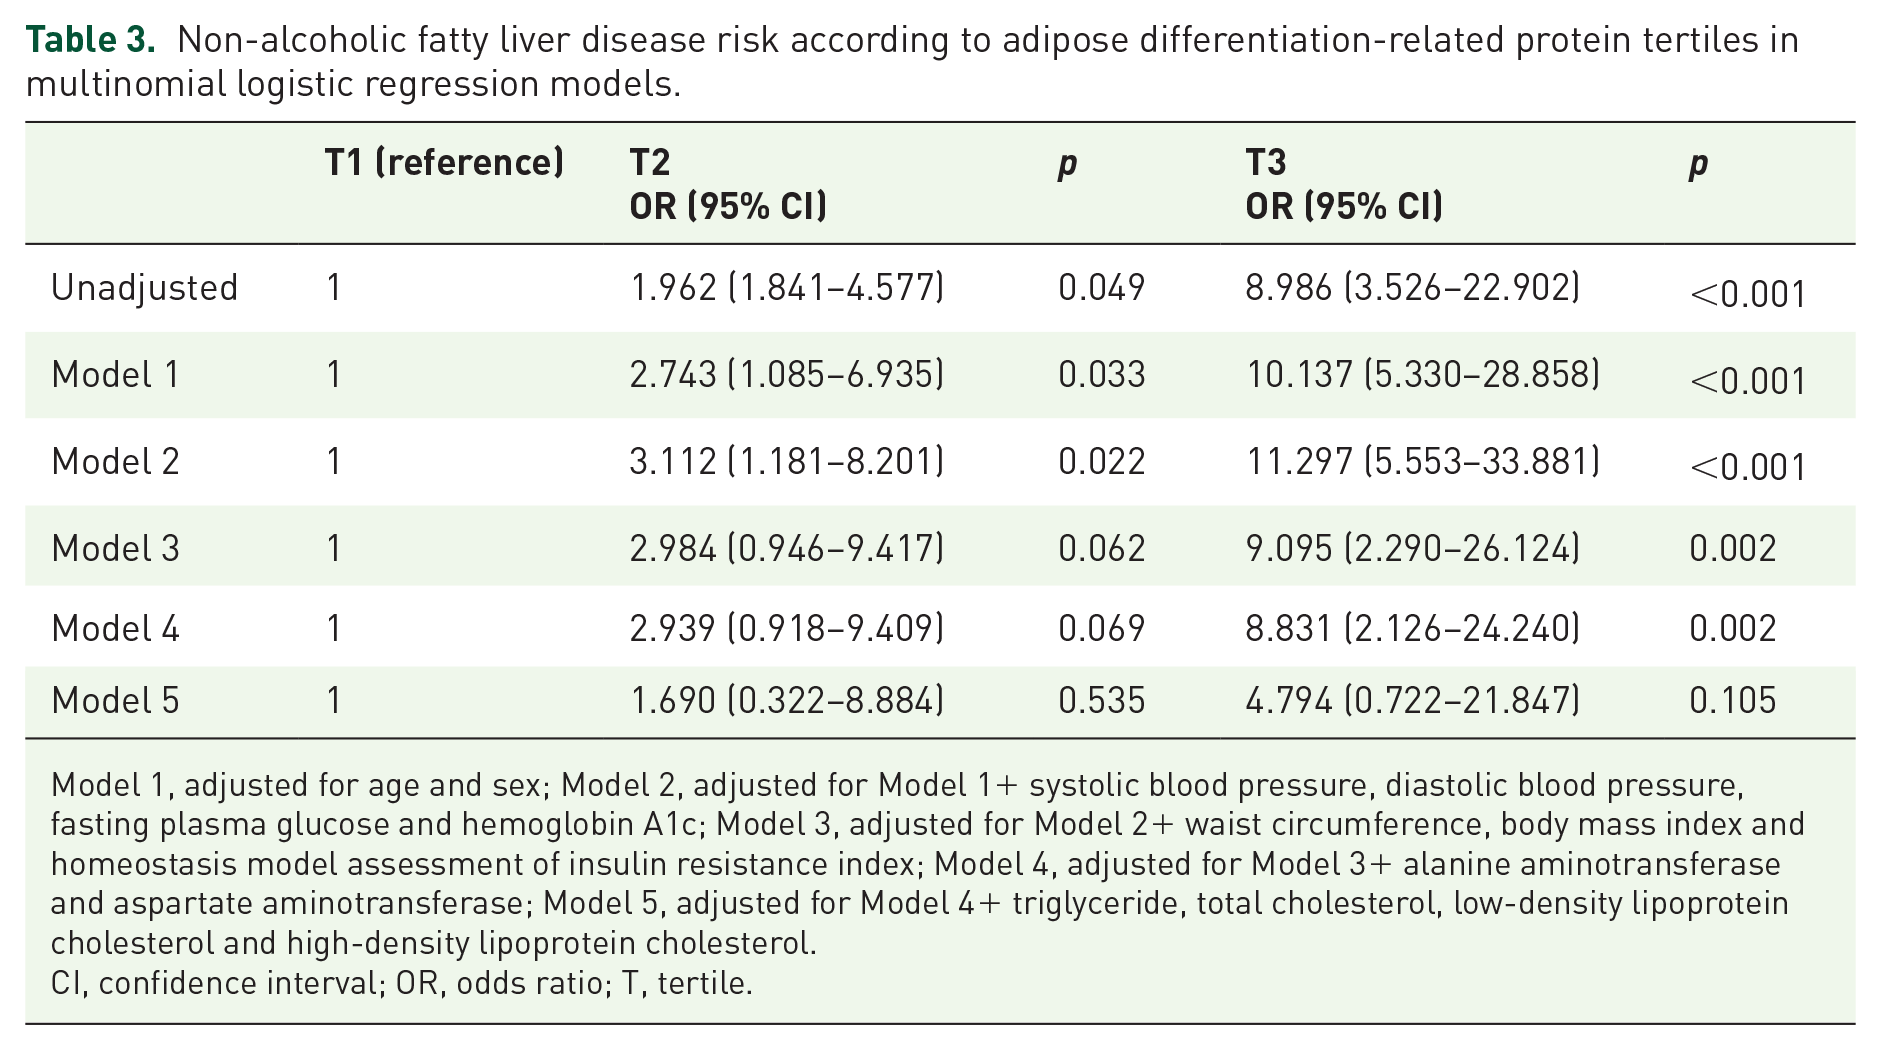
Model 1, adjusted for age and sex; Model 2, adjusted for Model 1+ systolic blood pressure, diastolic blood pressure, fasting plasma glucose and hemoglobin A1c; Model 3, adjusted for Model 2+ waist circumference, body mass index and homeostasis model assessment of insulin resistance index; Model 4, adjusted for Model 3+ alanine aminotransferase and aspartate aminotransferase; Model 5, adjusted for Model 4+ triglyceride, total cholesterol, low-density lipoprotein cholesterol and high-density lipoprotein cholesterol.
CI, confidence interval; OR, odds ratio; T, tertile.
As illustrated in Figure 1, the ROC curve of ADRP values for predicting the incidence of NAFLD in T2DM was plotted. The area under the curve (AUC) was 0.738 (95% CI 0.655–0.821, p < 0.001). At a level of ADRP 4.395 ng/dL, the sensitivity was 75.7% and the specificity was 68.1%.

Receiver operating characteristic curve of adipose differentiation-related protein (ADRP) values for non-alcoholic fatty liver disease diagnosis in type 2 diabetes mellitus. The area under the curve (AUC) was 73.8%. For a concentration of ADRP 4.395 ng/dL, sensitivity was 75.7%, specificity was 68.1%.
Correlations between serum ADRP level and other parameters
Pearson correlation analysis demonstrated that serum ADRP level was positively correlated with age, BMI, WC, HOMA-IR, TG, TC and log-ALT in all subjects. In the linear regression model, after covariates associated with ADRP were adjusted in the Pearson correlation analysis, TC and log-ALT were ultimately excluded from the model. Age, WC, HOMA-IR and TG were shown as independent factors associated with ADRP levels in all subjects. BMI was excluded from the model due to its high multi-collinearity with WC (Table 4).
Multiple stepwise regression analysis: independent factors associated with serum adipose differentiation-related protein in all subjects.

In this model WC, total cholesterol and alanine aminotransferase (ALT) were also included as covariates, but they were not independently associated with adipose differentiation-related protein. Body mass index did not enter into the model due to its high multi-collinearity (variance inflation factor >5.0). ALT was log-transformed before analysis. p value <0.05 was considered significant.
β, unstandardized coefficient; β′, standardized coefficient; HOMA-IR, homeostasis model assessment of insulin resistance index; SE, standard error; TG, triglyceride; WC, waist circumference.
Discussion
In the current research, we report that circulating ADRP was elevated in T2DM patients with NAFLD compared with that in T2DM patients with non-NAFLD. In addition, ADRP was shown to be significantly associated with NAFLD, even after adjustment of potential confounding factors. Furthermore, subjects in the highest ADRP tertile showed a risk of NAFLD 8.831 times higher than those in the lowest ADRP tertile, even after adjustments of confounding factors. The crude AUC of ADRP ROC for detecting NAFLD in T2DM was 0.738. Collectively, these findings suggest that serum ADRP might be an independent factor associated with the pathogenesis of NAFLD and a predictor for NAFLD in T2DM.
NAFLD, characterized by disordered lipid metabolism, is widely considered as a hepatic manifestation of metabolic syndrome. The development of NAFLD is closely related to visceral obesity, IR and other components of metabolic syndrome. 18 Our data confirmed that WC, BMI, HOMA-IR, ALT, TG and HDL-C were different between T2DM subjects with and without NAFLD. In the multivariate model, after adjustment of covariates which were associated with NAFLD, increased WC and ADRP and reduced HDL-C levels were still independent risk factors for T2DM concurrent with NAFLD.
ADRP, a member of PAT family, is involved in lipid droplet formation in the liver and peripheral tissues. Recent data indicate that ADRP functions in cell metabolism and several human pathologies, including liver steatosis and T2DM. 19 ADRP is a core protein in regulating intracellular lipid accumulation and metabolism. Moreover, ADRP affects the synthesis of lipid in several tissues. Accumulation of intramuscular lipids increases IR and facilitates T2DM development.20,21 The immuno-histochemical analysis showed that ADRP localized to the surface of lipid droplets in fatty liver tissues, indicating that ADRP participates in the progression of fatty liver disease. 22
The mechanism of ADRP in lipid droplet formation is complex. ADRP blocks the contact of lipase with neutral lipids, thereby inhibiting the hydrolysis of TGs and maintaining the stability of lipid droplets. 23 Then, recent studies11,20 found that sterol regulatory element binding protein-1 (the master regulator of genes involved in de novo lipogenesis) 24 and diacylglycerol acyltransferase 2 (the enzyme deciding the last step in TG synthesis) 25 are greatly modulated by ADRP. Moreover, a study found that ADRP can regulate intracellular lipid metabolism through the peroxisome proliferator activated receptor alpha/retinoid X receptor alpha and cAMP responsive element binding protein/CREB binding protein signaling pathways in HepG2 cells. 14 Animal studies have verified that ADRP overexpression leads to TG overaccumulation in liver cells, 12 which is a hallmark of NAFLD. In our research, we found that TG was independently associated with ADRP. We further verified the closeness between ADRP and TG. ADRP plays a regulatory role in the steatosis of hepatocytes. ADRP knockout mice did not respond to diet-induced obesity, fatty inflammation and hepatic steatosis.13,19,26,27 So deficient ADRP expression may hinder the lipid accumulation in the liver, thus preventing hepatic steatosis. Another study also found that octreotide treatment reversed the up-regulation of ADRP in high-fat-diet-induced obese rats and ultimately reduced the abnormal accumulation of hepatic TG. 12 In our study, we also found that ADRP was an independent risk factor for NAFLD in T2DM patients. Moreover, as ADRP levels elevated across its tertiles, the percentage of NAFLD in T2DM patients increased. Subjects in the highest ADRP tertile showed a higher risk of NAFLD compared with those in the lowest ADRP tertile, even after potential confounders were adjusted. So, it is inspiring that a NAFLD-fighting drug may be developed to regulate ADRP expression and synthesis.
Obesity predisposes a patient to IR. As too much lipid accumulates in the adipocyte, the excessive lipid will be forced into ectopic sites, such as visceral adipose tissue (VAT), 28 that have no capacity for lipid storage. VAT is susceptible to inflammation and IR, 29 two pivotal mechanisms involved in NAFLD, metabolic syndrome and T2DM. 30 Abdominal obesity is characterized by excessive subcutaneous fat and VAT and usually indicated by WC. Silva et al. 31 have found that the ADRP level in abdominal subcutaneous fat is higher in non-diabetic obese females than in healthy individuals, and that ADRP promotes obesity development via increasing the lipid accumulation in abdominal subcutaneous fat. This suggests that ADRP level is associated with not only body fat percent, but also obesity type. In patients with abdominal obesity, ADRP level increases more significantly, leading to IR and consequent fatty liver or diabetes. In our research, NAFLD in T2DM showed significantly increased WC, BMI, HOMA-IR and ADRP levels. Binary logistic regression found that WC and ADRP were two independent risks for NAFLD in T2DM and multivariate linear stepwise regression found the independent association between WC, HOMA-IR and ADRP levels. We speculated that obese T2DM patients, especially those with abdominal obesity, are more susceptible to NAFLD. There may be a link between ADRP and WC, and IR in the development of NAFLD in T2DM, which needs to be clarified with longitudinal studies.
The multiple linear stepwise regression calculated that age acted as an independent factor of ADRP (a regression coefficient of >0), indicating that ADRP expression level increases with age. This finding is consistent with that of previous studies. Fat deposition within skeletal muscle in the form of ADRP-coated lipid droplets increases with age, likely through activating p53 and downregulating IGF-1.32,33 Another study also found that the activity of proteasomes fell as age increased, significantly worsening hepatic steatosis and promoting ADRP expression level in high-fat-diet-induced mice. 34 Moreover, a recent work in Drosophila showed that dHDAC6-dependent ADRP degradation reduced age dependent ectopic fat accumulation and protected the organism from tissue dysfunction during aging. 35
A potential role of ADRP overexpression in glucose uptake has been recently demonstrated in a study using transfected mouse fibroblast L cells and differentiated 3T3-L1 adipocytes. 36 In these cells, a negative correlation between ADRP expression and glucose uptake was observed; thus, ADRP overexpression markedly decreased glucose uptake, whereas ADRP knock-down increased in glucose uptake. In our study, no interaction between ADRP and glucose was found, perhaps due to the physical difference between animals and humans. Besides, T2DM patients had a long duration of disease and showed no difference in blood glucose level after use of antidiabetics. Lastly, the sample size was comparatively small, which may lead to bias.
There are several limitations in our study. First, as a hospital-based cross-sectional study, it is not possible to explain the causality between ADRP expression and the development of NAFLD in T2DM. We are planning to perform a follow-up survey to explore the longitudinal effects of ADRP on NAFLD in T2DM. Second, as a single-center study, its comparatively small size may bring with selection bias. Larger-size studies are needed to fortify our finding. Third, fatty liver diagnosis was based on ultrasound, which could be less accurate than liver biopsy. Fourth, the underlying mechanism is still to be explored by research in vitro and in vivo.
In conclusion, our research reveals a connection between ADRP and NAFLD in T2DM for the first time. ADRP is an independent risk factor for NAFLD in T2DM. As ADRP levels elevate across its tertiles, the incidence of NAFLD in T2DM patients increases. Whether regulating ADRP expression can treat NAFLD in T2DM should be answered with more studies in vivo or in vitro.
Footnotes
Acknowledgements
We express our sincere thanks to all the volunteers and nurses who offered help in the study.
Author contribution(s)
Conflict of interest statement
The authors declare that there is no conflict of interest.
Funding
The authors disclosed receipt of the following financial support for the research, authorship, and/or publication of this article: This study was supported by the Science and Technology Foundation of Suzhou, China (No. SYS201603).