
Abstract
Background:
Although sodium-glucose cotransporter 2 inhibitors (SGLT2-Is) improve not only glycemic control but also liver inflammation and fatty changes in patients with non-alcoholic fatty liver disease (NAFLD) and type 2 diabetes mellitus (T2DM), its sustainability and effect on liver fibrosis have remained unclear. The current study aimed to clarify the effects of 48-week SGLT2-I therapy on liver inflammation, fatty changes, and fibrosis in NAFLD patients with T2DM.
Methods:
This study evaluated the effects of SGLT2-I on NAFLD, including liver fibrosis assessed via transient elastography, in 56 patients with NAFLD who received SGLT2-I for 48 weeks. Moreover, changes in each clinical parameter between patients receiving SGLT2-I (the SGLT2-I group) and those receiving other oral hypoglycemic agents (OHAs) (the non-SGLT2-I group) were compared, using 1:1 propensity score matching to adjust for baseline factors.
Results:
The SGLT2-I group exhibited a significant decrease in controlled attenuation parameter (312 dB/m at baseline to 280 dB/m at week 48) and liver stiffness measurement (9.1–6.7 kPa) (p < 0.001 for both). After propensity score matching (44 patients each in the SGLT2-I and non-SGLT2-I groups), no significant difference in HbA1c decrease was observed between the two groups. However, compared with the non-SGLT2-I group, the SGLT2-I group showed a significant decrease in body weight (p < 0.001), alanine aminotransferase (p = 0.02), uric acid (p < 0.001), and Fibrosis-4 (FIB-4) index (p = 0.01) at week 48. The improvement in FIB-4 index, defined as a ⩾10% decline from baseline at week 48, was 56.8% (25/44) in the SGLT2-I group and 20.5% (9/44) in the non-SGLT2-I group (p < 0.001).
Conclusion:
SGLT2-Is improved not only glycemic control but also liver fatty infiltration and fibrosis in patients with NAFLD and T2DM, suggesting their possible superiority to other OHAs concerning these effects.
Keywords
Introduction
Non-alcoholic fatty liver disease (NAFLD), a major chronic liver disease with a global prevalence of approximately 25%,1–3 can progressively develop into liver cirrhosis and subsequently hepatocellular carcinoma (HCC). 4 Considering that NAFLD is a multifactorial disease mutually associated with metabolic syndrome, 5 the coexistence of type 2 diabetes mellitus (T2DM), abnormal glucose tolerance, or insulin resistance largely influences the development of NAFLD, fibrosis, and HCC.6,7
The American Diabetes Association (ADA) and European Association for the Study of Diabetes (EASD) have recommended metformin as the first-line treatment for T2DM. However, when poor therapeutic effects are observed with metformin, other oral hypoglycemic agents (OHAs) have been recommended as a second-line treatment. 8 However, metformin, insulin, sulfonylurea, and dipeptidyl peptidase 4 (DPP4) inhibitors have poor effects on liver inflammation and fibrosis in patients with NAFLD complicated by T2DM.9,10 Moreover, sulfonylurea and insulin administration may increase the risk for developing HCC in patients with NAFLD. 11 Recently, it was reported that treatment with the glucagon-like peptide-1 receptor agonist semaglutide resulted in a significantly higher percentage of patients with resolution of non-alcoholic steatohepatitis than placebo, but its effect on liver fibrosis is still controversial. 12
Currently, pioglitazone, a peroxisome proliferator-activated receptor-γ agonist with an insulin-sensitizing effect, has been the only OHA recommended by the American Association for the Study of Liver Disease, 13 European Association for the Study of the Liver, 14 and Japanese Society of Gastroenterology 15 for the treatment of NAFLD. Although pioglitazone has been shown to improve the histological features of NAFLD, it can potentially lead to several adverse effects, such as weight gain, edema, heart failure, and osteoporosis.16,17 Therefore, treatment options have been limited.
Sodium-glucose cotransporter 2 inhibitor (SGLT2-I) is an antidiabetic drug that inhibits glucose reabsorption in the proximal tubule and increases urinary glucose excretion, leading to a reduction in blood glucose levels. Apart from this hypoglycemic action, SGLT2-I has been found to reduce the body weight and visceral fat. Reports have shown that SGLTS2-I improved liver inflammation and fatty changes in patients with NAFLD suffering from T2DM.18–30 However, such studies had a small number of cases and/or a short treatment period (24 weeks or less). Moreover, only a few studies have investigated how SGLT2-I improves liver fibrosis in patients with NAFLD.
The current study aimed to clarify the influence of 48-week SGLT2-I therapy on not only glucose metabolism but also liver histology, including inflammation, fatty infiltration, and fibrosis, in patients with NAFLD complicated by T2DM.
Materials and methods
Patients
Among patients who visited Nippon Medical School Chiba Hokusoh Hospital and Kikkoman General Hospital between October 2015 and February 2019, 56 patients with NAFLD and T2DM were enrolled and received SGLT2-I for 48 weeks (designated as the SGLT2-I group). Moreover, among 66 patients with NAFLD and T2DM who received other OHAs at Nippon Medical School Hospital between March 2011 and June 2019, 44 were selected using propensity score (PS) matching and registered as the non-SGLT2-I group.
The inclusion criteria for the SGLT2-I group were as follows: (1) >20 years of age; (2) presence of steatosis in ⩾5% of hepatocytes according to histological findings or fat deposit determined via ultrasonography; and (3) HbA1c ⩾6.2% despite dietary/exercise therapies and/or other OHAs for at least 8 weeks. The main exclusion criteria included patients with (1) daily alcohol consumption ⩾30 g for men and ⩾20 g for women; (2) other chronic liver diseases, such as viral hepatitis B or C, alcoholic liver disease, autoimmune hepatitis, primary biliary cholangitis, Wilson disease, and hemochromatosis; and (3) pregnancy and lactation. This study was conducted according to the ethical guidelines of the 2013 Declaration of Helsinki and was approved by the Ethics Committee of Nippon Medical School Chiba Hokusoh Hospital (approval number: 529012). All patients provided written informed consent prior to study inclusion. All treatments were provided as part of routine care.
Study design
Clinical and laboratory data were collected every 3 months during the study period. Liver stiffness measurement (LSM) and controlled attenuation parameter (CAP) were assessed through transient elastography using FibroScan 502 equipped with M-probe (Echosens SA, Paris, France) at initiation and week 48 of SGLT2-I therapy. First, we performed an efficacy analysis involving 56 patients receiving SGLT2-I (Figure 1). Second, to compare the SGLT2-I and non-SGLT2-I groups, we adjusted for baseline factors, including age, gender, body weight, platelets, alanine aminotransferase (ALT), plasma glucose, hemoglobin A1c (HbA1c), uric acid, and Fibrosis-4 (FIB-4) index, using PS matching. After 1:1 PS matching, 44 patients in each group were included in the final comparative analysis (Figure 1).

Flow chart for patient inclusion.
Laboratory tests
Laboratory evaluation included complete blood count, routine liver biochemistry (aspartate aminotransferase, ALT, albumin, and gamma glutamyl transpeptidase), fasting lipids (triglyceride, high-density lipoprotein cholesterol, and low-density lipoprotein cholesterol), fasting plasma glucose, HbA1c, and uric acid. FIB-4 index, a fibrosis score, was calculated as reported previously. 31
Statistical analyses
Continuous variables were presented as medians and ranges in parentheses, while categorical variables were presented as numbers and percentages in parentheses. Categorical variables were compared using the Fisher’s exact test, while continuous variables were analyzed using the Mann–Whitney U test. The kinetics of the aforementioned factors was examined using the Wilcoxon signed-rank test. Correlations between continuous variables were analyzed using the Spearman’s rank correlation test. PS matching was performed to reduce differences in baseline characteristics between the SGLT2-I and non-SGLT2-I groups. PS models were estimated using a logistic regression model that adjusts for patient characteristics, including age, gender, body weight, platelets, ALT, plasma glucose, HbA1c, uric acid, and FIB-4 index. The PS matching model was validated using the Hosmer and Lemeshow goodness-of-fit test (p = 0.795) and the area under the curve (0.704, 95% confidence interval: 0.612–0.795). One-to-one matching of patients was completed using nearest neighbor matching without replacement, while the PS was matched using a caliper width of 0.2 logit of the standard deviation. All statistical analyses were performed using Excel Statistics 2015 software (SSRI, Tokyo), with statistical significance set at p < 0.05.
Results
Patient characteristics of the SGLT2-I group
Baseline characteristics of the 56 patients with NAFLD who received SGLT2-I are shown in Table 1. The SGLT2-I group had 28 men and 28 women, a median age of 59 years (range, 31–77 years), and a median HbA1c of 7.4% (range, 6.2–12.6%). Prior to SGLT2-I initiation, 28 patients had been receiving dietary and/or exercise therapies without OHAs, while the remaining 28 had been receiving other OHAs, including sulfonylurea (n = 4), α-glucosidase inhibitor (n = 2), metformin (n = 12), and DPP4 inhibitor (n = 25). The SGLT2-Is administered were as follows: canagliflozin (n = 29), ipragliflozin (n = 12), tofogliflozin (n = 6), dapagliflozin (n = 4), luseogliflozin (n = 4), and empagliflozin (n = 1).
Baseline characteristics of the 56 patients treated with SGLT2-I.

Categorical variables are given as numbers (percentages). Continuous variables are given as medians (ranges).
γ-GTP, gamma glutamyl transpeptidase; ALT, alanine aminotransferase; AST, aspartate aminotransferase; BMI, body mass index; CAP, controlled attenuation parameter; DPP4, dipeptidyl peptidase-4; FIB-4, Fibrosis-4; HbA1c, hemoglobin A1c; HDL, high-density lipoprotein; LDL, low-density lipoprotein; LSM, liver stiffness measurement; SGLT2-I, sodium-glucose cotransporter 2 inhibitor.
Among the 56 patients in the SGLT2-I group, 52 underwent transient elastography before and 48 weeks after SGLT2-I administration. The median baseline CAP and LSM values were 312 dB/m (range, 182–400 dB/m) and 9.1 kPa (range, 3.8–46.4 kPa), respectively. When the LSM value of 16.1 kPa or higher was defined as liver cirrhosis with reference to the previous report, 32 10 out of 52 patients were diagnosed with liver cirrhosis.
Efficacy of SGLT2-I
In the SGLT2-I group, significant decreases in body weight, ALT, HbA1c, and uric acid levels were found at weeks 12, 24, and 48 (Figure 2). Regarding changes in liver fat/fibrosis indices (Figure 3), median CAP decreased from 312 dB/m at baseline to 280 dB/m at week 48 (p < 0.001), while median LSM decreased from 9.1 kPa at baseline to 6.7 kPa at week 48 (p < 0.001). FIB-4 index improved from 1.82 at baseline to 1.70 at week 48 (p < 0.01). Moreover, changes in body weight were found to be correlated with changes in ALT (r = 0.35; p < 0.01) and CAP (r = 0.33; p = 0.02) (Figure 4).

Changes from baseline in (a) body weight, (b) alanine aminotransferase (ALT), (c) hemoglobin A1c (HbA1c), (d) uric acid in patients treated with sodium-glucose cotransporter 2 inhibitor for 48 weeks.

Changes from baseline in (a) controlled attenuation parameter (CAP), (b) liver stiffness measurement (LSM), (c) Fibrosis-4 (FIB-4) index.
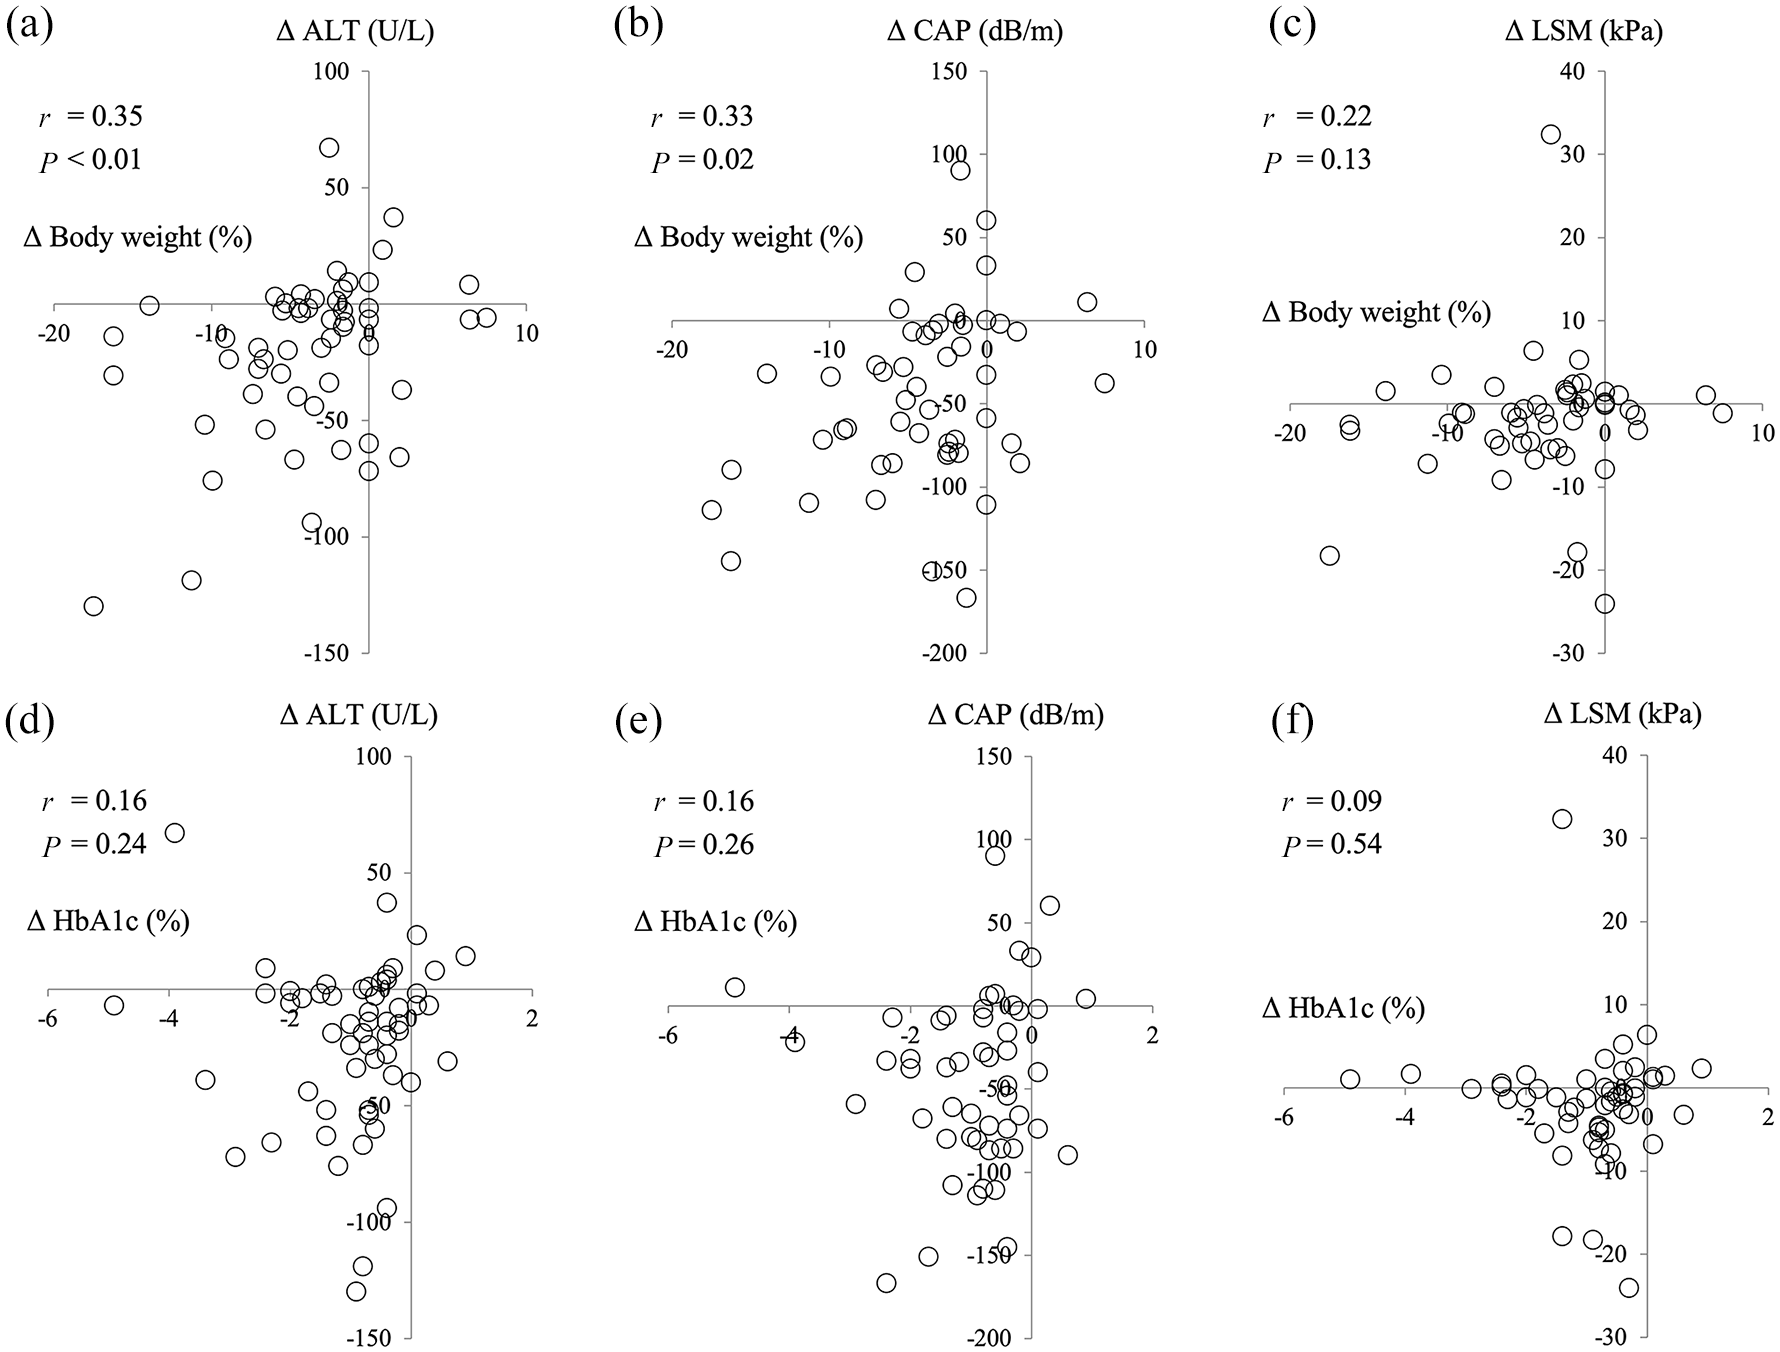
Correlation between body weight changes from baseline to 48 weeks after sodium-glucose cotransporter 2 inhibitor treatment and (a) alanine aminotransferase (ALT), (b) controlled attenuation parameter (CAP), (c) liver stiffness measurement (LSM); correlation between hemoglobin A1c (HbA1c) changes, (d) ALT, (e) CAP, and (f) LSM.
Table 2 shows the treatment effect of SGLT2-I in patients who received SGLT2-I as a first-line drug and those who received SGLT2-I in addition to other OHAs. Body weight, ALT, uric acid, HbA1c, and CAP showed a significant decrease at week 48 with or without other OHAs prior to administration of SGLT2-I. LSM decreased significantly in patients who received SGLT2-I as a first-line drug, while it also tended to decrease in those who received SGLT2-I in addition to other OHAs, although not significantly.
Treatment effects of SGLT2-I in patients who received SGLT2-I as a first-line drug and those who received SGLT2-I in addition to other oral hypoglycemic agents.

Data are expressed as median (interquartile range).
ALT, alanine aminotransferase; CAP, controlled attenuation parameter; HbA1c, hemoglobin A1c; LSM, liver stiffness measurement; SGLT2-I, sodium-glucose cotransporter 2 inhibitor.
Comparison between the SGLT2-I and non-SGLT-2-I groups
After PS matching, a matched sample consisting of 44 patients in each group had been obtained (Table 3). No significant differences in baseline characteristics between these two groups were observed.
Comparison of characteristics between SGLT2-I and non-SGLT2-I groups after propensity score matching.

Categorical variables are given as numbers (percentages). Continuous variables are given as medians (ranges).
γ-GTP, gamma glutamyl transpeptidase; ALT, alanine aminotransferase; AST, aspartate aminotransferase; BMI, body mass index; DPP4, dipeptidyl peptidase-4; FIB-4, Fibrosis-4; HbA1c, hemoglobin A1c; HDL, high-density lipoprotein; LDL, low-density lipoprotein; SGLT2-I; sodium-glucose cotransporter 2 inhibitor.
The non-SGLT2-I group exhibited a significant decrease in HbA1c (p < 0.001), although no significant decrease in body weight (p = 0.91), ALT (p = 0.16), uric acid (p = 0.07), and FIB-4 index (p = 0.99) was noted at week 48 (Table 4). In contrast, the SGLT2-I group showed a significant decrease in body weight (p < 0.001), ALT (p = 0.02), uric acid (p < 0.001), and FIB-4 index (p = 0.01) at week 48 (Table 4). However, no significant difference in HbA1c decrease was found between the SGLT2-I and non-SGLT2-I groups (p = 0.14).
Comparison of treatment effects between the SGLT2-I and non-SGLT2-I groups.

Data are expressed as median (interquartile range).
p-values between changes observed in the SGLT2-I and non-SGLT2-I groups.
ALT, alanine aminotransferase; FIB-4, Fibrosis-4; HbA1c, hemoglobin A1c; SGLT2-I, sodium-glucose cotransporter 2 inhibitor.
When defining FIB-4 index improvement as a ⩾10% decline from baseline to week 48, the SGLT2-I and non-SGLT2-I groups showed an improvement rate of 56.8% (25/44) and 20.5% (9/44), respectively (p < 0.001) [Figure 5(a)]. Conversely, when defining FIB-4 index deterioration as a ⩾10% increase from baseline to week 48, the SGLT2-I and non-SGLT2-I groups exhibited a deterioration rate of 13.6% (6/44) and 31.8% (14/44), respectively (p = 0.07) [Figure 5(b)].
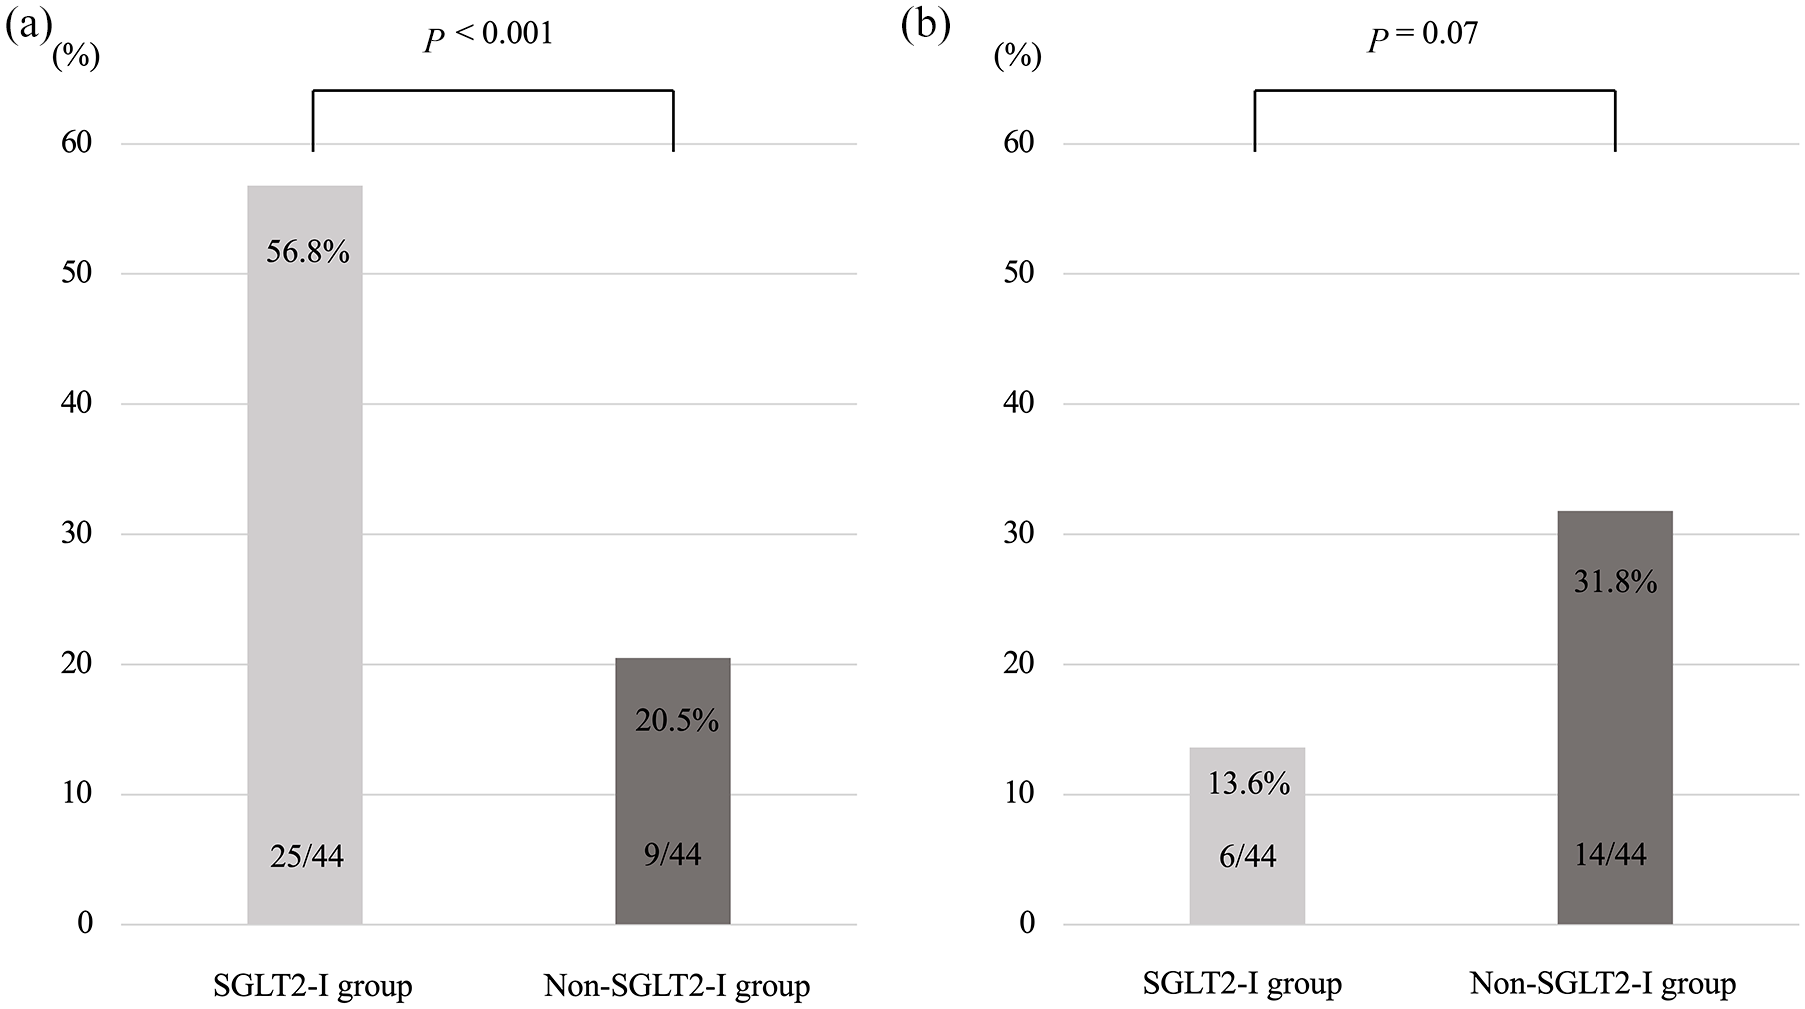
(a) Improvement and (b) deterioration rates for Fibrosis-4 index (FIB-4 index) 48 weeks after administration of an add-on oral hypoglycemic agent. Improvement in FIB-4 index was defined as a ⩾10% decline in FIB-4 index from baseline at week 48. Deterioration of FIB-4 index was defined as a ⩾10% increase in FIB-4 index from baseline at week 48.
Discussion
Current treatment guidelines established by the ADA and the EASD recommend metformin as the first-line treatment for T2DM. 8 However, no meta-analysis has conclusively demonstrated that metformin effectively improves liver inflammation and fibrosis in patients with NAFLD.33–36 Similarly, although DPP4 inhibitors have been widely used as the second-line treatment for T2DM, no conclusion has been reached regarding their effectiveness in improving liver pathology in patients with NAFLD.9,10 In contrast, SGLT2-Is have been reported to improve not only glycemic control but also liver inflammation and fatty changes in patients with NAFLD and T2DM,18–30 with studies showing SGLT-2-I as a novel therapeutic drug for such patients. However, most reports had a limited number of cases and/or short treatment durations (within 24 weeks). The current study showed that SGLT2-I improved glycemic control, decreased body weight, and reduced liver inflammation early after the initiation of administration in 56 patients with NAFLD who had T2DM, a finding consistent with that presented in previous reports.18–21,26 Improvements in these various parameters were observed with or without other OHAs prior to administration of SGLT2-I.
Moreover, after PS matching method to adjust for baseline characteristics in the SGLT2-I and non-SGLT2-I groups, our results showed a similar reduction in HbA1c between the two groups. In fact, it has been reported that SGLT2-I provides an equivalent or better improvement in glycemic control compared with other OHAs, such as metformin, sulfonylurea, and DPP4 inhibitors.37–39 However, the SGLT2-I group exhibited a significant decrease in body weight, ALT, uric acid, and FIB-4 index, whereas the non-SGLT2-I group, which mainly received metformin and DPP4 inhibitors, showed no such decrease. These additional effects of SGLT2-I suggest that it may serve as the first-line treatment for patients with NAFLD who have T2DM.
It is worth noting that the current study investigated the influence of SGLT2-I on liver fatty infiltration and fibrosis using transient elastography. While some studies utilized magnetic resonance imaging-proton density fat fraction to determine the liver fat-decreasing effect of SGLT2-I,25,26 others confirmed this using liver biopsy specimens in a limited number of patients.22,23 The present study observed a significant correlation between changes in liver fat (i.e. CAP) and body weight. Indeed, one study reported that a weight loss of 3–5% improved fatty changes in the liver of patients with NAFLD. 40 Meanwhile, other studies reported that SGLT2-I improved liver inflammation and decreased liver fat regardless of weight loss25,41 possibly through the following mechanisms: (1) the SGLT2-I-induced improvement in hyperglycemia and insulin resistance suppresses lipolysis of adipocytes, thereby inhibiting ectopic fat accumulation in the liver 41 and (2) β oxidation in the liver and very low-density lipoprotein secretion into the circulation are promoted through upregulation of the carnitine palmitoyltransferase 1a, peroxisome proliferator-activated receptor-α, and microsomal triglyceride transfer protein genes in hepatocytes.25,42 Indeed, the present study found that some patients without weight loss exhibited improvements in liver inflammation and CAP.
The effect of SGLT2-I on liver fibrosis in patients with NAFLD remains unclear. Liver biopsy-confirmed improvements in liver fibrosis was reported in five patients receiving canagliflozin for 24 weeks 22 and nine patients receiving empagliflozin for 24 weeks. 23 Although liver biopsy remains the gold standard for evaluating liver fibrosis, such a procedure is invasive, laborious, and occasionally risky. Therefore, the current study evaluated the effects of SGLT2-I on liver fibrosis using transient elastography, which has been considered useful in evaluating liver fibrosis in patients with NAFLD.43–46 However, previously reported results have been contradictory such that one study showed no significant change in LSM in 20 patients receiving SGLT2-I (mostly ipragliflozin) for 48 weeks, 24 whereas another revealed that LSM tended to decrease in 33 patients receiving dapagliflozin for 24 weeks, with such a tendency being stronger in patients with advanced liver fibrosis. 28 The results obtained in the present study were comparable to and supported the findings of the latter study.
There are some limitations in the current study. First, histological evaluation through liver biopsy, which remains the gold standard for definitively diagnosing NAFLD, was not performed. However, liver biopsy is invasive and difficult to perform repeatedly in the same patient. Given that liver fibrosis has been reported to be the most important factor for the prognosis of patients with NAFLD,47–49 we herein evaluated liver fibrosis using transient elastography instead of liver biopsy and demonstrated that SGLT2-I improved liver fibrosis. Second, considering that this was a retrospective observational study, complete removal of biases other than the matched factors is impossible. Third, we could not evaluate adverse events in this study. This study was targeted to patients who were able to receive OHAs for 48 weeks. At least, basically, there were no severe adverse events in this study. Finally, given that T2DM treatment was determined by each physician, decisions were not made based on unified treatment criteria.
In conclusion, the present study demonstrated that SGLT2-I administration improved not only glycemic control but also liver fatty infiltration and fibrosis in patients with NAFLD and T2DM, suggesting that SGLT2-I may be superior to other OHAs in improving liver histology.
Footnotes
Acknowledgements
The authors wish to thank all medical doctors from all institutions who were involved in this study.
Author contribution(s)
Taeang Arai: Conceptualization, Data curation, Methodology, Writing-original draft, Writing-review & editing.
Masanori Atsukawa: Conceptualization, Data curation, Methodology, Writing-original draft, Writing-review & editing.
Akihito Tsubota: Methodology, Writing-original draft, Writing-review & editing.
Shigeru Mikami: Investigation.
Hiroki Ono: Investigation.
Tadamichi Kawano: Investigation.
Yuji Yoshida: Investigation.
Tomohide Tanabe: Investigation.
Tomomi Okubo: Investigation.
Korenobu Hayama: Investigation.
Ai Nakagawa-Iwashita: Investigation.
Norio Itokawa: Investigation.
Chisa Kondo: Investigation.
Keiko Kaneko: Investigation.
Naoya Emoto: Investigation.
Mototsugu Nagao: Investigation, Writing-review & editing.
Kyoko Inagaki: Investigation.
Izumi Fukuda: Investigation.
Hitoshi Sugihara: Investigation.
Katsuhiko Iwakiri: Conceptualization, Project administration.
Conflict of interest statement
The authors declare that there is no conflict of interest.
Funding
This research received no specific grant from any funding agency in the public, commercial, or not-for-profit sectors.