
Abstract
Purpose:
In this study, we aimed to investigate the differences in the intrinsic functional connectivity (iFC) of the primary visual cortex (V1), based on resting-state functional magnetic resonance imaging (rs-fMRI), between patients with proliferative diabetic retinopathy (PDR) and healthy controls (HCs).
Methods:
In total, 26 patients (12 males, 14 females) with PDR and 26 HCs (12 males, 14 females), matched for sex, age, and education status, were enrolled in the study. All individuals underwent rs-fMRI scans. We acquired iFC maps and compared the differences between PDR patients and the HCs.
Results:
The PDR group had significantly increased FC between the left V1 and the right middle frontal gyrus (RMFG), and significantly reduced FC between the left V1 and the cuneus/calcarine/precuneus. In addition, the PDR patients had significantly increased FC between the right V1 and the right superior frontal gyrus (RSFG), and significantly reduced FC between the right V1 and the cuneus/calcarine/precuneus. The individual areas under the curve (AUCs) of FC values for the left V1 were as follows: RMFG (0.871, p < 0.001) and the cuneus/calcarine/precuneus (0.914, p < 0.001), while the AUCs of FC values for the right V1 were as follows: RSFG (0.895, p < 0.001) and the cuneus/calcarine/precuneus (0.918, p < 0.001).
Conclusions:
The results demonstrated that, in PDR patients, altered iFC in distinct brain regions, including regions related to visual information processing and cognition. Considering the rise in the diabetes mellitus incidence rate and the consequences of PDR, the results could provide promising clues for exploring the neural mechanisms related to PDR and possible approaches for the early identification of PDR.
Keywords
Introduction
Proliferative diabetic retinopathy (PDR) is a type of diabetic retinopathy (DR) which is refers to a retinal vascular disorder that occurs as a complication of diabetes mellitus (DM) and has been shown to be a frequent microvascular complication of DM and the most common cause of blindness in the working-age population.1,2 PDR refers to DR with retinal neovascularization, which is a severe stage in the course of DR. According to a global epidemiological survey, the overall prevalence of DR was 34.6%, and the overall prevalence of PDR was 6.81%. 3 The clinical features of PDR include neovascularization, vitreous hemorrhage, fibrovascular proliferation, vitreous organization and, in the most severe cases, tractional retinal detachment and blindness. 4 It has been confirmed in previous studies that vascular endothelial growth factor (VEGF) is associated with PDR.5,6 VEGF expression is induced by high glucose levels and hypoxia, and VEGF stimulates angiogenesis, increases collateral vessel formation, and increases microvasculature permeability.7,8 Generally, auxiliary examinations for PDR include optical coherence tomography, multifocal electroretinograms, and visual evoked potential assessments. Although neuroimaging-based diagnosis is not widely used for detecting PDR, neuroimaging-based investigation of PDR-related brain processes is a new aspect of visual neuroscience that may provide clues for exploring cerebral alterations related to DM-related diseases. Resting-state functional magnetic resonance imaging (rs-fMRI) is a technique for investigating anatomical and functional alterations in specific brain areas. It relies on cerebral blood flow and metabolism analysis. It has been applied and developed in eye diseases such as amblyopia, exotropia, and glaucoma to evaluate changes in brain activity.9–11 Seed-based functional connectivity (FC) analysis is a sensitive and efficient method that has been extensively used in rs-fMRI analyses. The primary visual cortex (V1) is situated in the occipital lobe, and it is the first and simplest region of the visual cortex that participates in perceptual activities. It receives visual input from the lateral geniculate nucleus, performs initial integration, and then delivers the information to other areas of the visual cortex for complex processing. Visual impairment is a common symptom in patients with DR. Previous studies have demonstrated that abnormal spontaneous FC is observed in patients with DM or DR.12,13 However, the intrinsic FC (iFC) alterations of the V1 in patients with PDR have rarely been reported. Thus, the objective of this study was to compare the FC of V1 and multiple cortical regions between PDR patients and healthy controls (HCs) using the seed-based FC method. This study might provide a more precise and exhaustive view of V1 FC in PDR patients, further helping to explore the cerebral manifestations of visual impairment.
Materials and methods
Participants
In total, 26 individuals with PDR (12 males and 14 females) were recruited. The inclusion criteria for PDR patients were: (a) at least one PDR characteristic, such as preretinal hemorrhage, vitreous hemorrhage, and neovascularization in the fundus; (b) imaging examinations showing signs of PDR; (c) fundus fluorescein angiography indicating signs of PDR (Figure 1); and (d) no other ocular diseases in bilateral eyes.

Example of PDR based on fundus colorized photography and FFA.
We also recruited 26 HCs (12 males and 14 females), matched for sex, age, and education status, were enrolled in this study. The inclusion criteria for HCs were: (a) no ocular disease history (DR, dry eye, strabismus, amblyopia, etc.); (b) able to undergo magnetic resonance imaging (MRI) scanning; (c) no addiction to drugs or alcohol; and (d) no psychiatric or neurological disorders.
The study was approved by the Medical Ethics Committee of the First Affiliated Hospital of Nanchang University (approval number: cdyfy2016023). The research abided by the Declaration of Helsinki. All participants took part voluntarily, signed informed consent forms, and understood the objective and risks of the study.
MRI parameters
MRI scanning was carried out with a 3-Tesla MRI scanner (Trio, Siemens, Munich, Germany). Rs-fMRI data were acquired in 8 min. High-resolution T1-weighted images were acquired with a three-dimensional (3D) spoiled gradient recalled-echo pulse sequence. All the functional images, including images of the whole cerebrum were obtained. 14 rs-fMRI data acquisition lasted for 8 min, and 240 resting-state volumes were acquired using the following parameters: repetition time (TR) = 2000 ms; echo time (TE) = 40 ms; flip angle = 90°; field of view (FOV) = 240 mm × 240 mm; matrix = 64 × 64; and slice thickness = 4 mm with a 1 mm gap. Each brain volume included 30 axial slices. High-resolution T1-weighted images for each subject were acquired with a 3D MRI sequence, and the parameters were as follows: TR = 1900 ms; TE = 2.26 ms; flip angle = 9°; FOV = 240 mm × 240 mm; matrix = 256 × 256; number of sagittal slices = 176; and slice thickness = 1 mm.
fMRI data processing
The statistical parametric map 8 (SPM8, http://www.fil.ion.ucl.ac.uk/spm) and the rs-fMRI Data Analysis Toolkit (REST, http://www.restfmri.net) were used to process the qualified data, while unqualified data were excluded. After excluding the first 10 time points, the remaining 230 volumes were to be analyzed. Head movement of greater than 2 mm maximum displacement in any of the x, y, or z directions or of greater than 2° angular rotation in any axis were excluded. The preprocessing steps are illustrated as follows: (1) the first ten time points were trimmed off due to the signal reaching equilibrium; (2) the remaining 230 volumes of functional BOLD images were corrected for slice timing effects, motion corrected and realigned. fMRI scans with more than 2 mm maximum displacement in any direction or more than 2° angular motion were discarded; (3) spatial normalized with re-sampling to 3-mm isotropic voxels. After smoothing with a 6-mm full width half maximum Gaussian kernel, the linear trend, the bandpass temporal filtering (0.01–0.08 Hz), and the covariates were then removed, including head motion parameters, whole brain, white matter, and cerebrospinal fluid signal. These details of preprocessing steps are presented in our previous study. 10
Seed-based FC analysis
FC analyses were performed, with the regions of interest (ROIs) being selected based on a published literature by Li et al. 15 We chose the center of V1 as the seed point, the Montreal Neurological Institute (MNI) V1 coordinates were –8, –76, 10 (left) and +7, –76, 10 (right), and the diameter of the ROI sphere was 10 mm (approximately 27 cubic voxels). Pearson correlation coefficients between the average time series of the PDR and the time series of all other cerebrum voxels were calculated. The differences in the FC between the two groups were compared using two-sample t-tests. The minimum cluster size necessary to be considered relevant is 26. A p < 0.01 for multiple comparisons, using the Gaussian random field correction (voxel-level 0.005, cluster-level 0.05), and the threshold of voxel-wise level of multiple comparisons, was considered to be statistically significant.
Statistical analysis
SPSS v20.0 (IBM Corp, Armonk, NY, USA) was used to compare the demographic and clinical data between PDR patients and HCs. Both two-sample t-test (for age and weight) and the Chi square test (for gender and handedness) were used, and p < 0.05 was deemed to be statistically significant.
A receiver operating characteristic (ROC) curve analysis was used to distinguish between PDR patients and HCs using the mean FC values for distinct cerebrum areas. The relationships between the mean FC values for distinct cerebrum areas and the manifestations in the PDR group were analyzed using Pearson correlation coefficients. A p < 0.05 was deemed to indicate a statistically significant difference.
Results
Demographic and clinical data
In total, 26 PDR patients (12 males, 14 females; mean age: 55.53 ± 5.83 years) and 26 HCs (12 males, 14 females; mean age: 54.34 ± 5.79 years) were included in the study. There were no significant differences in age (p = 0.871) or weight (p = 0.912) between the two groups. We observed significant differences in best-corrected visual acuity (BCVA)-right (p = 0.012) and BCVA-left (p = 0.016) between the PDR group and HCs. More details are shown in Table 1.
Demographics and clinical measurements of PDR and HC groups.
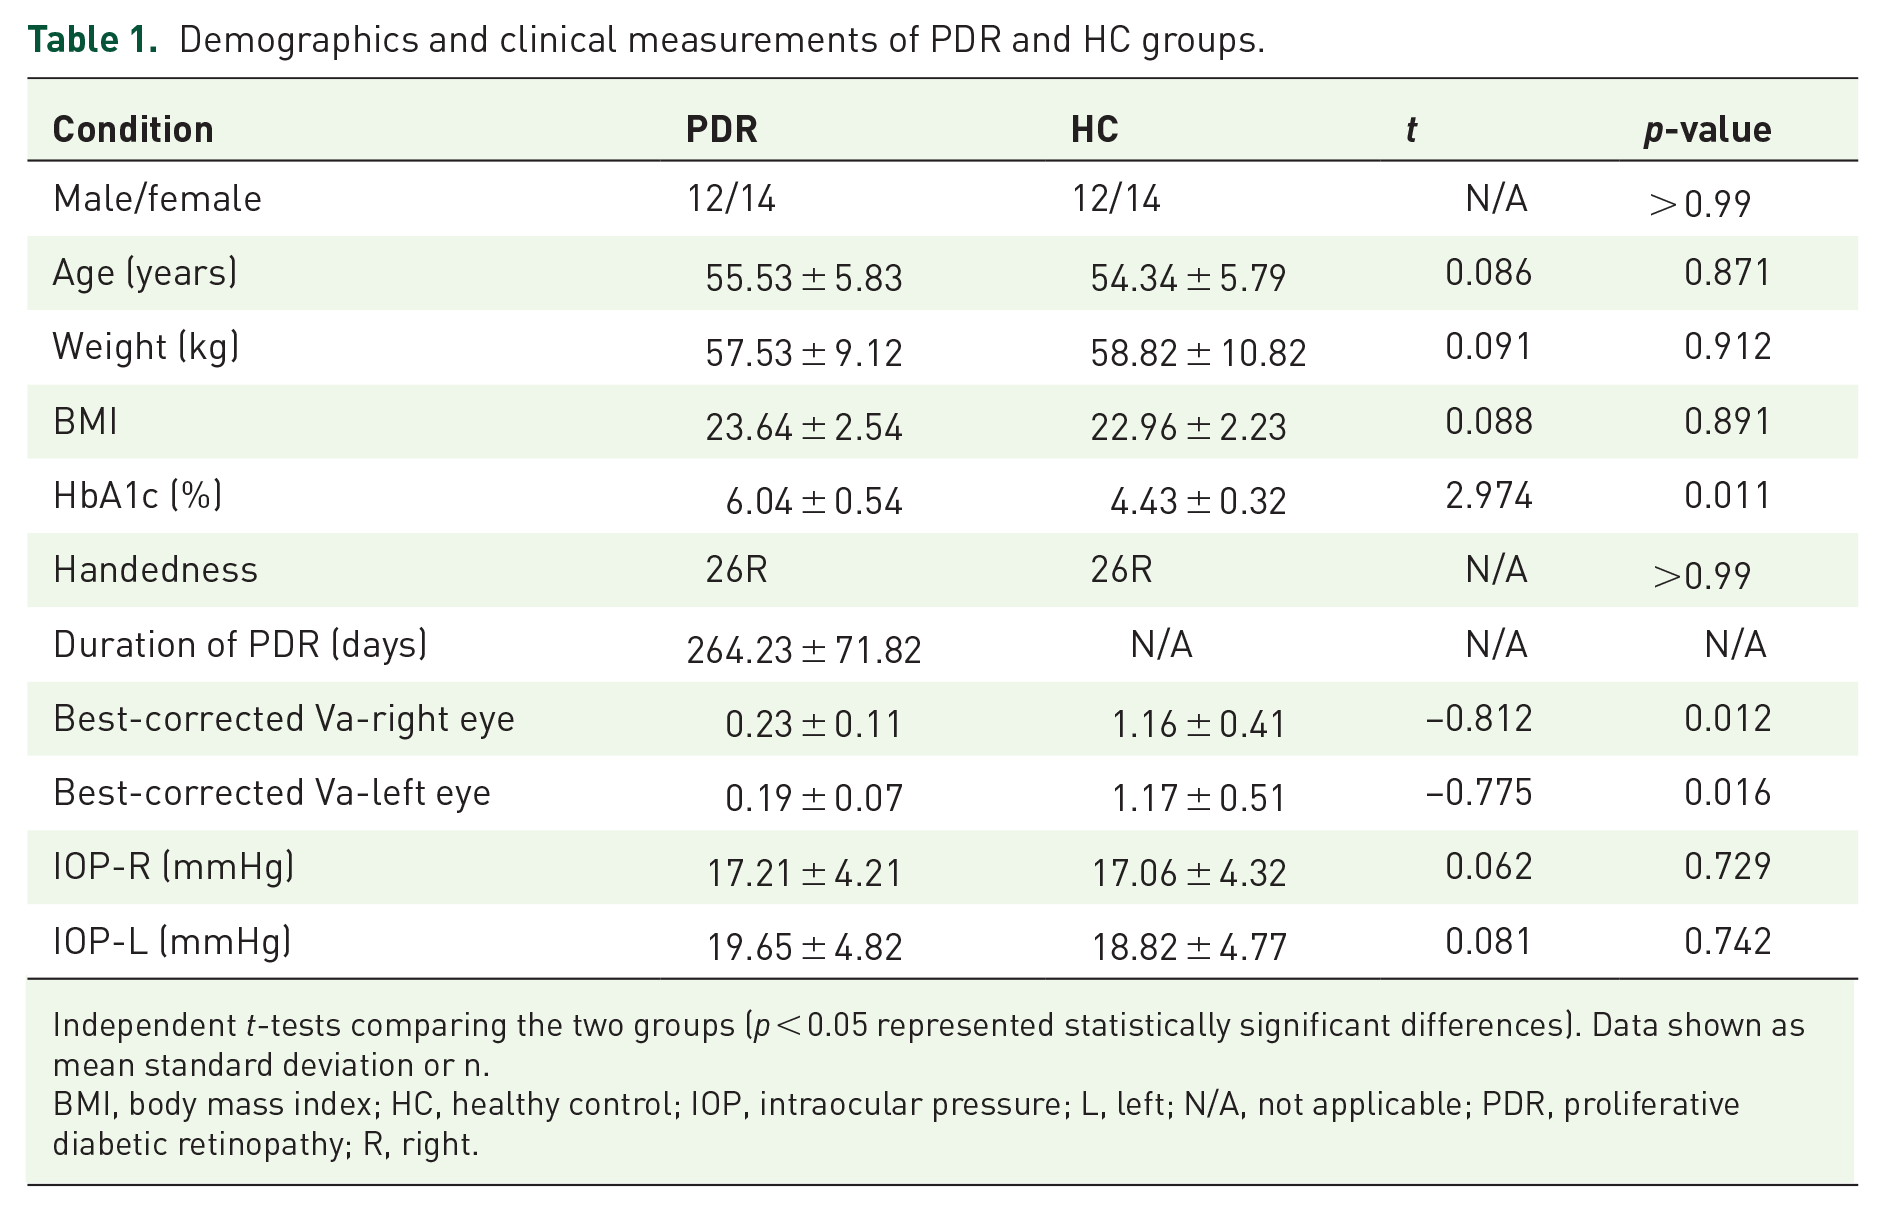
Independent t-tests comparing the two groups (p < 0.05 represented statistically significant differences). Data shown as mean standard deviation or n.
BMI, body mass index; HC, healthy control; IOP, intraocular pressure; L, left; N/A, not applicable; PDR, proliferative diabetic retinopathy; R, right.
FC differences
Compared with the HCs, the PDR group had significantly higher FC between the left V1 and the right middle frontal gyrus (RMFG; BA 10), and significantly decreased FC between the left V1 and the cuneus/calcarine/precuneus (BA 10) (Figure 2, Table 2). In addition, the PDR patients had significantly higher FC between the right V1 and the right superior frontal gyrus (RSFG; BA 10), and significantly decreased FC between the right V1 and the cuneus/calcarine/precuneus (BA 10) (Figure 3, Table 2). There were no significant correlations between the mean FC values for distinct cerebrum areas and their manifestations in PDR the group (p > 0.05).

Group differences in FC of the left V1 between PDR patients and HCs.

Group differences in FC of the right V1 between PDR patients and HCs.
Brain regions with significant differences in FC between PDR patients and HCs.

The statistical threshold was set at voxel with p < 0.01 for multiple comparisons using Gaussian random field corrected.
B, both; BA, Brodmann area; FC, functional connectivity; HC, healthy control; MNI, Montreal Neurological Institute; PDR, proliferative diabetic retinopathy; R, right.
ROC curve analysis
To verify whether differences in FC values could be used as diagnostic biomarkers to differentiate the PDR group from the HCs, an ROC curve analysis was performed to analyze the mean FC values for specific brain regions. The individual areas under the curve (AUCs) of FC values for the left V1 were as follows: RMFG (0.871, p < 0.001) and the cuneus/calcarine/precuneus (0.914, p < 0.001) (Figure 4A), while the AUCs of FC values for the right V1 were as follows: RSFG (0.895, p < 0.001) and the cuneus/calcarine/precuneus (0.918, p < 0.001) (Figure 4B).

ROC curve analysis of the mean FC values for altered brain regions.
Discussion
The results demonstrated that spontaneous brain activities of specific regions in PDR patients were different compared with those in HCs. The PDR patients exhibited significantly increased FC between the left V1 and the RMFG, and significantly decreased FC between the left V1 and the cuneus/calcarine/precuneus (Figure 5). In addition, the PDR patients exhibited significantly increased FC between the right V1 and the RSFG, and significantly decreased FC between the right V1 and the cuneus/calcarine/precuneus (Figure 6).

FC results of the left V1 in the PDR group. Compared with the HCs, the FC of the PDR group increased in the following region: 1 - RMFG (t = 4.0876), but decreased in the following regions: 2, 3, and 4 - cuneus/calcarine/precuneus (t = –6.149).

FC results of right V1 in the PDR group. Compared with the HCs, the FC of the PDR group increased in the following region: 1 - RSFG (t = 3.9464), but decreased in the following regions: 2, 3, and 4 - the cuneus/calcarine/precuneus (t = –5.4776).
PDR is a late stage of DR, with severe clinical features. In addition to typical clinical features such as neovascularization, vitreous hemorrhage, and fibrovascular proliferation. Previous studies have reported that some DR patients suffer cognitive impairment.16,17 The middle frontal gyrus, located between the inferior and superior frontal sulci in front of the precentral gyrus, constitutes almost one-third of the frontal lobe in humans. 18 The frontal eye field is situated around the intersection of the middle frontal gyrus and the precentral gyrus. Several studies have reported that the middle frontal gyrus is associated with visual processing and visual attention.19,20 Cui et al. found that type 2 DM (T2DM) patients had increased FC in the middle frontal gyrus in the anterior subnetwork. 21 In addition, several studies involving patients with retinal detachment and macular hole have reported precise frontal eye field activation in these patients,22,23 which suggests that there may be correlations between brain region alterations and clinical features of PDR.
The superior frontal gyrus is located in the superior part of the prefrontal cortex and mainly consists of Brodmann area (BA) 6, 8, 9, and 12. 24 It is generally responsible for a series of brain functions including cognitive processing and motor control.25–27 Because of the similarity in anatomy and physiology between retinal vessels and cerebral microvessels, clinically, DR is considered to represent diabetic encephalopathy. 28 There is a consensus that DM is an independent risk factor for Alzheimer’s disease, white matter degeneration, and other diseases. 29 According to a cross-sectional study in the United Kingdom, many T2DM patients exhibit a decrease in cognitive function when they first go for a consultation. 30 Coincidentally, clinical investigations have shown that PDR is associated with cognitive dysfunction such as impaired memory and learning ability.31,17 It may be valuable to detect and explore cognitive impairment in patients with DR, as DR is a common complication of DM.
In previous DM-related fMRI studies, researchers showed that the cerebrum structure and FC values were abnormal in T2DM patients, which might be correlated with cognitive impairment. 32 Peng et al. showed that T2DM patients with microangiopathy had a higher amplitude of low-frequency fluctuation (ALFF) values in cerebrum areas which are associated with cognition, including the frontal lobe. 33 In addition, Liu et al. revealed that T2DM patients with mild cognitive impairment had significantly increased regional homogeneity in the RSFG. 34 In the present study, the PDR patients had higher FC between the right V1 and the RSFG compared with the HCs. We speculated that this might represent a compensatory mechanism, with FC enhancements to compensate for decreases in other brain regions. A similar hypothesis was put forward in a previous study. 35 In addition, it can be inferred that visual impairment and cognitive dysfunction might be related to the altered FC.
The cuneus is a small wedge-shaped area of the cerebral cortex. It has an essential role in the visual pathway, being involved in spatial location. It has been reported that the cuneus interacts with V1 to encode visual information to the extrastriate cortices.36,37 The precuneus is located in the dorsal region of the posteromedial parietal lobe. It is known as an essential region associated with memory, spatial function, and navigation.38,39 The calcarine is situated below the parietooccipital sulcus and, functionally, it belongs to the visual center and visual cortex. 40 Several functional studies have revealed that these brain regions are altered in ophthalmological diseases and DM. Huang et al. reported a significant reduction of brain neural homogeneity in the cuneus in patients with retinal detachment. 23 Similarly, acute open globe injury patients exhibited a reduction of brain neural homogeneity in the cuneus. 41 Xia et al. revealed that the ALFF value decreased in both the precuneus and the cortex related to vision in T2DM patients, which confirmed that there are abnormal spontaneous activities in distinct cerebrum regions in these patients. 42 A clinical study of patients with retinal degeneration found that the calcarine showed significant atrophic changes. 43 Based on the results of the above studies and the present study, the FC decrease between the bilateral V1 and the cuneus/calcarine/precuneus might suggest functional deficiency in PDR patients.
The FC method has been widely utilized in patients with ophthalmological diseases (Table 3) and has good prospects regarding its future applications and development. In this study, the mean FC values of specific ROIs were analyzed using ROC curves. ROC curve analysis is an effective statistical method for differentiating patients from HCs. It has been widely applied in medical research due to its specificity and sensitivity. The AUC values, which denote accuracy, of all cerebrum regions (including the RMFG, RSFG, and cuneus/calcarine/precuneus) were >0.8, and some of them reached 0.9, which indicates that the accuracy was excellent (Figure 4). Although the ROC-curve shows that resting-state V1 functional connectivity differentiates between PDR patients and controls, future studies need to be performed to show if these measures can also be used to different T2DM patients without PDR from those with PDR and T2DM patients with background DR from those patients with PDR.
FC method applied in ophthalmological diseases.

FC, functional connectivity.
There are still several limitations in this study. First, the number of subjects was relatively small, which may influence the validity of the results. Increasing the sample size may improve the validity of the study. Second, PDR represents a late stage of DR rather than a specific symptom. We did not subdivide the PDR patients based on their symptoms, which may have added uncertainty to the results.
Conclusion
In conclusion, this study showed altered iFC in distinct brain regions, including regions related to visual information processing and cognition, in PDR patients. Considering the rise in the DM incidence rate 50 and the consequences of PDR, the results could provide promising clues for exploring the neural mechanisms related to PDR and possible approaches for the early identification of PDR.
Footnotes
Author contribution(s)
Conflict of interest statement
This was not an industry supported study. The authors report no conflicts of interest in this work.
Ethics approval
The study was approved by the Medical Ethics Committee of the First Affiliated Hospital of Nanchang University, and the ethics (approval number: is cdyfy2016023). The research abided by the Declaration of Helsinki. All participants took part voluntarily, signed informed consent forms, and understood the objective and risks of the study.
Funding
The authors disclosed receipt of the following financial support for the research, authorship, and/or publication of this article: National Natural Science Foundation of China (No: 81660158,81460092, 81400372); Natural Science Key Project of Jiangxi Province (No: 20161ACB21017)