
Abstract
Objective:
Our aim was to examine the incidence and risk factors of type 2 diabetes mellitus (T2DM) among individuals with different fasting plasma glucose (FPG) levels.
Methods:
According to the first FPG value recorded between January 2006 and December 2017, individuals without T2DM (FPG <7 mmol/L) were divided into three groups: normal fasting glucose (NFG, FPG < 5.6 mmol/L), slightly impaired fasting glucose (IFGlow, 5.6 mmol/L ⩽ FPG < 6.1 mmol/L), and severely impaired fasting glucose (IFGhigh, 6.1 mmol/L ⩽ FPG < 7.0 mmol/L). Physical examination results, blood biochemical indicators, and questionnaire survey data were collected and the T2DM incidence was examined during the follow-up period. A Cox regression model was used to analyze the T2DM risk factors in the three groups.
Results:
A total of 44,852 individuals (55.33% men) were included in our study. During the follow-up period (mean follow-up time: 3.73 ± 0.01 years), 2912 T2DM cases occurred. The T2DM incidence rate of the NFG, IFGlow, and IFGhigh groups were 1.5%, 22.2%, and 43.8%, respectively (p < 0.05). In the NFG group, the risk factors for T2DM were older age, overweight, obesity, hypertension, hyperuricemia, and increased estimated glomerular filtration rate (eGFR); the protective factors were female sex and high high-density lipoprotein cholesterol (HDL-C). In the IFGlow group, the risk factors for T2DM were older age, overweight, obesity, hypertension, and high total cholesterol (TC); the protective factors were increased triglyceride, low-density lipoprotein cholesterol (LDL-C), and HDL-C. In the IFGhigh group, the risk factors for T2DM were older age, obesity, high eGFR, and high TC; the protective factors were female sex, hyperuricemia, high LDL-C, and high HDL-C (all, p < 0.05).
Conclusions:
The increased T2DM rates were associated with increased FPG. Risk factors for T2DM vary in the NFG, IFGlow, and IFGhigh groups.
Introduction
It was estimated that there were 451 million (18–99 years old) patients with diabetes worldwide in 2017 and that diabetes mortality among individuals 20–99 years old was at 5 million. Global medical expenditure for patients with diabetes is estimated to be US$850 billion. 1 The prevalence of diabetes in China is grave; 2 a national epidemiologic survey in mainland China calculated it to be approximately 12.75%. 3 Impaired fasting glucose (IFG) marks the early stage of diabetes mellitus. In 1997, the American Diabetes Association (ADA) defined 6.1 mmol/L ⩽ fasting plasma glucose (FPG) < 7.0 mmol/L as IFG, 4 and in 2003, the lower limit was adjusted to 5.6 mmol/L. 5 However, the World Health Organization (WHO) still recommends that 6.1 mmol/L ⩽ FPG < 7.0 mmol/L should be the diagnostic value for IFG. 6 Yip et al. conducted a literature review based on the WHO and ADA diagnostic criteria, and the results showed that the incidence of IFG for Asians was 29.2% and 48.1%, respectively. 7 Previous studies have shown that older age, overweight, obesity, hypertension, and triglyceride (TG) levels are significantly associated with an increased risk of developing diabetes. 8 Tirosh et al. investigated whether a high blood glucose level can independently predict the risk of developing type 2 diabetes mellitus (T2DM) in young adults with FPG < 5.6 mmol/L. Studies have shown that FPG levels close to the upper normal limit may be associated with the body mass index (BMI), TG levels, and elevated risk of T2DM in healthy men. 9 In 2018, Bernd et al. studied the risk of developing T2DM in a pre-diabetic population. The results showed that the 10-year incidence of diabetes was 14.4% in the population with 5.6 mol/L ⩽ FPG < 6.1 mmol/L and higher than 40% in the population with 6.1 mmol/L ⩽ FPG < 7.0 mmol/L. This indicated that the higher the FPG level, the higher the risk of diabetes in patients with IFG. 10 However, it is not clear whether there are differences in diabetes risk factors among individuals with different FPG levels, even though identifying diabetes risk factors in individuals with different FPG levels could contribute to the accurate prevention of T2DM.Therefore, in this study, we aimed to evaluate the incidence and risk factors of T2DM at different FPG levels to provide a reference for the accurate prevention of T2DM.
Materials and methods
Study population
Individuals who were examined at the Beijing Medical Center from January 2006 to December 2017 were screened for participation in this study. Participants were included in the study if they were older than 16 years old and had records of at least three physical examinations and an initial recorded FPG level < 7.0 mmol/L. We excluded individuals with (a) diabetes, cardiovascular and cerebrovascular diseases, liver and kidney diseases, and family history of diabetes or (b) missing data on important variables such as age, sex, FPG levels, and clinical laboratory indicators. A total of 44,852 individuals (mean age: 38.48 ± 11.87 years, mean follow up time: 3.73 ± 0.01 years) were enrolled in the study, including 24,717 men and 20,035 women, with a male to female ratio of 1.24:1. The initially recorded FPG levels were taken as the baseline, and the participants were divided into three groups accordingly, as follows: normal fasting glucose (NFG, FPG < 5.6 mmol/L), slightly impaired fasting glucose (IFGlow, 5.6 mmol/L ⩽ FPG < 6.1 mmol/L), and severely impaired fasting glucose (IFGhigh, 6.1 mmol/L ⩽ FPG < 7.0 mmol/L). Physical examination was performed at follow-up points (between January 2006 and December 2017); participants diagnosed with T2DM discontinued follow up when they were found to have FPG levels > 7.0 mmol/L, as per the Chinese Guidelines for the Prevention and Treatment of T2DM (2017 edition). The last record was used to calculate the incidence of T2DM, and the difference between the initial medical examination date and the last follow-up date was used as the follow-up time. This study was approved by the ethics committee of the Beijing Physical Examination Center (Beijing, China), and each participant signed informed consent (ethics approval ID: 201802).
Data collection and measurement
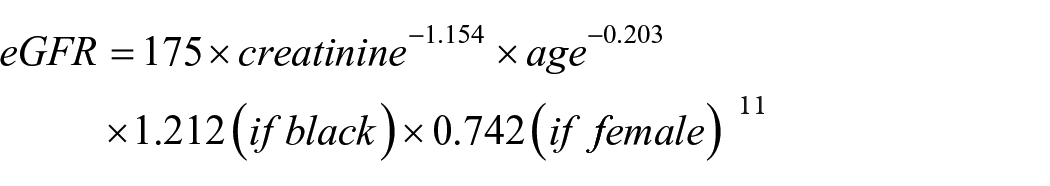
Physical examination results, blood biochemical indicators, and questionnaire survey data of individuals in the Beijing Physical Examination Center from January 2006 to December 2017 were collected. Physical examination and blood biochemical indicators test were completed by the professional medical staff of the Beijing Physical Examination Center and the questionnaire was questioned by trained investigators. Physical examination mainly included height, weight, and blood pressure (BP). Laboratory biochemical indicator tests consisted of FPG, TG, serum total cholesterol (TC), uric acid (UA), creatinine (CRE), low-density lipoprotein cholesterol (LDL-C) and high-density lipoprotein cholesterol (HDL-C). The questionnaire contained information about age, sex, history of diabetes mellitus and hypertension, and family history. Weight and height were measured on an empty stomach. BP was measured after participants sat more than 5 min in the morning with an empty stomach or at least 15 min if they had blood drawn before the measurement of BP. Desktop sphygmomanometer and appropriate size of the cuff were selected to measure the right upper arm brachial artery BP of sitting position with the arm placed flat on the tabletop, which was equal height to the heart. Blood samples were collected after an overnight fast for at least 8 h and transported to the laboratory by a specially assigned person for centrifugation within 2 h. Beckman AU5400 automatic biochemical analyzer was used to detect blood biochemical indicators and unified reagents and methods were used in all batches. The detection indexes comprised of FPG, TG, TC, HDL-C, LDL-C, UA, and CRE. FPG was determined by the glucose oxidase method, TC and TG by enzyme method, and HDL-C and LDL-C by the direct method. UA was determined by uricase method, and CRE by sarcosine oxidase method. Estimated glomerular filtration rate (eGFR) was estimated using the abbreviated Modification of Diet in Renal Disease equation:
Definition of diseases
T2DM was defined as FPG ⩾ 7.0 mmol/L according to the 1999 WHO diagnostic criteria. 8 Other diseases were defined as follows: overweight (BMI ⩾ 24 kg/m2 but <28 kg/m2); obesity (BMI ⩾ 28 kg/m2), 12 hypertension [systolic blood pressure (SBP) ⩾ 140 mmHg and/or diastolic blood pressure (DBP) ⩾ 90 mmHg], 13 dyslipidemia (TC ⩾ 6.2mmol/L or TG ⩾ 2.3 mmol/L or HDL-C < 1.0 mmol/L or LDL-C ⩾ 4.1mmol/L), 14 hyperuricemia (serum uric acid, SUA ⩾ 360 μmol/L in women or SUA ⩾ 420 μmol/L in men under normal purine diet). 15
Statistical methods
Data were analyzed using SPSS 24.0 software. If the quantitative data conformed to the normal distribution, the mean ± standard deviation description was used, otherwise, the median and interquartile range (IQR) were used. For multi-group comparison, if the distribution was normal and the variance homogeneous, then variance analysis was used. Otherwise, the nonparametric rank sum test was used.
The absolute values and percentages were used to describe the enumeration data, and the χ2 test was used to compare the difference between groups. The Cox proportional hazard regression model was used to construct a predictive model for the incidence of T2DM in people with different FPG levels. The trend of T2DM incidence was tested by Linear-by-Linear Association. The test level was set to α = 0.05, and p < α was considered to be statistically significant.
Results
Baseline
According to the baseline FPG level, the participants were divided into three groups: 37,789 in the NFG group (84.25%), 3381 in the IFGlow group (7.54%), and 3682 in the IFGhigh group (8.21%). Univariate analysis showed that the distribution of sex, age, BMI, hypertension, dyslipidemia, and hyperuricemia was significantly different among the three groups (all, p < 0.001, Table 1).
Baseline characteristics of the participants in different FPG level.

BMI, body mass index; FPG, fasting plasma glucose; IFGhigh, severely impaired fasting glucose; IFGlow, slightly impaired fasting glucose; NFG, normal fasting glucose.
Description and analysis of clinical indicators showed that there were significant differences in height, weight, BMI, SBP, DBP, TG, TC, UA, CRE, eGFR, LDL-C, and HDL-C levels among the NFG, IFGlow, and IFGhigh groups (all, p < 0.001). Except for HDL-C levels, the remaining indicators in the IFGlow and IFGhigh groups were higher than those in the NFG group (Table 2).
Clinical characteristics of subjects with different FPG level at baseline.

BMI, body mass index; CRE, creatinine; DBP, diastolic blood pressure; eGFR, estimated glomerular filtration rate; FPG, fasting plasma glucose; HDL-C, high-density lipoprotein cholesterol; IFGlow, slightly impaired fasting glucose; IFGhigh, severely impaired fasting glucose; IQR, interquartile range; LDL-C, low-density lipoprotein cholesterol; NFG, normal fasting glucose; SBP, systolic blood pressure; TC, total cholesterol; TG, triglyceride; UA, uric acid. H statistics was calculated by Kruskal-Wallis test.
Incidence of T2DM
A total of 2912 patients (6.49%) with T2DM were identified in the overall population, 2169 of whom were men, accounting for 74.5% of the population. The incidence of T2DM in men was significantly higher than that in women (p < 0.05, Table 3). The T2DM incidence in the NFG, IFGlow, and IFGhigh groups were 1.5%, 22.2%, and 43.8%, respectively (p < 0.05). The incidence of T2DM increased with age in the three groups (Table 4).
Incidence of T2DM in the population.

T2DM, type 2 diabetes mellitus.
Incidence of T2DM in different age groups.

IFGhigh, severely impaired fasting glucose; IFGlow, slightly impaired fasting glucose; NFG, normal fasting glucose; T2DM, type 2 diabetes mellitus.
Risk factors associated with the onset of T2DM
A Cox regression model was used to analyze the risk factors of T2DM in the NFG, IFGlow, and IFGhigh groups, and the results showed that the risk factors of T2DM differed among the groups. The factors in the T2DM predictive model of NFG group included age, gender, overweight, obesity, hypertension, hyperuricemia, eGFR, and HDL-C, with female sex and high HDL-C being protective predictors. The predictors of T2DM in the IFGlow group were age, overweight, obesity, hypertension, TG, TC, HDL-C, and LDL-C. Of these, increased TG, LDL-C, and HDL-C were protective predictors. The factors in the T2DM prediction model of the IFGhigh group were age, gender, obesity, hyperuricemia, eGFR, TC, HDL-C, and LDL-C, of which female sex, hyperuricemia, high LDL-C, and HDL-C levels were protective predictors (Table 5).
Risk factors for T2DM of subjects with different FPG level.

BMI, body mass index; CI, confidence interval; eGFR, estimated glomerular filtration rate; FPG, fasting plasma glucose; HDL-C, high-density lipoprotein cholesterol; HR, hazard ratio; IFGhigh, severely impaired fasting glucose; IFGlow, slightly impaired fasting glucose; LDL-C, low-density lipoprotein cholesterol; NFG, normal fasting glucose; T2DM, type 2 diabetes mellitus; TC, total cholesterol; TG, triglyceride.
Discussion
Our study showed that the higher the FPG level, the greater the risk of developing T2DM; furthermore, the risk factors and risk of developing T2DM differed among the FPG groups.
Incidence of T2DM
As shown in Table 4, 1.5%, 22.15%, and 43.8% of the NFG, IFGlow, and IFGhigh groups, respectively, developed diabetes. The risk of T2DM in the IFGhigh group was significantly higher than that in the IFGlow group and the risk of T2DM in the IFGlow group was significantly higher than that in the NFG group, suggesting that the higher the FPG level, the higher the risk of developing T2DM in individuals without diabetes. This result is consistent with that of a study by Bernd et al, who showed that the risk of diabetes in an IFGlow population was 14.4% [95% confidence interval (CI): 9.7–20.5] and that it was 47.4% (95% CI: 32.8–66.2) in an IFGhigh population. 10 Therefore, it appears that the risk of developing T2DM is increased in individuals with high FPG levels.
Risk factors of T2DM
The incidence of T2DM is closely related to lifestyle and dietary habits. Studies have shown that individuals with IFG can delay or prevent the occurrence of T2DM by receiving appropriate lifestyle interventions.16,17 The Daqing study in China found that 6 years after lifestyle intervention, the cumulative risk of T2DM was reduced; the incidence of cardiovascular and cerebrovascular events and cardiovascular mortality could also be reduced.18,19 The investigation of T2DM risk factors among individuals with different FPG levels will help them appreciate their own risk factors and change their living and eating habits to effectively reduce their risk of developing T2DM.
We found that there were differences in the risk factors and risk of developing T2DM in individuals with different FPG levels. The following sections discuss these in relation to age, obesity, blood lipid levels, and blood pressure.
Age and obesity
As shown in Table 5, age and obesity were found to be common risk factors for the NFG, IFGlow, and IFGhigh groups but the risk differed among the groups. In different age groups with the same IFG level, the older the age, the greater the risk of T2DM. The hazard ratio (HR) of T2DM was the highest in the NFG group in individuals 60 years old or older at 4.16 (95% CI: 2.85, 6.07). A previous study showed that the OR of T2DM was 4.14 (95% CI: 1.75–9.19) for individuals 65 years old or older, which is close to our result. 8 The risk of T2DM in young individuals should not be neglected because although it is lower than that in older individuals, some studies have shown that the risk of all-cause death increased by 1.2–1.3 fold and that of coronary heart disease increased by 1.6 fold when T2DM was diagnosed 10 years earlier. 20 Moreover, younger patients with T2DM were more likely to be obese than those with late-life diabetes, showing more adverse lipid distribution, higher glycosylated hemoglobin, and faster deterioration of blood sugar control. 21 T2DM in overweight/obese patients may be due to the presence of islet cell antibodies 22 or due to increased intra-abdominal visceral fat, resulting in the release of serum free fatty acids that interfere with insulin metabolism. 23 Some studies have reported the relative risk value between BMI and the onset of T2DM at 6.88; 22 our study also showed that obesity was a common risk factor in the NFG, IFGlow, and IFGhigh groups, but the risk differed among the groups. With the increase of FPG level, the obesity HR gradually decreased. In the NFG group, the odds ratio (OR) was the highest at 3.73 (95% CI: 2.91–4.79). This suggests that early weight control is beneficial and valuable for preventing the onset of T2DM.
Blood pressure and blood lipids
In terms of blood pressure, the results of Emdin et al. showed that for every 20 mmHg increase in SBP, the risk of new-onset diabetes increased by 58%, and the strength of the association decreased with BMI and age. 24 Our results also suggested that hypertension may increase the risk of developing T2DM, but have different effects on different FPG levels. Hypertensive individuals in the NFG group and IFGlow group had a 1.65-fold and 1.46-fold greater risk for developing T2DM, respectively.
In terms of blood lipid levels, our results showed that HDL-C was a common protective factor for the NFG, IFGlow, and IFGhigh groups. LDL-C was a protective factor for the IFGlow and IFGhigh groups. TG was a protective factor for the IFGlow group. The relationship between blood lipid levels and T2DM onset is still controversial. For example, the Framingham Heart Study showed that the prevalence of elevated TG in patients with diabetes was higher than that in individuals without diabetes, suggesting that TG may be a risk factor for T2DM. 25 However, Yamauchi et al. contested that hypertriglyceridemia is not an independent risk factor for beta cell dysfunction in T2DM. 26 In addition, in the Caucasian population, the TG/HDL-C ratio can be used as a marker of T2DM insulin resistance; however, this relationship is not the case in non-Caucasian populations. This difference may be due to different clinical characteristics among ethnic groups. 27 Considering the relationship between HDL-C and T2DM incidence, studies have shown that the incidence of HDL-C reduction in diabetic patients is almost twice as high as that in individuals without diabetes, 28 suggesting that reduction of the HDL-C level may be a risk factor for T2DM. This study also found that HDL-C was a protective factor against the onset of T2DM. In the relationship between LDL-C and the onset of T2DM, Adam et al. showed that total LDL-C may not be able to predict diabetes because LDL-C components seem to be converted to LDL-C granules, which are associated with a greater risk of cardiovascular disease. 29 Other studies have shown that the prevalence of elevated LDL-C is not significantly different between patients with diabetes and individuals without diabetes, 25 but our study suggests that LDL-C could be a protective factor against the development of T2DM. Therefore, the relationship between blood lipids and T2DM requires further study.
The strength of this study is that individuals without diabetes were divided into three groups according to FPG levels and the incidence and risk factors of T2DM were studied in each group to provide a basis for accurate prevention of diabetes. The limitation of this study is that there are few questionnaires, and T2DM is closely related to living and eating habits. Therefore, more information on living and eating habits should be included to investigate the risk factors of T2DM more widely.
In conclusion, this study showed that the higher the FPG level, the greater the risk of developing T2DM; it also revealed that T2DM risk factors for individuals vary with different FPG levels. Considering that diabetes is a chronic disease that can be controlled by the patient’s daily habits and self-management ability, individuals with different FPG levels should consider their own risk factors and control their body weight, blood pressure, and lipid status to reduce the risk of developing T2DM and improve their overall health.
Footnotes
Author contribution(s)
Conflict of interest statement
The authors declare that there is no conflict of interest.
Funding
The authors disclosed receipt of the following financial support for the research, authorship, and/or publication of this article: Capital’s Funds for Health Improvement and Research (2018-2-2242)