
Abstract
Objective
To investigate the risk factors of medication nonadherence in patients with type 2 diabetes mellitus (T2DM) and to establish a risk nomogram model.
Methods
This retrospective study enrolled patients with T2DM, which were divided into two groups based on their scores on the Morisky Medication Adherence scale. Univariate and multivariate logistic regression analyses were used to screen for independent risk factors for medication nonadherence. A risk model was then established using a nomogram. The accuracy of the prediction model was evaluated using centrality measurement index and receiver operating characteristic curves. Internal verification was evaluated using bootstrapping validation.
Results
A total of 338 patients with T2DM who included in the analysis. Logistic regression analysis showed that the educational level, monthly per capita income, drug affordability, the number of drugs used, daily doses of drugs and the time spent taking medicine were all independent risk factors for medication nonadherence. Based on these six risk factors, a nomogram model was established to predict the risk of medication nonadherence, which was shown to be very reliable. Bootstrapping validated the nonadherence nomogram model for patients with T2DM.
Conclusions
This nomogram model could be used to evaluate the risks of drug nonadherence in patients with T2DM.
Introduction
Diabetes Mellitus (DM) is a common metabolic disease, which is characterized by high blood glucose caused by a lack of insulin secretion or insufficient response of peripheral tissues to insulin. 1 Type 2 diabetes mellitus (T2DM) accounts for more than 90% of DM patients. 2 According to a survey by the US Centers for Disease Control and Prevention in 2020, the number of DM patients in the US was as high as 34.2 million. 3 There are approximately 420 million DM patients worldwide and the number of patients is expected to reach 642 million by 2040. 4 The latest epidemiological data for DM and prediabetes in China were published in 2013. 5 In 2013, 10.9% of Chinese residents suffered from DM, 6 which was lower than previously published data for China (11.6%) from 2010; 6 but was close to the prevalence of 12–14% reported for the US in 2011–2012.6,7 The prevalence of prediabetes in China was 35.7%, with an estimated population of 388 million. 6 At present, the main treatment of DM is drug treatment. However, there is evidence that 55% of patients do not know how to use drugs correctly, 80% of patients have never been told of the possible side-effects and 30–50% of patients have poor medication adherence. 8 Medication nonadherence is affected by multiple factors such as socioeconomic factors (social stress, emotional problems, marital status, family harmony), condition-related factors (health status, work strength, medical insurance), therapy-related factors (medicine dose, type of medicine, medicine amount, side-effects, medicine-related questions) and patient-related factors (age, sex, employment, income, education level, distance to hospital). 9 Considering the number of associated risk factors for medication adherence, accurate tools for predicting drug nonadherence so that early interventions can be used might offer the most effective way to prevent drug nonadherence.
This current study used univariate and multivariate logistic regression analyses to screen for independent risk factors for medication nonadherence in a Chinese population of patients with T2DM. A risk model was then established using the nomogram model and the accuracy of the prediction model was evaluated using centrality measurement index (C-index) and receiver operating characteristic (ROC) curves. Internal verification was evaluated using the bootstrapping validation method.
Patients and methods
Study population
This retrospective study enrolled consecutive patients with T2DM treated in the Department of Gastroenterology, Lu’an Hospital Affiliated to Anhui Medical University, Lu’an, Anhui Province, China between October 2017 and September 2018. The inclusion criteria were as follows: (i) patients that met the clinical diagnostic criteria for DM based on the 2017 American Diabetes Association Guidelines; 10 (ii) patients that provided informed consent to participate. The exclusion criteria were as follows: (i) patients with major medical history or impaired vital organ function; (ii) patients with a history of mental illness or no cognitive function; (iii) patients with coagulopathy; (iv) patients not treated with a basal bolus insulin regimen; (iv) incomplete patient information or medical records.
This study was approved by the Ethics Committee of Lu’an Hospital Affiliated to Anhui Medical University, Lu’an, Anhui Province, China (February 2017, China; lot number: Six Medical Ends [2017] No. [006]). Written informed consent was obtained from all patients. The reporting of this study conforms with the STROBE statement. 11 This study has de-identified all patient data.
Adherence assessment questionnaire
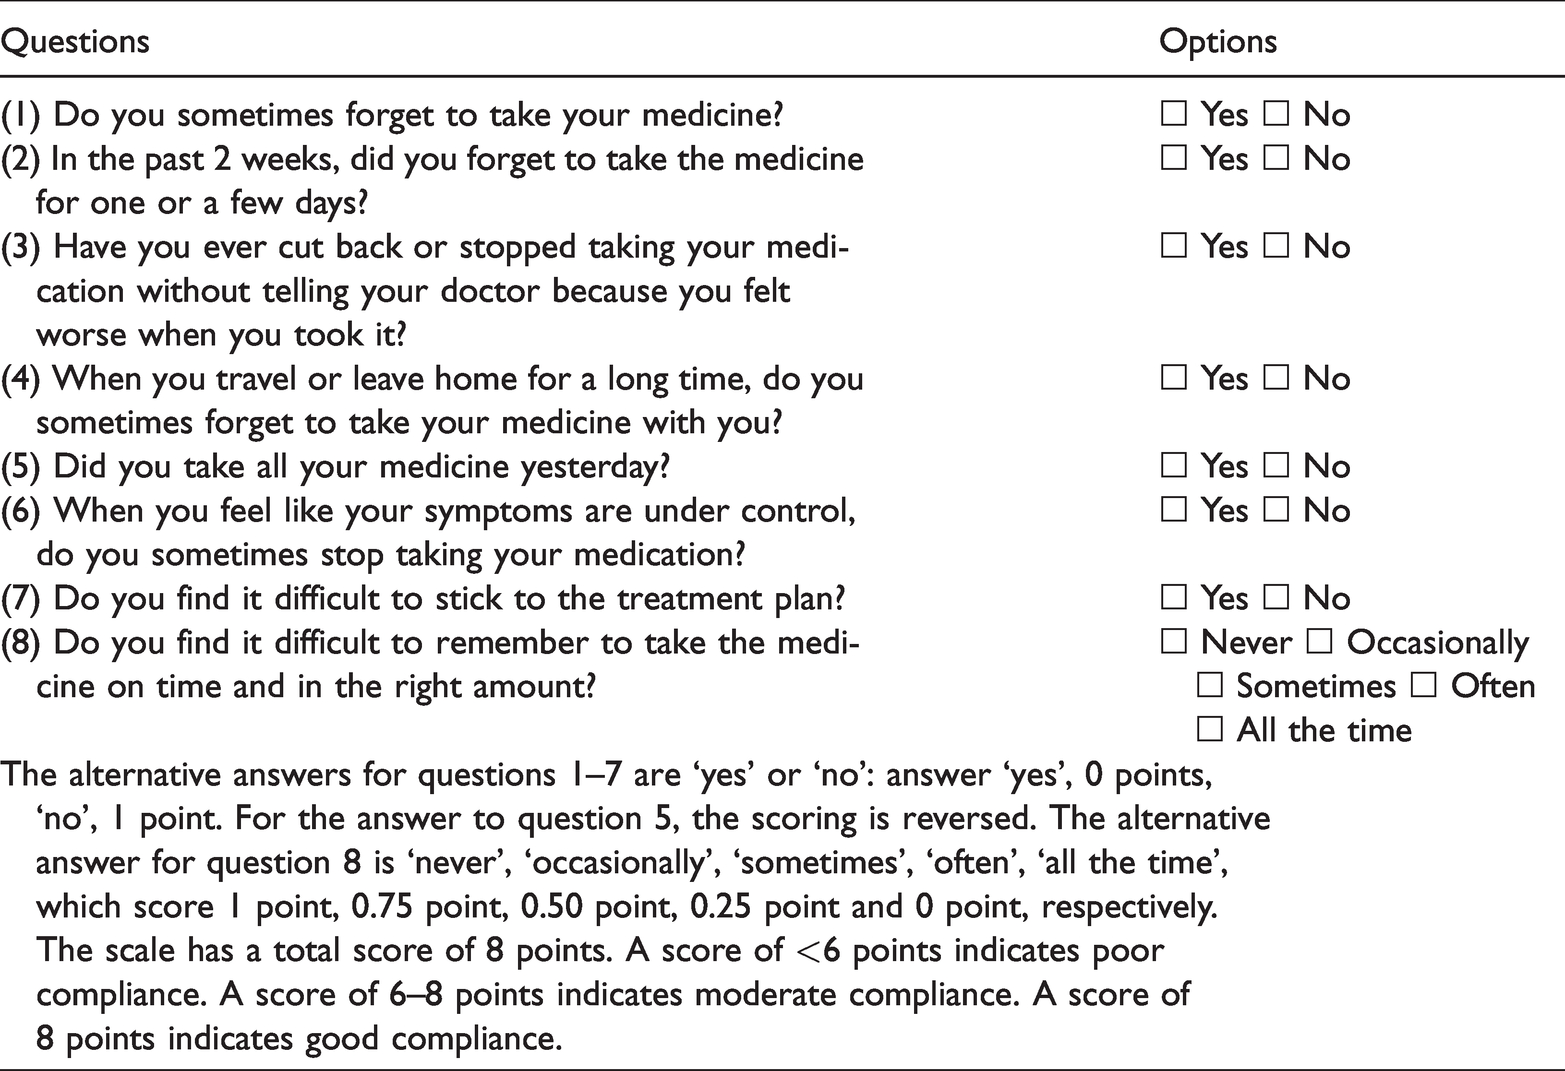
The Morisky Medication Adherence Questionnaire was used for the adherence assessment (Table 1). 12 Note that the questionnaire collected from patients by the authors included slightly modified wording to the exact scale below, in accordance with licensing terms. The questionnaire containseight questions: (1) Do you sometimes forget to take medicine?; (2) People sometimes miss taking their medications for reasons other than forgetting. Thinking over the past 2 weeks, were there any times when you did not take your medication?; (3) Have you ever cut back or stopped taking your medication without telling your doctor because you felt worse when you took it?; (4) When you travel or leave home, do you sometimes forget to bring along your medication?; (5) Did you take the medicine yesterday?; (6) When you feel that your diabetes is under control, do you sometimes stop taking your medication?; (7) Taking medication exactly as prescribed is a real inconvenience for some people. Do you ever feel hassled about sticking to your treatment plan?; (8) How often do you have difficulty remembering to take all of your medications? MMAS-8: low adherence is less than 6, 6 to less than 8 is categorized as medium adherence and 8 is categorized as high adherence for MMAS-8.
The Morisky Medication Adherence Scale.
Data collection
In addition to the Morisky Medication Adherence Questionnaire, other risk-related data were collected according to a review of the literature. 13 Data included each patient's personal demographic data (sex, age, negative emotion, monthly per capita income, marital status). Negative emotion was assessed using the Hamilton Anxiety Scale (HAMA) and the Hamilton Depression Scale (HAMD) (24-item version) to assess anxiety and depression.14,15 The HAMA covers 14 items and if the score is >14 points then the patient is considered to have anxiety. A HAMD score >20 points is indicative that depression is present. A HAMA score >14 points or a HAMD score >20 points was considered as being indicative of negative emotion.14,15 Family and social factors (family reminder of medication, family attention to treatment, family financial support and medical insurance) and drug factors (the number of drugs used, the number of insulin injections used, the number of times of daily medication, the time spent in taking drugs and adverse drug reactions) were also included. 16 The entire research process was conducted following confidentiality regulations. Detailed explanation of the research objectives and methods was provided to the patients.
Statistical analyses
All statistical analyses were performed using IBM SPSS Statistics for Windows, Version 20.0 (IBM Corp., Armonk, NY, USA). Categorical data were analysed using χ2-test. The screening factors were selected using a logistic regression equation. The score model was determined using R language to draw the nomogram. The Bootstrap method was used to repeat the sampling 1000 times for the internal verification of the nomogram model. Harrell C-statistics were used to calculate the C-index to evaluate the distinction degree of the model. A P-value <0.05 was considered statistically significant.
Results
This retrospective study enrolled 338 patients with T2DM. Of these 338 patients, 203 were male and 135 were female. The mean ± SD age was 49.82 ± 9.85 years (range, 39–67 years). Among the patients with T2DM, 226 patients had good medication adherence and 112 patients had poor medication adherence. There were significant differences between the two groups in educational level, monthly per capita income, negative emotion, family members reminding patient to take medicine, drug affordability, the number of drugs used, daily doses and time spent in taking medicine (P < 0.05 for all comparisons) (Table 2). There were no significant differences between the other characteristics.
Demographic and clinical characteristics of the patients (n = 338) with type 2 diabetes mellitus (T2DM) that were included in this study to identify the risk factors for medication nonadherence.

Data presented as n of patients (%).
aCategorical data were compared using χ2-test; NS, no significant between-group difference (P ≥ 0.05).
A binary logistic regression analysis was conducted on the general clinical data, including educational level, monthly per capita income, negative emotions, family reminders of medication, affordability of medication, types of medication, number of daily doses and time spent in taking medicines. The results showed that there was no statistical difference between negative emotions and family reminders of medication. Multivariate logistic regression analyses demonstrated that educational level (odds ratio [OR] 1.615, 95% confidence interval 95% [CI] 1.150, 2.268), monthly per capita income (OR 1.619, 95% CI 1.126, 2.329), drug affordability (OR 1.933, 95% CI 1.328, 2.812), the number of drugs used (OR 1.726, 95% CI 1.035, 2.876), the number of daily doses (OR 0.479, 95% CI 0.311, 0.737) and the time spent in taking medicine (OR 2.083, 95% CI 1.216, 3.566) were an independent risk factor for medication nonadherence in patients with T2DM (P < 0.05) (Table 3).
Results of multivariate logistic regression analysis of the risk factors for medication nonadherence in patients (n = 338) with type 2 diabetes mellitus.

As shown in Figure 1, this study established a nomogram model to predict the risk of medication nonadherence in T2DM patients through six independent risk factors: education level, monthly per capita income, drug affordability, number of drugs used, number of daily doses and time spent in drug taking. As shown in Figure 2, the predicted value verified was basically consistent with the observed value, which indicates that the nomogram prediction model in this study was very reliable. At the same time, the bootstrap internal verification method was used to verify the nomogram model for medication nonadherence in patients with T2DM. As shown in Figure 3, the C-index was 0.749 (95% CI 0.720, 0.778). It was shown that the nomogram model of this study was accurate and precise (Figure 4).
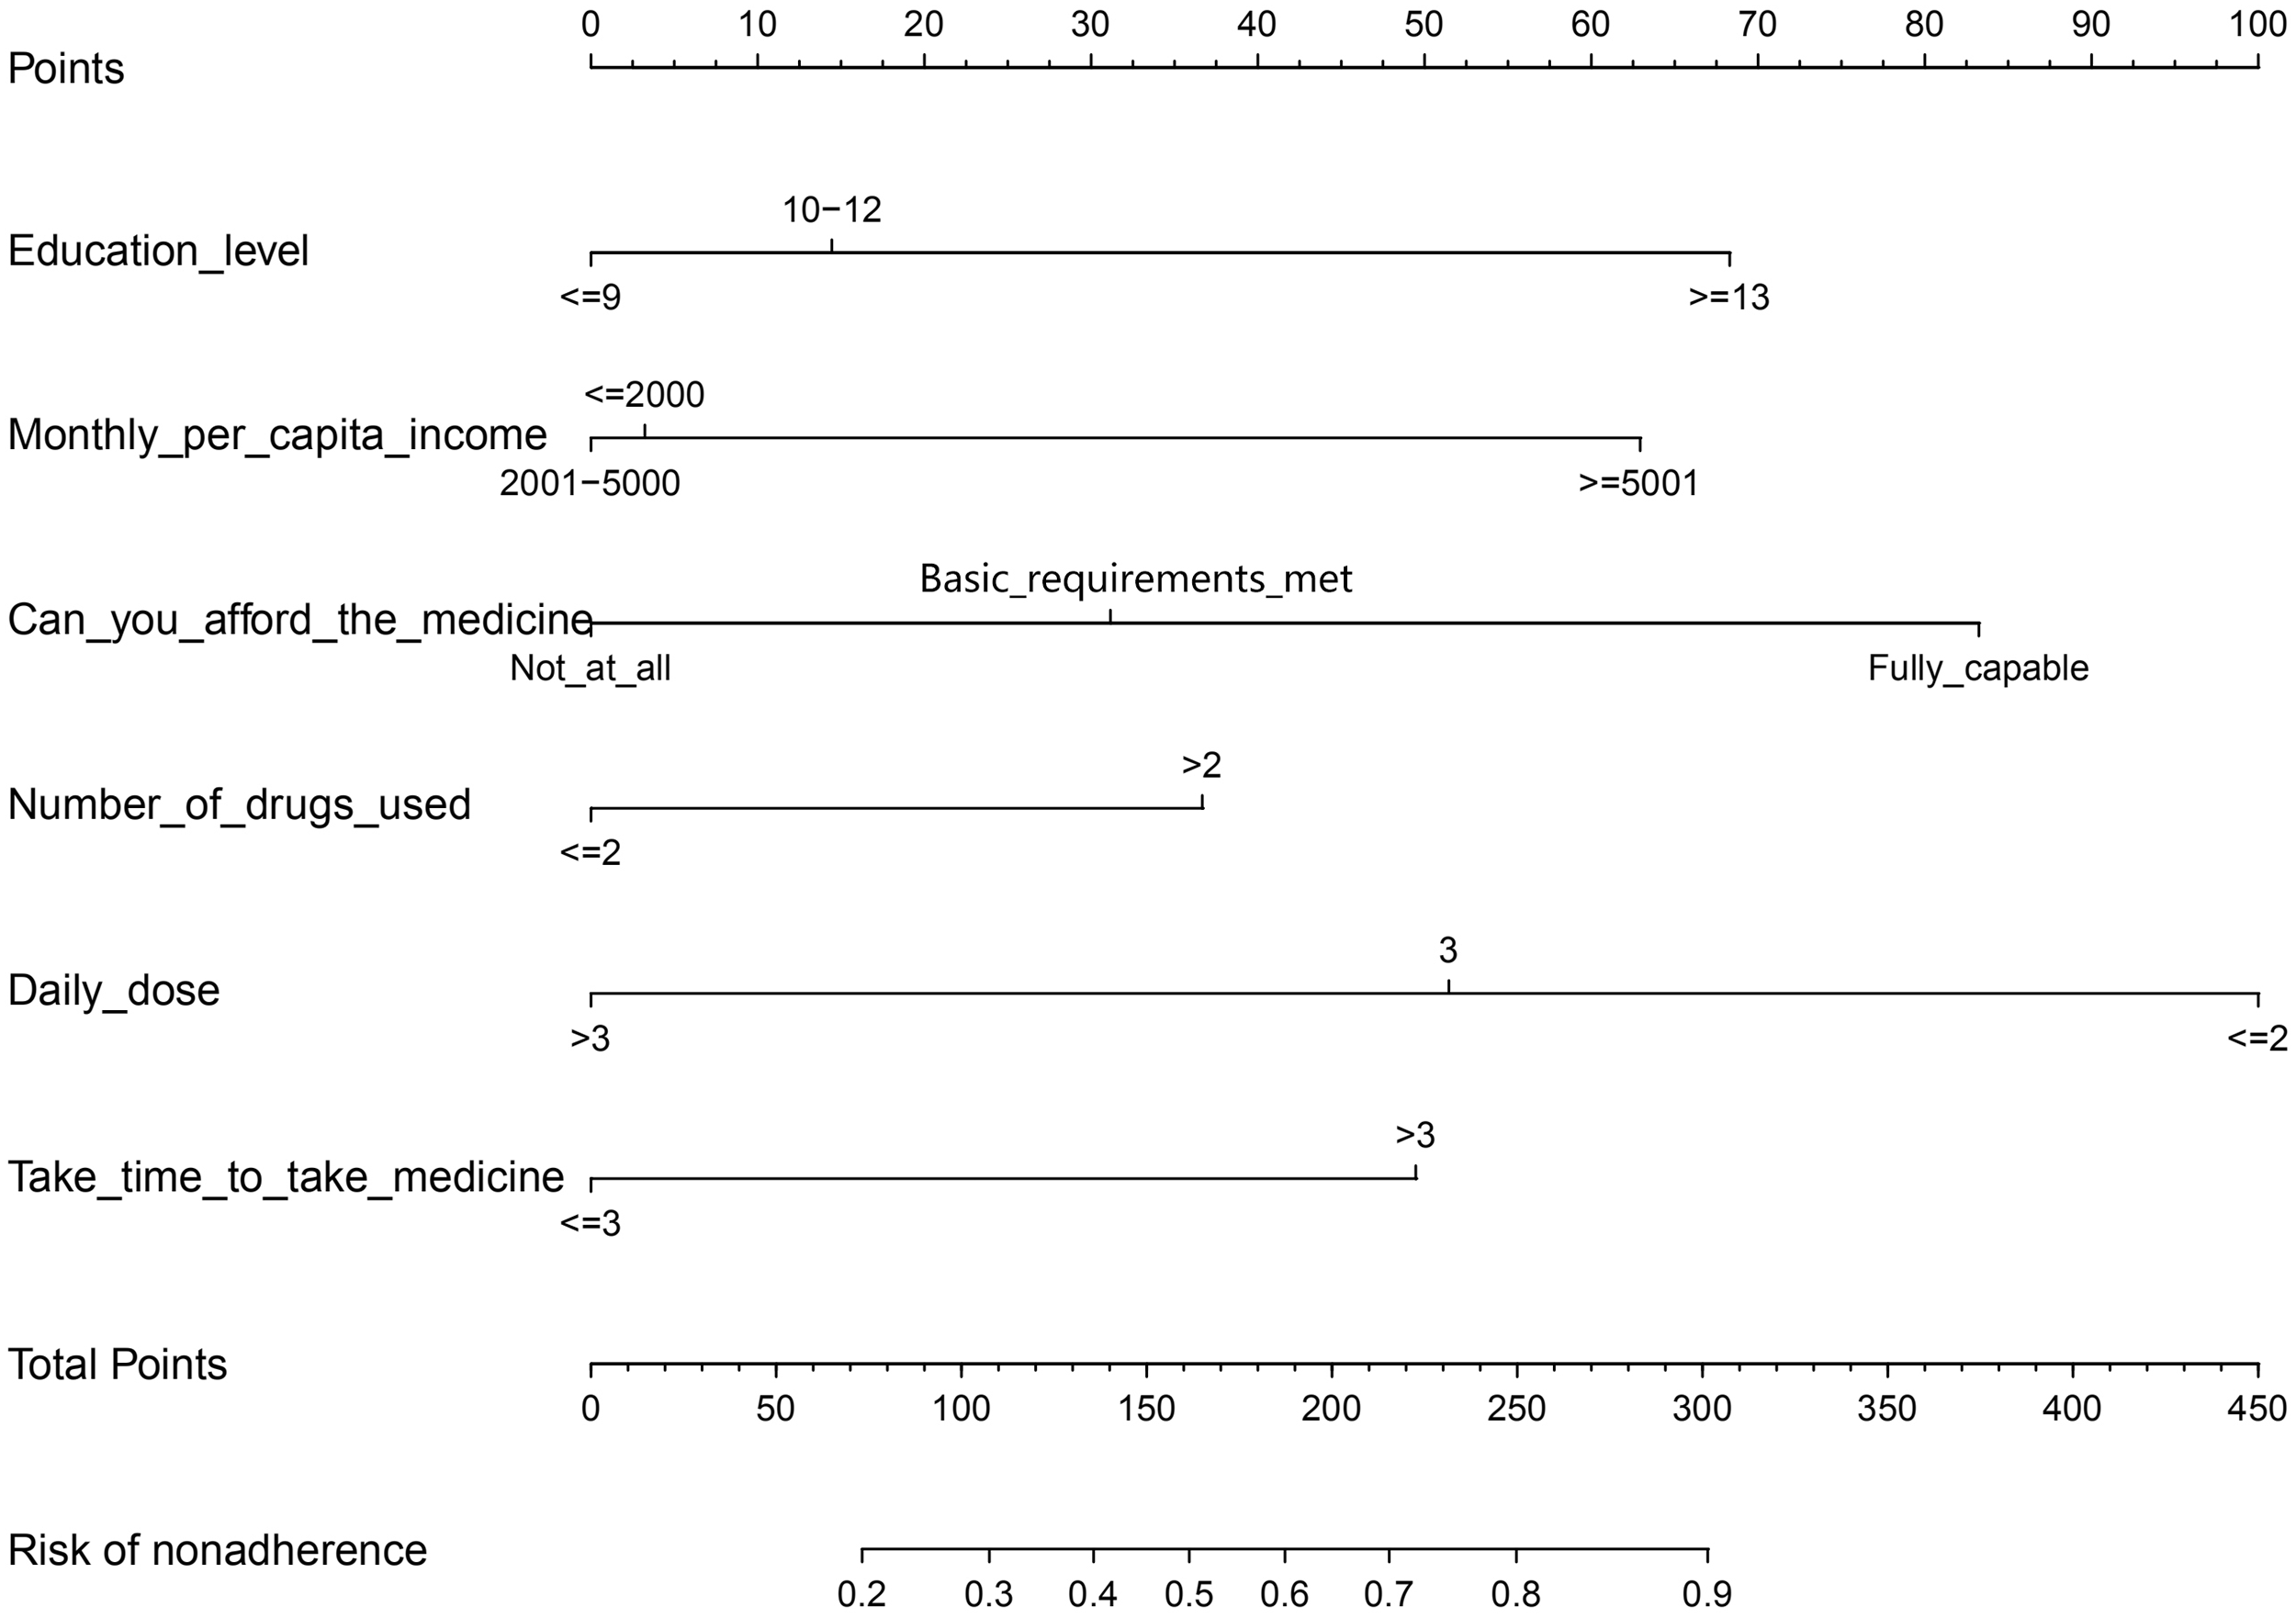
Establishment of a nomogram risk model for predicting medication nonadherence in patients with type 2 diabetes mellitus.

Validation of the nomogram model for predicting medication nonadherence risk in patients with type 2 diabetes mellitus. The y-axis measures the net benefit. The dotted line represents the medication nonadherence risk nomogram. The thin solid line represents the assumption that all patients are nonadherent to medication. The thick solid line represents the assumption that no patients are nonadherent to medication. The decision curve showed that if the threshold probability of a patient and a doctor is 32 and 84%, respectively, using this nonadherence nomogram in the current study to predict medication nonadherence risk adds more benefit than the intervention-all-patients scheme or the intervention-none scheme. The colour version of this figure is available at: http://imr.sagepub.com.

The nomogram model predicted the receiver operating characteristic curve of medication nonadherence in patients with type 2 diabetes mellitus. AUC, area under the curve. The colour version of this figure is available at: http://imr.sagepub.com.

Calibration curve of nomogram model for predicting medication nonadherence in patients with type 2 diabetes mellitus. B = 1000 repetitions, boot mean absolute error = 0.019, n = 338. The x-axis represents the predicted medication nonadherence risk. The y-axis represents the actual diagnosed nonadherence. The diagonal dotted line represents a perfect prediction by an ideal model. The solid line represents the performance of the nomogram, of which a closer fit to the diagonal dotted line represents a better prediction.
Discussion
Nomogram modelling is a reliable statistical tool that is widely used and can be qualified for most clinical event prediction models.17,18 It adopts a very intuitive chart representation method, which makes it very simple and easy to interpret the risk model.19,20 In this current study, a risk prediction model was established for medication nonadherence in patients with T2DM by using a nomogram. The verification of the model by ROC curve, bootstrap internal verification method and C-index demonstrated that the predicted value and the observed value were basically consistent, indicating that the nomogram prediction model of this current study was reliable. This model may be used to guide clinicians in making appropriate treatments for patients with T2DM. During the establishment of the model, six risk factors were screened and identified to predict the risk of medication nonadherence, which were the level of education, monthly per capita income, affordability of drugs, number of drugs used, number of daily doses and time taken to take medicine. Based on the nomogram model, among the six risk factors, the number of daily doses was the largest risk factor, followed by the ability to afford the drugs, and then the educational level, the monthly per capita income, the time taken to take the medicine and the number of medicines used.
In this current study, the problems related to drugs were the most key factors affecting drug adherence, which showed that the patient adherence score was negatively correlated with drug factors such as the number of daily doses, the number of drugs used and the time spent on taking drugs. That is, the more times patients take drugs per day, the more types they take and the longer it takes to take their drugs, the worse their adherence. Similar results were found in patients with hypertension 21 and hyperthyroidism. 22 Previous research found that excessive oral medication not only reduced patients' drug adherence, but also further negatively affected their quality of life. 23 These studies suggest that clinicians should adopt sustained-release and compound preparations to reduce the number of times, types and dosage of medication, so as to improve patients' drug adherence and improve the therapeutic effect.22,23 Studies on the treatment of various chronic diseases have found that large prescription quantity by physicians can increase patients' psychological burden, which is significantly negatively correlated with drug adherence.24–26 Patients' poor medication adherence and unsatisfactory treatment effect lead indirectly to the increase of prescription quantity. 27 Moreover, the increase of prescription quantity further decreases the adherence of patients, thus forming a vicious cycle.
Similar to previous studies, the educational level, monthly per capita income and affordability of drugs were also closely related to the patient's medication adherence.28,29 The higher the educational level and the higher the income, the higher the adherence. 30 The reasons for why patients with a higher educational level have better drug adherence might be as follows. First, they have a greater ability and willingness to acquire knowledge related to diseases and are more knowledgeable about the necessity of taking medicine according to prescription. Secondly, the understanding of the side-effects of the drugs is objective rather than exaggerated, so they have the willingness to insist on taking drugs. In addition, low drug affordability may lead to poor adherence, which is consistent with the monthly per capita income level. Higher monthly per capita income results in better drug adherence suggesting that low income and high medication costs are risk factors for poor adherence. 31 Although increasing medication adherence will increase the cost of medication for patients, it actually creates potential cost savings by reducing the likelihood of hospitalization and emergency visits in the long run. 32 Therefore, in order to improve the impact of economic factors on patients' drug adherence, the government should increase the national health care budget, decrease drug prices and elevate the drug reimbursement ratio to provide affordable and effective healthcare for patients with chronic diseases such as T2DM, hypertension and cardiovascular diseases.
The nomogram is a graph with visualized line segments that is based on multifactor regression analysis, integrates multiple clinical indicators and is used to predict the probability of a certain clinical outcome. Although there are many research reports of this kind,33,34 none of the research reports can really be used for practical clinical needs. 35 The nomogram model of this current research can be used by clinicians for the evaluation of nonadherence risk in the Chinese type 2 diabetes mellitus population.
This current study had several limitations. First, all of the patients were from the same hospital and the sample size was limited. The differences in epidemiology and clinical behaviour of different races were not considered. Secondly, because of the subjective problems of patients, the results of the scale may be biased. 36 This model needs to be further validated with other clinical data from different geographical areas and countries. A larger and more diverse sample is required for external validation to evaluate the reliability of this model.
In summary, this current retrospective study developed a large database by collecting and collating previous clinical data from patients with T2DM. Through statistical analysis of these data, a novel mathematical model for predicting the risk of medication adherence in patients with T2DM was established. This nomogram prediction model may will help clinicians to make individualized medication adherence risk predictions for each patient with T2DM to guide the development of follow-up treatment options.
Footnotes
Declaration of conflicting interest
The authors declare that there are no conflicts of interest.
Funding
The authors disclosed receipt of the following financial support for the research, authorship, and/or publication of this article: This study was supported by the Natural Science Foundation of China (no. 81773105), the Natural Science Foundation of Anhui Province (no. 1708085MH181), the Anhui Medical University Research Fund (no. 2019xkj220) and the Research Project of Lu'an Hospital Affiliated to Anhui Medical University (no. 2020kykt06).