
Abstract
Background:
Different genetic and environmental factors can explain the heterogeneity of obesity-induced metabolic alterations between individuals. In this study, we aimed to screen factors that predict metabolically healthy (MHP) and unhealthy (MUP) phenotypes using genetic and lifestyle data in overweight/obese participants.
Methods:
In this cross-sectional study we enrolled 298 overweight/obese Spanish adults. The Adult Treatment Panel III criteria for metabolic syndrome were used to categorize MHP (at most, one trait) and MUP (more than one feature). Blood lipid and inflammatory profiles were measured by standardized methods. Body composition was determined by dual-energy X-ray absorptiometry. A total of 95 obesity-predisposing single-nucleotide polymorphisms (SNPs) were genotyped by a predesigned next-generation sequencing system. SNPs associated with a MUP were used to compute a weighted genetic-risk score (wGRS). Information concerning lifestyle (dietary intake and physical activity level) was collected using validated questionnaires.
Results:
The prevalence of MHP and MUP was 44.3% and 55.7%, respectively, in this sample. Overall, 12 obesity-related genetic variants were associated with the MUP. Multiple logistic regression analyses revealed that wGRS (OR = 4.133, p < 0.001), total dietary fat [odds ratio (OR) = 1.105, p = 0.002], age (OR = 1.064, p = 0.001), and BMI (OR = 1.408, p < 0.001) positively explained the MUP, whereas female sex (OR = 0.330, p = 0.009) produced a protective effect. The area under the receiver operating characteristic curve using the multivariable model was high (0.8820). Interestingly, the wGRS was the greatest contributor to the MUP (squared partial correlation = 0.3816, p < 0.001).
Conclusions:
The genetic background is an important factor explaining MHP and MUP related to obesity, in addition to lifestyle variables. This information could be useful to metabolically categorize individuals, as well as for the design/implementation of personalized nutrition interventions aimed at promoting metabolic health and nutritional wellbeing.
Keywords
Introduction
The global prevalence of obesity has been increasing at an alarming rate in recent decades, being considered as a major public health concern; not only in developed countries, but also in many transitionary countries. 1 Approximately, 1.9 billion adults are estimated as overweight worldwide, and at least 650 million are classified as obese according to body mass index (BMI) cut-offs according to World Health Organization (WHO) criteria. 2
Obesity is recognized as an important risk factor in the onset and development of metabolic complications and chronic diseases such as insulin resistance, dyslipidemia, hypertension, inflammation, cardiovascular diseases, and type 2 diabetes mellitus. 3 However, the presence of metabolically healthy (MHP) or metabolically unhealthy (MUP) phenotypes varies widely among obese participants regardless of the degree of excessive adiposity. 4 In this context, apparently a subset of patients with obesity may display a metabolically healthy phenotype (MHP) characterized by insulin sensitivity similar to normal-weight individuals, as well as normal blood pressure and safe lipid and inflammatory profiles. 5
Although the mechanisms underlying the heterogeneity of obesity-induced metabolic interindividual alterations are still not clearly understood, evidence suggests that genetic predisposition and lifestyle factors can influence such phenotypes. 6 Accordingly, genetic variants mapped to lipid regulatory genes 7 and adiponectin8,9 have been associated with MUP in obese individuals. Moreover, dietary fat and vegetable intakes, as well as physical activity and sleep patterns have been identified as independent predictors of MHP in some populations.10,11 Nonetheless, these factors could differ between populations, which makes it important to undertake more studies that allow the timely categorization of obesity phenotypes and improvement of therapeutic decision making. The aim of this study was to identify factors that explain a MUP using genetic and lifestyle data in participants with excessive adiposity for personalized precision interventions to facilitate diagnosis, characterization, and therapeutic prescriptions.
Materials and methods
Participants
In this cross-sectional study we enrolled 298 Spanish adults with overweight (BMI: 25–29.9 kg/m2) or obesity (BMI: 30–40 kg/m2), who were recruited at the Center for Nutrition Research of the University of Navarra, Pamplona, Spain. Major exclusion criteria included a clinical history of cardiovascular disease, type 1 diabetes, or type 2 diabetes treated with insulin; pregnant or lactating women; unstable dose of medication for hyperlipidemia or hypertension; and weight change > 3 kg within 3 months before the study. This investigation was approved by the Research Ethics Committee of the University of Navarra (reference number 132/2015) and followed the ethical principles for medical research in humans from the 2013 Helsinki Declaration. 12 In addition, participants signed consent to participate in the study [ClinicalTrials.gov identifier: NCT02737267].
Anthropometry and blood pressure
Habitual anthropometric measurements such as height, body weight, and waist circumference (WC) were collected by trained nutritionists following standardized procedures. 13 BMI was calculated as the ratio between body weight and squared height (kg/m2). Total body fat (TFAT) and visceral fat (VFAT) were quantified by dual-energy X-ray absorptiometry (DXA) following the supplier’s instructions (Lunar Prodigy, software version 6.0, Madison, WI, USA). Systolic blood pressure (SBP) and diastolic blood pressure (DBP) were measured using an automated sphygmomanometer according to accepted WHO/International Society of Hypertension criteria. 14
Biochemical measurements
Overnight fasting blood samples (10 ml) were drawn by venipuncture and serum was obtained by centrifugation for further processing. Appropriate commercial kits were used to determine glucose, total cholesterol (TC), high-density lipoprotein cholesterol (HDL-c), and triglycerides in the chemistry analyzer Pentra C-200 (HORIBA ABX, Madrid, Spain). Low-density lipoprotein cholesterol (LDL-c) was calculated following the Friedewald equation: 15 LDL-c = TC – (triglycerides/5)–HDL-c. Also, plasma concentrations of adiponectin, insulin, leptin, tumor necrosis factor alpha (TNF-α), and high-sensitive C-reactive protein (CRP) were measured using specific enzyme-linked immunosorbent assays and read in a fully automated analyzer system (Triturus, Grifols, Barcelona, Spain). The homeostatic model assessment–insulin resistance (HOMA-IR) index was calculated according to the Matthews formula: 16 fasting insulin (µU/l) × fasting glucose (nmol/l)/22.5. Furthermore, the triglyceride–glucose (TyG) index was estimated as previously described: 17 {ln[fasting triglycerides (mg/dl) × fasting plasma glucose (mg/dl)/2]}.
Definition of metabolically healthy and unhealthy phenotypes
Metabolic health status was evaluated using the criteria for diagnosis of metabolic syndrome according to the National Cholesterol Education Program (NCEP) Adult Treatment Panel III (ATP III) guidelines: WC > 102 cm for men or >88 cm for women, triglycerides ⩾ 150 mg/dl, HDL-c < 40 mg/dl for men or <50 mg/dl for women, blood pressure ⩾ 130/85 mmHg, and fasting glucose ⩾ 100 mg/dl. 18 Participants with MHP had none or one of these altered cut-off points. Instead, MUP was based on the presence of more than one NCEP–ATP III criteria.
Lifestyle factors
A food frequency questionnaire validated for the Spanish population was used to assess the habitual dietary intake.19,20 Information concerning frequency consumption of 137 foods (daily, weekly, monthly, or never) during the previous year was collected and then converted into energy and nutrient intakes with appropriate software based on the available equivalences from standard Spanish food composition tables. 21
The level of physical activity was evaluated using a validated questionnaire (Spanish version) that included 17 items. 22 Metabolic equivalents (METs) were used to express the intensities of each of the physical activities relative to the resting metabolic rates, as previously described. 23
The variable ‘duration of overweight/obesity’ was obtained from medical records under the section ‘weight evolution’ and referred to the time elapsed since the volunteer presented with overweight or obesity (<5 years or ⩾5 years).
SNP selection and genotyping
A total of 95 obesity-predisposing genetic variants were analyzed. Details regarding the selection procedure and genomic information (including chromosome location and minor allele frequencies) have been recently reported. 24 Genomic deoxyribonucleic acid (DNA) was isolated from buccal cells using the Maxwell® 16 Buccal Swab LEV DNA Purification Kit (Promega Corp., Madison, WI, USA) according to the manufacturer’s protocol. Genotyping was performed with the Ion Torrent™ Next-Generation Sequencing system (Thermo Fisher Scientific Inc., Waltham, MA, USA), as described elsewhere.25,26 Raw data were processed with the Ion Torrent Sequencing platform and R software.
GRS calculation
First, the frequency of a MUP was compared between genotypes to select the single-nucleotide polymorphisms (SNPs) with a p value ⩽ 0.20, with BMI and WC as covariates, to adjust random baseline phenotypical differences. Subsequently, genotypes with similar effects (p > 0.05) were clustered and coded as risk and nonrisk groups. A risk genotype was defined as that associated with a higher frequency of MUP. Then, SNPs whose risk genotypes presented at least a marginal statistical trend (p < 0.10) among MHP and MUP were finally selected. SNPs with low sample (<10%) or collinearity were excluded. Afterwards, a weighted genetic-risk score (wGRS) was constructed under the assumption that all selected SNPs had independent effects and contributed in an additive manner to a MUP, as described elsewhere. 27 Briefly, the wGRS was computed by multiplying the number of high-risk genotypes at each locus for the corresponding effect sizes (β coefficients), and then summing the products. 28 This wGRS was used as a continuous variable in the multiple logistic regression models, as described elsewhere. 24
Statistical analyses
Quantitative variables were expressed as means ± standard deviations, whereas categorical variables were presented as numbers and percentages. Statistical differences in adiposity, biochemical, and dietary intake markers according to metabolically healthy and unhealthy phenotype status were estimated using student t tests. Instead, chi-square tests were used to determine variations in the frequencies/proportions of risk genotypes between MHP and MUP groups. Mean values of wGRS according to the number of metabolic alterations were compared using analysis of variance and post hoc tests.
Multiple logistic regression models were performed to explain the MUP. The screening of genetic and lifestyle data to introduce into the models was carried out through the least-angle regression (LARS) test, as previously described. 29 Collinearity was evaluated using the variance inflation factor. Area under the receiver operating characteristic (ROC) curves were built to evaluate the predictive values of the LARS-selected variables. Moreover, squared partial correlations (PC2) were used to estimate the individual contribution of each significant variable to the MUP. Statistical analyses were computed in the statistical program Stata 12 (StataCorp LLC, College Station, TX, USA; www.stata.com). Statistical significance was set at p < 0.05. Figure plots were designed using the GraphPad Prism® software, version 6.0C (La Jolla, CA, USA) and Stata 12.
Results
Anthropometrics, clinical, and biochemical characteristics of the study population categorized by metabolically healthy and unhealthy status are reported in Table 1. The prevalence of MHP and MUP were 44.3% and 55.7%, respectively. Participants with MUP were older, had greater TFAT and VFAT, as well as higher blood glucose levels, worse lipid profiles, insulin levels, HOMA-IR, and inflammatory markers than those showing a MHP.
Anthropometric, clinical, and biochemical characteristics of the study population categorized by metabolically healthy and unhealthy status: MHP (n = 132); MUP (n = 166).

Variables are expressed as means ± standard deviations.
Bold numbers indicate p < 0.05. MHP, no more than one metabolic syndrome criteria; MUP, more than one metabolic syndrome criteria.
BMI, body mass index; CRP, C-reactive protein; DBP, diastolic blood pressure; HDL-c, high-density lipoprotein cholesterol; HOMA-IR, homeostatic model assessment–insulin resistance index; LDL-c, low-density lipoprotein cholesterol; MHP, Metabolically healthy phenotype; MUP, metabolically unhealthy phenotype; SBP, systolic blood pressure; TFAT, total body fat; TNFα, tumoral necrosis factor alpha; TyG index, triglyceride–glucose index; VFAT, visceral fat; WC, waist circumference.
Interestingly, MUP individuals consumed significantly higher portions of total and white cereals, and low amounts of dairy products and olive oil compared with MHP participants (Table 2). Regarding the nutritional profile, higher intakes of energy, total fat, saturated fatty acids and cholesterol were found among people exhibiting a MUP than their metabolic counterparts.
Nutritional profile and physical activity patterns of the study participants according to metabolically healthy (MHP) and unhealthy (MUP) status.

Variables are expressed as means ± standard deviations.
Bold numbers indicate p < 0.05. MHP, no more than one metabolic syndrome criteria; MUP, more than one metabolic syndrome criteria.
METs, metabolic equivalents; MHP, metabolically healthy phenotype; MUFA, monounsaturated fatty acids; MUP, metabolically unhealthy phenotype; PUFA, polyunsaturated fatty acids; SFA, saturated fatty acids.
A total of 12 obesity-predisposing genetic variants were marginally or statistically associated with a MUP. The characteristics and coding of each of these SNPs are reported in Table 3. Stronger associations were detected for rs7799039 (LEP), rs4731426 (LEP), rs1801260, (CLOCK), rs3123554 (CNR2), rs569805 (ABCB11), rs6265 (BDNF), and rs1685325 (UCP3). Nine polymorphisms were excluded by low sample or collinearity: rs1055144 (NFE2L3), rs2867125 (TMEM18), rs4846567 (LYPLAL1), rs494874 (ABCB11), rs13021737 (TMEM18), rs10938397 (GNPDA2), rs1800629 (TNFA), rs206936 (NUDT3), and rs17066866 (MC4R). A wGRS was calculated using these 12 genetic variants (range 1.17–5.86).
Genomic and statistical characteristics of SNPs significantly associated with a MUP in participants with excessive body weight.
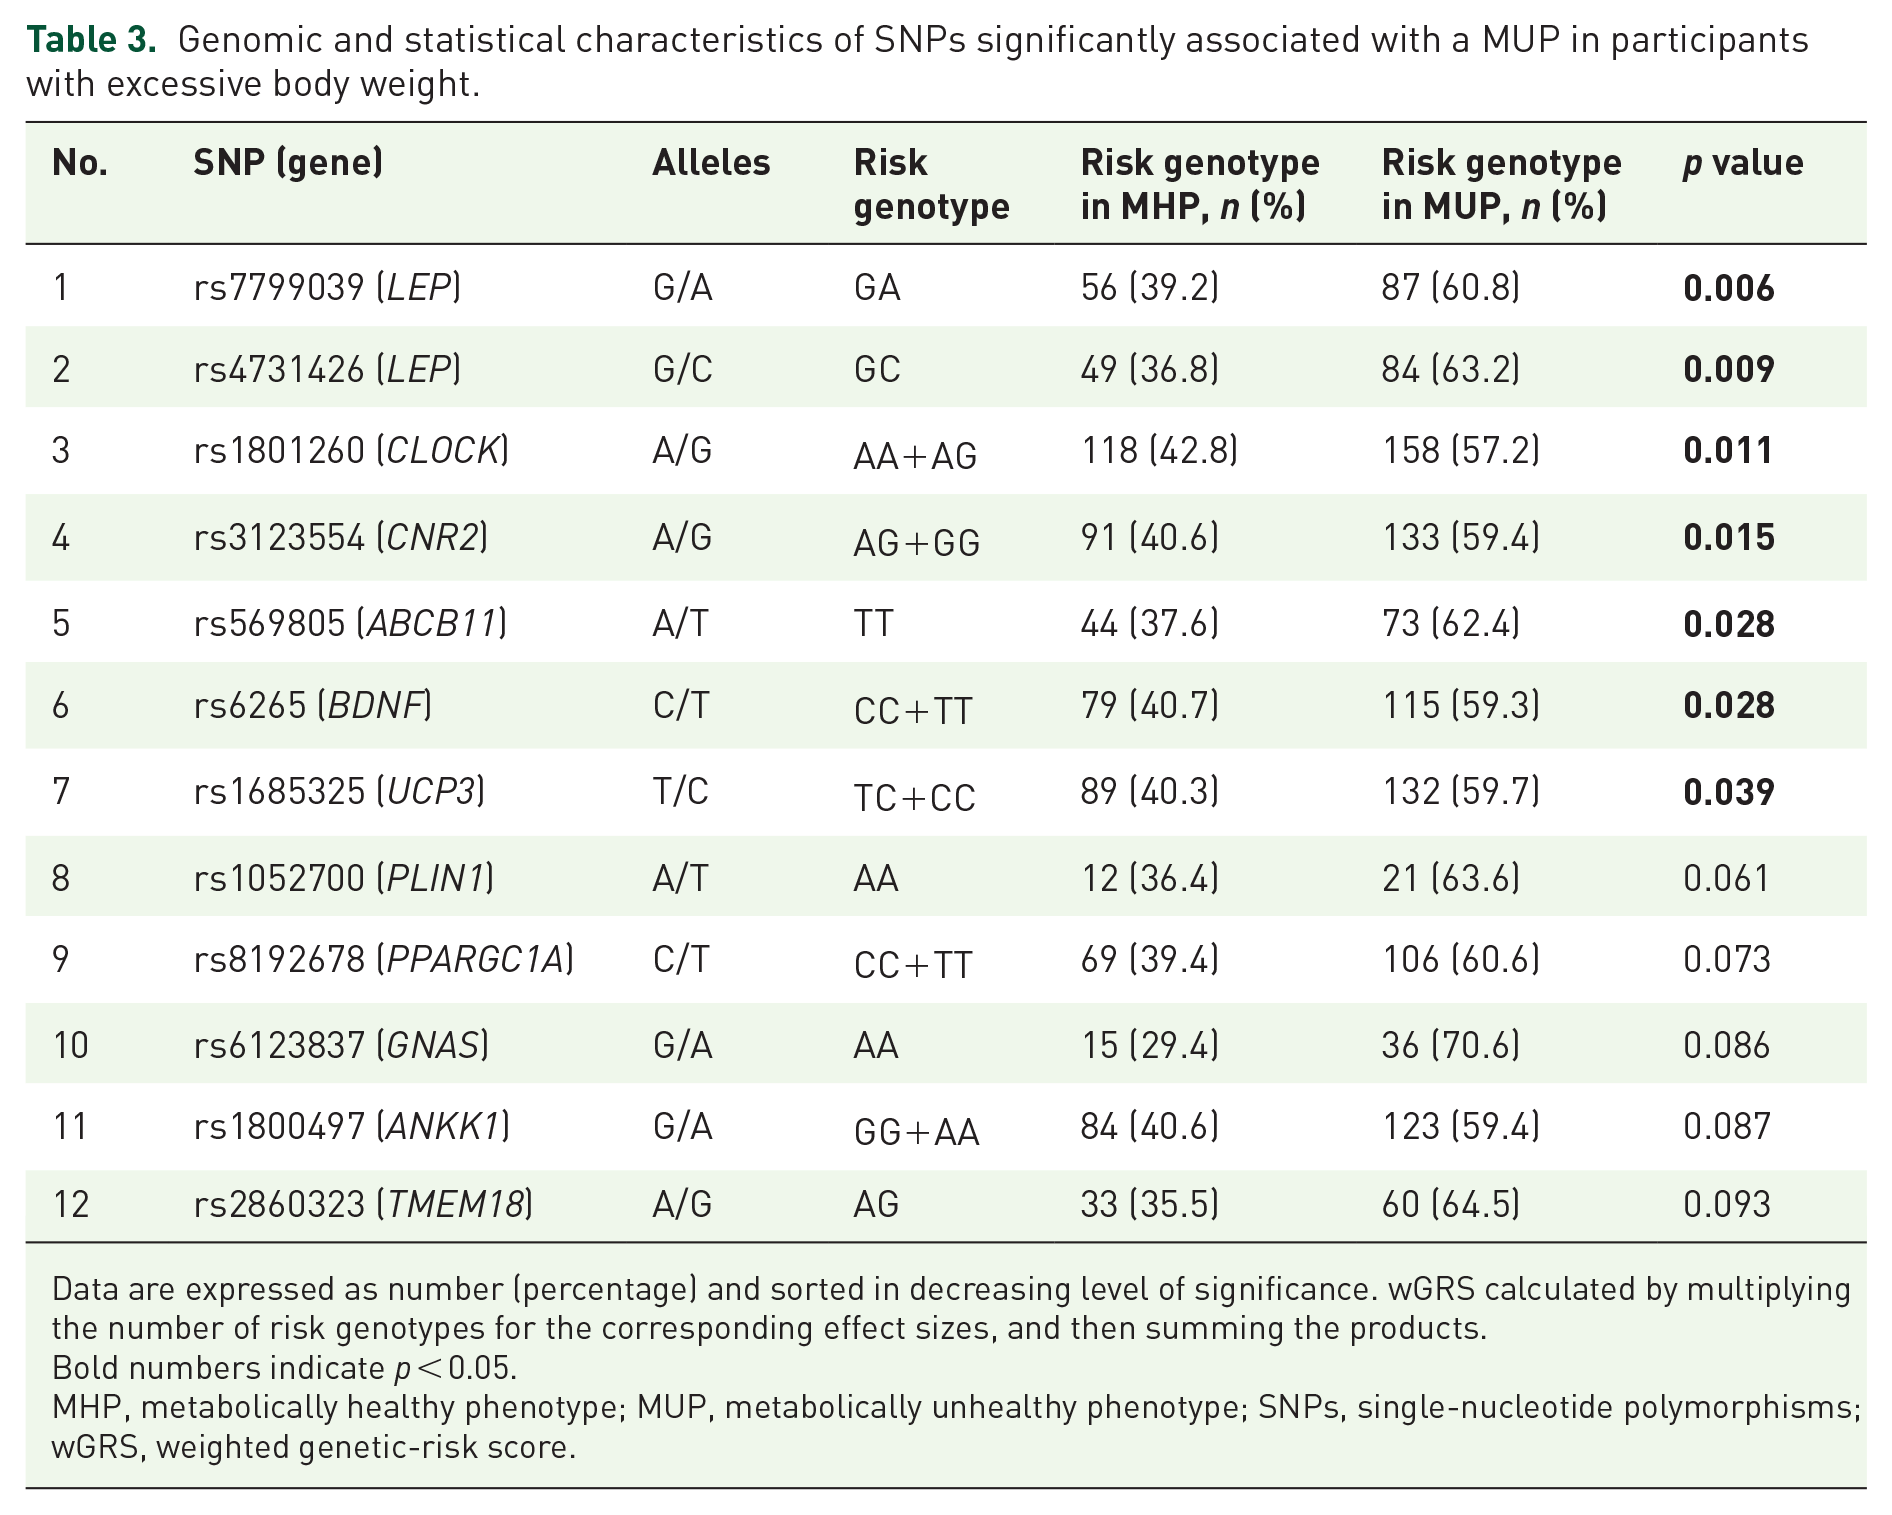
Data are expressed as number (percentage) and sorted in decreasing level of significance. wGRS calculated by multiplying the number of risk genotypes for the corresponding effect sizes, and then summing the products.
Bold numbers indicate p < 0.05.
MHP, metabolically healthy phenotype; MUP, metabolically unhealthy phenotype; SNPs, single-nucleotide polymorphisms; wGRS, weighted genetic-risk score.
Multiple logistic regression models explaining a MUP using LARS-selected variables are also reported (Table 4). Of note, wGRS [odds ratio (OR) = 4.133, p < 0.001], total dietary fat (OR = 1.105, p = 0.002), age (OR = 1.064, p = 0.001), and BMI (OR = 1.408, p < 0.001) contributed to explain a MUP, whereas female sex (OR = 0.330, p = 0.009) produced a protective effect. Remarkably, the wGRS remained statistically significant when analyzed individually or when combined with other variables (model 1 versus model 2; Table 4). In addition, partial-correlation analyses revealed that wGRS was the greatest predictor of the MUP, with about a 38% contribution (PC2 = 0.3816). No statistically significant gene–environment interactions concerning the MUP were found.
Odds ratios concerning genetic and nongenetic variables explaining a MUP in participants with excessive body weight.

Predictive variables are expressed as OR values.
Bold numbers indicate p < 0.05.
BMI, body mass index; CI, confidence interval; METs, metabolic equivalents; MUP, metabolically unhealthy phenotype; OR, odds ratio; wGRS, weighted genetic-risk score.
Comparisons of wGRS mean values according to metabolic status are plotted in Figure 1. The number of cases of each metabolic category were: none (n = 37), one (n = 95), two (n = 97), three (n = 38), four (n = 27), and five (n = 4). Of note, lower levels of wGRS were found among no and one metabolic alterations than two, three, and four, but not five types of disorder [Figure 1(a), p for trend < 0.001]. By contrast, the MUP was characterized by higher wGRS rates compared with MHP [Figure 1(b), p < 0.001].

Comparisons of wGRS mean values.
Figure 2 shows ROC curves of only genetic and the combination of both genetic and nongenetic factors explaining a MUP. Interestingly, an important predictive value (area under ROC curve = 0.7279) was obtained when the wGRS was separately analyzed [Figure 2, curve (a)]. However, the strongest performance was obtained when the wGRS was combined with the rest of variables including energy intake, total dietary fat, age, BMI, sex, physical activity and years of being overweight/obese [area under ROC curve = 0.8820, Figure 2, curve (b)]. A statistically significant difference (p < 0.0001) was found when both ROC curves were compared.
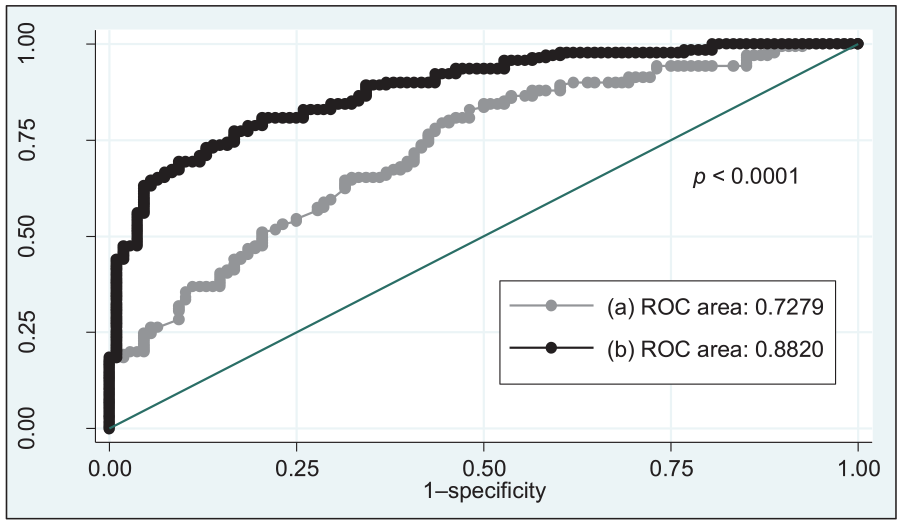
ROC curves of only genetic and the combination of both genetic and nongenetic factors explaining a MUP.
Discussion
The prevalence of MHP and MUP in obese and normal-weight participants varies substantially across studies, mainly due to the lack of a uniform definition concerning different adiposity/metabolic features and thresholds as well as ethnicity/cultural reasons. 30 In this investigation, 56% of the overweight/obese individuals presented with a MUP, which is within the range reported (55–85%) in the global literature. 31 Similar results were found in a large Spanish obese population, where the prevalence of MUP was about 60% according to consensus criteria. 32 Meanwhile, a higher frequency (near 70%) was observed in obese Spanish participants from the ENRICA cohort; 33 however, unlike our study, they also included the homeostasis model assessment of insulin resistance value and C-reactive protein as cardiometabolic abnormalities. Conversely, only 30% of Spanish workers with overweight and obesity had a MUP using modified NCEP–ATP III cutoffs. 34 Together, these findings highlight the heterogeneity of the obesity disorder and highlight the importance of establishing more universal criteria to define this phenotype.
Increasing evidence in humans and animal models suggests that the genetic background predisposes the susceptibility of developing obesity-related complications by affecting diverse essential metabolic pathways. 35 Until now, most available studies have focused on analyzing the association of genetic variants with individual cardiometabolic traits; whereas the identification of polymorphisms specifically related to MUP or MHP remains less explored. In this research, 12 obesity-predisposing genetic variants were associated with a MUP, which regulate physiological processes such as food intake (LEP), circadian cycle (CLOCK), neuronal synapse signaling (CNR2, BDNF), bile secretion (ABCB11), energy expenditure (UCP3), lipid metabolism (PLIN1, PPARGC1A), hormone production (GNAS), food rewarding (ANKK1), and insulin signaling (TMEM18), according to human gene databases (www.genecards.org).
Furthermore, in this study, a wGRS constructed of the aforementioned obesity-risk alleles was strongly associated with a MUP and was the major contributor to this phenotype in the multivariate regression models, with the highest predictive value. Consistent with our results, polygenic risk scores for waist-to-hip ratio, a measure of genetic predisposition to abdominal adiposity, were associated with higher blood pressure and triglyceride levels, as well as higher risk of diabetes and coronary heart disease in different population-based cohorts.36,37 Moreover, individuals carrying genetically determined favorable adiposity phenotypes were at lower risk of diabetes, heart disease, and hypertension in two cohorts.38,39 These results demonstrate a link between the genetic susceptibility to excessive adiposity and cardiometabolic disease risks.
In addition to innate biological mechanisms, demographic factors and lifestyle have been shown to explain, at least in part, the difference between MHP and MUP in obese individuals. 31 Thus, MUP participants are generally older, male, have higher adiposity indices, tend to consume a nutritionally poorer diet and often are less physically active than their obese counterparts. 31 Herein, age was positively associated with a MUP, whereas female sex had a protective effect, in line with previous research. 31 Meanwhile, greater visceral fat accumulation (measured by DXA) was phenotypically related to a MUP. Moreover, the diet of MUP participants was characterized by a high intake of fat (mainly saturated fat and cholesterol) and a low consumption of dairy products. Regarding this latter point, a systematic review and meta-analysis of published observational studies suggested an inverse dose–response relationship between dairy consumption and risk of metabolic syndrome. 40 The differences in cereals/carbohydrate consumption may also explain the incidence of MUP. 41 Moreover, the higher consumption of olive oil in the MHP group could be exerting a protective metabolic effect in these patients, which is attributed not only to the content of monounsaturated fatty acids, but also to other minor components such as phenolic compounds (e.g. hydroxytyrosol and oleuropein), with antioxidant, anti-inflammatory and other beneficial properties.42,43
Current precision nutrition/medicine approaches are adding knowledge into disease-risk prediction and individualized nutritional prescriptions by taking into account a number of clinical, phenotypical, environmental and biological factors to personalize the prevention and management of obesity and related complications. 44 In this context, as a proof of concept, we constructed an integrative model covering conventional (age, sex), phenotypic (body composition), genetic (multiple SNPs), and lifestyle data (diet and physical activity) to explain MHP and MUP in overweight/obese individuals. Also, the predictive model was adjusted by the duration of overweight and obesity, which is a potential confounding factor associated with the presence of metabolic alterations. Additionally, this study enrolled a genetically homogeneous White/European population, thus minimizing the possible effect of population stratification in our results. On the other hand, we consider a drawback of this study was the relatively small sample analyzed, which could explain the lack of statistical differences in the levels of wGRS between the group with five risk factors and the other metabolic groups. Also, the findings of this research may not be extended to other ethnic groups exposed to different gene–environmental interactions. Moreover, given that this study has a cross-sectional design, no temporal/causal relationships between exposures and outcomes can be established. Furthermore, the role of other emerging factors affecting metabolic homeostasis, such as microbiota composition, epigenetic phenomena, sleep patterns, and metabolomic profiles, also need to be explored.45–47
In conclusion, the genetic background is an important factor explaining MHP and MUP in participants with overweight/obesity, in addition to lifestyle variables, such as dietary fat and physical activity, as well as age, female sex, and BMI. This information could be useful to metabolically categorize individuals for disease-risk prediction purposes, as well as for the design/implementation of personalized nutritional interventions aimed at promoting metabolic health and nutritional wellbeing, using precise criteria.
Footnotes
Acknowledgements
Omar Ramos-Lopez and Jose Riezu-Boj contributed equally to this research. The authors thank Laura Olazaran and Iosune Zubieta for nutritional assistance; Ana Lorente for laboratory support; and Blanca Martinez de Morentin (physician). The tractor role of CINFA with regards the genetic tools is also gratefully acknowledged, regarding a grant from the Gobierno de Navarra.
Funding
The authors disclose receipt of the following financial support for the research, authorship, and/or publication of this article: this work was funded by grants from the Gobierno de Navarra (grant number PT024); Centro de Investigación Biomédica en Red: Fisiopatología de la Obesidad y Nutrición (grant number CB12/03/30002), and Nutrición personalizada y biomarcadores nutrigenómicos de la inflamación asociada a la dieta y la obesidad (grant number AGL2013–45554-R).
Conflict of interest statement
The authors declare that they have no conflicts of interest concerning this investigation.