
Abstract
Background:
Attempts to characterize cardiac structure in heart failure with preserved ejection fraction (HFpEF) in people with type 2 diabetes (T2D) have yielded inconsistent findings. We aimed to determine whether patients with HFpEF and T2D have a distinct pattern of cardiac remodelling compared with those without diabetes and whether remodelling was related to circulating markers of inflammation and fibrosis and clinical outcomes.
Methods:
We recruited 140 patients with HFpEF (75 with T2D and 65 without). Participants underwent comprehensive cardiovascular phenotyping, including echocardiography, cardiac magnetic resonance imaging and plasma biomarker profiling.
Results:
Patients with T2D were younger (age 70 ± 9 versus 75 ± 9y, p = 0.002), with evidence of more left ventricular (LV) concentric remodelling (LV mass/volume ratio 0.72 ± 0.15 versus 0.62 ± 0.16, p = 0.024) and smaller indexed left atrial (LA) volumes (maximal LA volume index 48 ± 20 versus 59 ± 29 ml/m2, p = 0.004) than those without diabetes. Plasma biomarkers of inflammation and extracellular matrix remodelling were elevated in those with T2D. Overall, there were 45 hospitalizations for HF and 22 deaths over a median follow-up period of 47 months [interquartile range (IQR) 38–54]. There was no difference in the primary composite endpoint of hospitalization for HF and mortality between groups. On multivariable Cox regression analysis, age, prior HF hospitalization, history of pulmonary disease and LV mass/volume were independent predictors of the primary endpoint.
Conclusions:
Patients with HFpEF and T2D have increased concentric LV remodelling, smaller LA volumes and evidence of increased systemic inflammation compared with those without diabetes. This suggests the underlying pathophysiology for the development of HFpEF is different in patients with and without T2D.
ClinicalTrials.gov identifier:
NCT03050593.
Keywords
Introduction
The prevalence of heart failure (HF) with preserved ejection fraction (HFpEF) is rising and currently accounts for almost 50% of patients with HF in the community.1,2 Despite growing research interest, HFpEF remains relatively poorly characterized. Unlike HF with reduced ejection fraction (HFrEF), there is a lack of effective therapies that convincingly improve clinical outcomes in patients with HFpEF. 3
HFpEF is increasingly being recognized as an umbrella term describing a heterogeneous group of clinical and pathophysiological phenotypes. 4 Among these, people with type 2 diabetes mellitus (T2D) account for a high proportion (varying from 30% to 62%) of both diagnosed and undiagnosed patients with HFpEF.2,5 Furthermore, patients with HFpEF and concomitant T2D have been shown to have worse outcomes, including hospitalization for heart failure and cardiovascular mortality, compared with those without T2D, 6 though it is uncertain whether the elevated risk is independent of adverse cardiac remodelling. 7
Despite the high prevalence of T2D in patients with HFpEF, there are numerous uncertainties surrounding the mechanisms by which these two conditions interact. Several studies have aimed to characterize HFpEF in T2D, predominantly using transthoracic echocardiography. Although these have revealed alterations in cardiac structure and function distinct to this subgroup of patients, there are conflicting data in the literature. Some have reported lower left ventricular (LV) and atrial volumes 8 in participants with T2D, while others have shown the opposite 7 and it is uncertain whether those with T2D have more concentric remodelling and increased LV mass. 8 The RELAX-HF ancillary study comprehensively phenotyped people with and without T2D with cardiovascular magnetic resonance (CMR) imaging, echocardiography, cardiopulmonary exercise testing and limited plasma biomarker profiling. 8 Compared with those without T2D (n = 123), patients with T2D (n = 93) had higher LV mass index (MI; LVMI) and lower exercise capacity (peak VO2 and 6-minute walk distance) despite no overall difference in diastolic function. Furthermore, a limited number of circulating biomarkers suggested increased collagen turnover in patients with T2D. However, no contrast was administered during CMR to assess either ischaemia or myocardial fibrosis. 8
The aim of this study was to identify and compare differences in cardiac remodelling in an unselected group of HFpEF patients with and without T2D and to determine whether LV remodelling is associated with circulating plasma biomarkers and clinical outcomes.
Materials and methods
Study population
Patients were recruited prospectively from outpatient clinics and wards at a single tertiary cardiac centre in the United Kingdom. Inclusion criteria were: age ⩾18 years, clinical or radiographic evidence of HF and LV ejection fraction (EF) >50% on transthoracic echocardiography. Exclusion criteria were: myocardial infarction in the preceding 6 months, suspected or confirmed cardiomyopathy or constrictive pericarditis, noncardiovascular life expectancy < 6 months, severe native heart valve disease, severe chronic obstructive pulmonary disease (COPD; or forced expiratory volume < 30% predicted or forced vital capacity < 50% predicted) and estimated glomerular filtration rate < 30 ml/min per 1.73 m2. The study was approved by the National Research Ethics Service Committee East Midlands, Nottingham (reference: 12/EM/0222), and all participants provided written informed consent prior to participation.
Functional measures
Exercise capacity was assessed using New York Heart Association (NYHA) functional class, standardized 6-minute walk test 9 and quality-of-life metrics were derived from the Minnesota Living with Heart Failure (MLHF) Questionnaire. 10
Plasma biomarker assessment
Venous blood samples were collected from patients at the time of recruitment. Blood was sampled for B-type natriuretic peptide (BNP) immunoassay (Siemens, Erlangen, Germany), and biochemistry (sodium, urea and creatinine). The Modification of Diet in Renal Disease formula was applied to calculate estimated glomerular filtration rate. The remaining biomarkers: fatty-acid binding protein 4 (FABP4), adiponectin, interleukin-6 (IL-6), IL-8, tumour necrosis factor receptor 1 (TNFR1), SerpinE1 plasminogen-activator inhibitor 1 (SerpinE1 PAI1), growth-differentiation factor 15 (GDF15), matrix metalloproteinase 7 (MMP7) and tissue inhibitor of metalloproteinase 1 (TIMP1), were analysed in a Luminex® bead-based multiplex assay, which allows high-throughput biomarker profiling of biological fluids, 11 as previously described. 12
Transthoracic echocardiography
Transthoracic echocardiograms were performed and interpreted by two accredited operators using an iE33 system with S5-1 transducer (Philips Medical Systems, Best, The Netherlands). Images were acquired and reported as per American Society of Echocardiography guidelines. 13 LV EF for study inclusion was derived from the Simpson’s biplane method. In cases of poor endocardial border definition, LV EF was estimated visually. For borderline cases, final consensus was achieved following review by a third observer (PK). Early diastolic transmitral flow velocities (E) and early diastolic mitral annular velocities (e′) to estimate LV filling pressures were assessed by Doppler echocardiography as per American Society of Echocardiography and European Association of Cardiovascular Imaging recommendations. 14
CMR imaging
CMR scanning was undertaken on a 3-Tesla platform (Siemens Skyra, Erlangen, Germany) and the protocol has been outlined previously. 15 In brief, we performed long-and short-axis steady-state free precession cine imaging with short breatholds and ensuring whole heart coverage. Pre- and post-contrast modified inversion recovery Look-Locker (MOLLI) images were acquired in the mid-short-axis slice position as previously described. 16 Late gadolinium-enhanced imaging (LGE) was performed, copying the same cine slice positions, at least 10 min after the final injection of contrast. The total contrast dose was 0.15 mmol/kg (Gadovist, Bayer Healthcare, Germany).
CMR image analysis
All CMR analysis was performed offline, blinded to patient details by a single experienced observer (PK) using cvi42 software (version 5, Circle Cardiovascular Imaging, Calgary, Canada). Ventricular volumes, function and mass were derived from manual contouring of the short-axis cine stack as reported previously by our group. 17 LA volumes and EF were derived from the biplane method, excluding the pulmonary veins and atrial appendage. The two- and four-chamber views were used to manually contour the LA endocardial border. The mitral annulus served as the anterior border. LA volumes (LAVs) were calculated using the area–length method, whereby: volume = (0.85 × area2)/length. Left atrial ejection fraction (LAEF; %) was derived as follows: LAEF = (LAVmax – LAVmin)/LAVmax. LGE images were analysed qualitatively by two experienced observers (PK, ASHC) to achieve consensus for identifying the presence of fibrosis. If present, fibrosis was further dichotomized into either infarct or noninfarct-pattern fibrosis. Infarct was defined as area(s) of LGE hyperenhancement present in orthogonal long- and short-axis images and involving at least the subendocardium in a coronary artery distribution. 18 For the evaluation of reversible perfusion defects, stress and rest perfusion images were assessed visually. If present, perfusion defects were categorized into ischaemia likely due to epicardial coronary artery disease or microvascular dysfunction.
Short-axis MOLLI images were used to calculate extracellular volume (ECV; a measure of total diffuse fibrotic burden). Midmyocardial contours were drawn on T1 parametric maps, ensuring adequate margins of separation from tissue interfaces such as the blood pool or epicardial fat. The anterior right ventricular insertion point was defined to divide the ventricular slices into six midventricular segments based upon the American Heart Association 16-segment model. 19 Segments with MI or artefact were excluded from final T1 and ECV calculation, and segmental values were then averaged. Areas of noninfarct fibrosis were included in the ECV calculations. 20 After inputting blood haematrocrit values, the software generated ECV values using in-built formulae. Indexed ECV (iECV) was derived using the formula: ECV (%) × LV end-diastolic myocardial volume indexed to body surface area. 21
Follow up and endpoints
The minimum follow-up duration of patients was 2 years poststudy entry. The primary endpoint was a combination of hospitalization for HF (defined as admission to hospital for which HF was the primary reason and which required treatment with intravenous diuretic, renal dose dopamine or intravenous nitrate medication) or all-cause mortality, whichever occurred first. Electronic hospital records and patient clinical notes were sourced to obtain outcome data.
Statistical analyses
Statistical tests were performed using SPSS v22.0 software (IBM Corporation, USA). Normality was assessed using histograms, the Shapiro–Wilk test and Q-Q plots. Continuous data are expressed as mean (±standard deviation) if normally distributed or median (25–75% interquartile range) if not. Patients and control groups were compared by independent t tests or Mann–Whitney tests as appropriate. Categorical variables were compared using the Chi-squared test or Fisher’s exact test as appropriate. CMR, echocardiography and biomarker between-group comparisons were undertaken using a general linear univariate analysis of variance, with adjustments for sex, history of hypertension and serum creatinine. For correlation analyses, data that were not normally distributed were log-transformed and assessed using Pearson’s correlation coefficient. Multivariable linear regression was performed to identify independent associations of LV remodelling (i.e. LV mass/volume). The model contained the following variables, known to be associated with LV remodelling (age, sex, ethnicity, body mass index, hypertension and diabetes). Cox proportional hazard and multiple regression analyses were performed to determine which variables were related to the composite endpoint of death or hospitalization for HF. Six of the most clinically relevant and strongest univariable predictors were selected for subsequent multivariate analysis to identify independent predictors of the composite outcome. These were the following variables: demographic (age, history of pulmonary disease and prior hospitalization for HF), biochemical (BNP) and imaging (LV mass/volume and average E/e′). Kaplan–Meier survival curves were used to demonstrate cumulative event-free rates in patients with and without T2D. A p value < 0.05 was considered statistically significant.
Results
Baseline characteristics
The final HFpEF cohort stratified according to diabetic status comprised 140 patients: n = 75 with T2D [mean glycated haemoglobin (HbA1c) 7.3 ± 1.1%; 7% newly diagnosed, 32% diet controlled, 31% insulin treated] and n = 65 without T2D (mean HbA1c 5.7 ± 0.4%; Figure 1). Detailed demographics, anthropometric and biochemical data are presented in Table 1. Type 2 diabetes patients were younger and had a higher proportion of Black and south Asian minority participants than non-T2D patients, although renal function was similar between groups. Obesity, hypertension and hypercholesterolaemia were more prevalent in T2D versus non-T2D patients. Furthermore, patients with T2D had worse functional capacity, with a higher proportion of patients in NYHA class III or IV and a higher percentage on loop diuretics. The exercise capacity was lower (lower 6-minute walk distance) and there was a nonsignificant trend towards lower quality of life (higher MLWHF questionnaire scores) in the diabetic group. Blood pressure and heart rate were not significantly different between the two groups. Presence of atrial fibrillation (p = 0.138), previous myocardial infarction (p = 0.443) or history of coronary artery disease (p = 0.311) and pulmonary disease (p = 0.607) were similar between groups. There was no significant difference in BNP levels (p = 0.987) between groups, but N-terminal proatrial natriuretic peptide (NTproANP) levels were lower in patients with T2D compared with those without T2D (5970 ± 2870 versus 7372 ± 2689 pg/ml, respectively, p = 0.005).

Summary of study recruitment.
Baseline demographic, anthropometric, medical and biochemical characteristics of the study population.

Bold numerals indicate statistical significance.
ACEi, angiotensin-converting-enzyme inhibitor; ARB, angiotensin-receptor blocker; BMI, body mass index; BNP, B-type natriuretic peptide; BP, blood pressure; bpm, beats per minute; COPD, chronic obstructive pulmonary disease; HF, heart failure; NTproANP, N-terminal proatrial natriuretic peptide; NYHA, New York Heart Association functional class; T2D, type 2 diabetes mellitus.
Imaging data
Transthoracic echocardiography
Echocardiographic data are summarized in Table 2. Patients with T2D had higher LV filling pressures compared with non-T2D HFpEF patients (average E/e′ 14 ± 5 versus 12 ± 4, respectively, p = 0.039). Late transmitral flow velocities (A) and E/A were only measured in patients without atrial fibrillation and with satisfactory echocardiographic windows (total 54 with T2D and 39 without T2D). Overall, there was no difference in transmitral flow velocities between groups.
Echocardiography, CMR and plasma biomarker data comparing diabetic versus non-diabetic patients with HFpEF. Adjusted for gender, history of hypertension and serum creatinine.
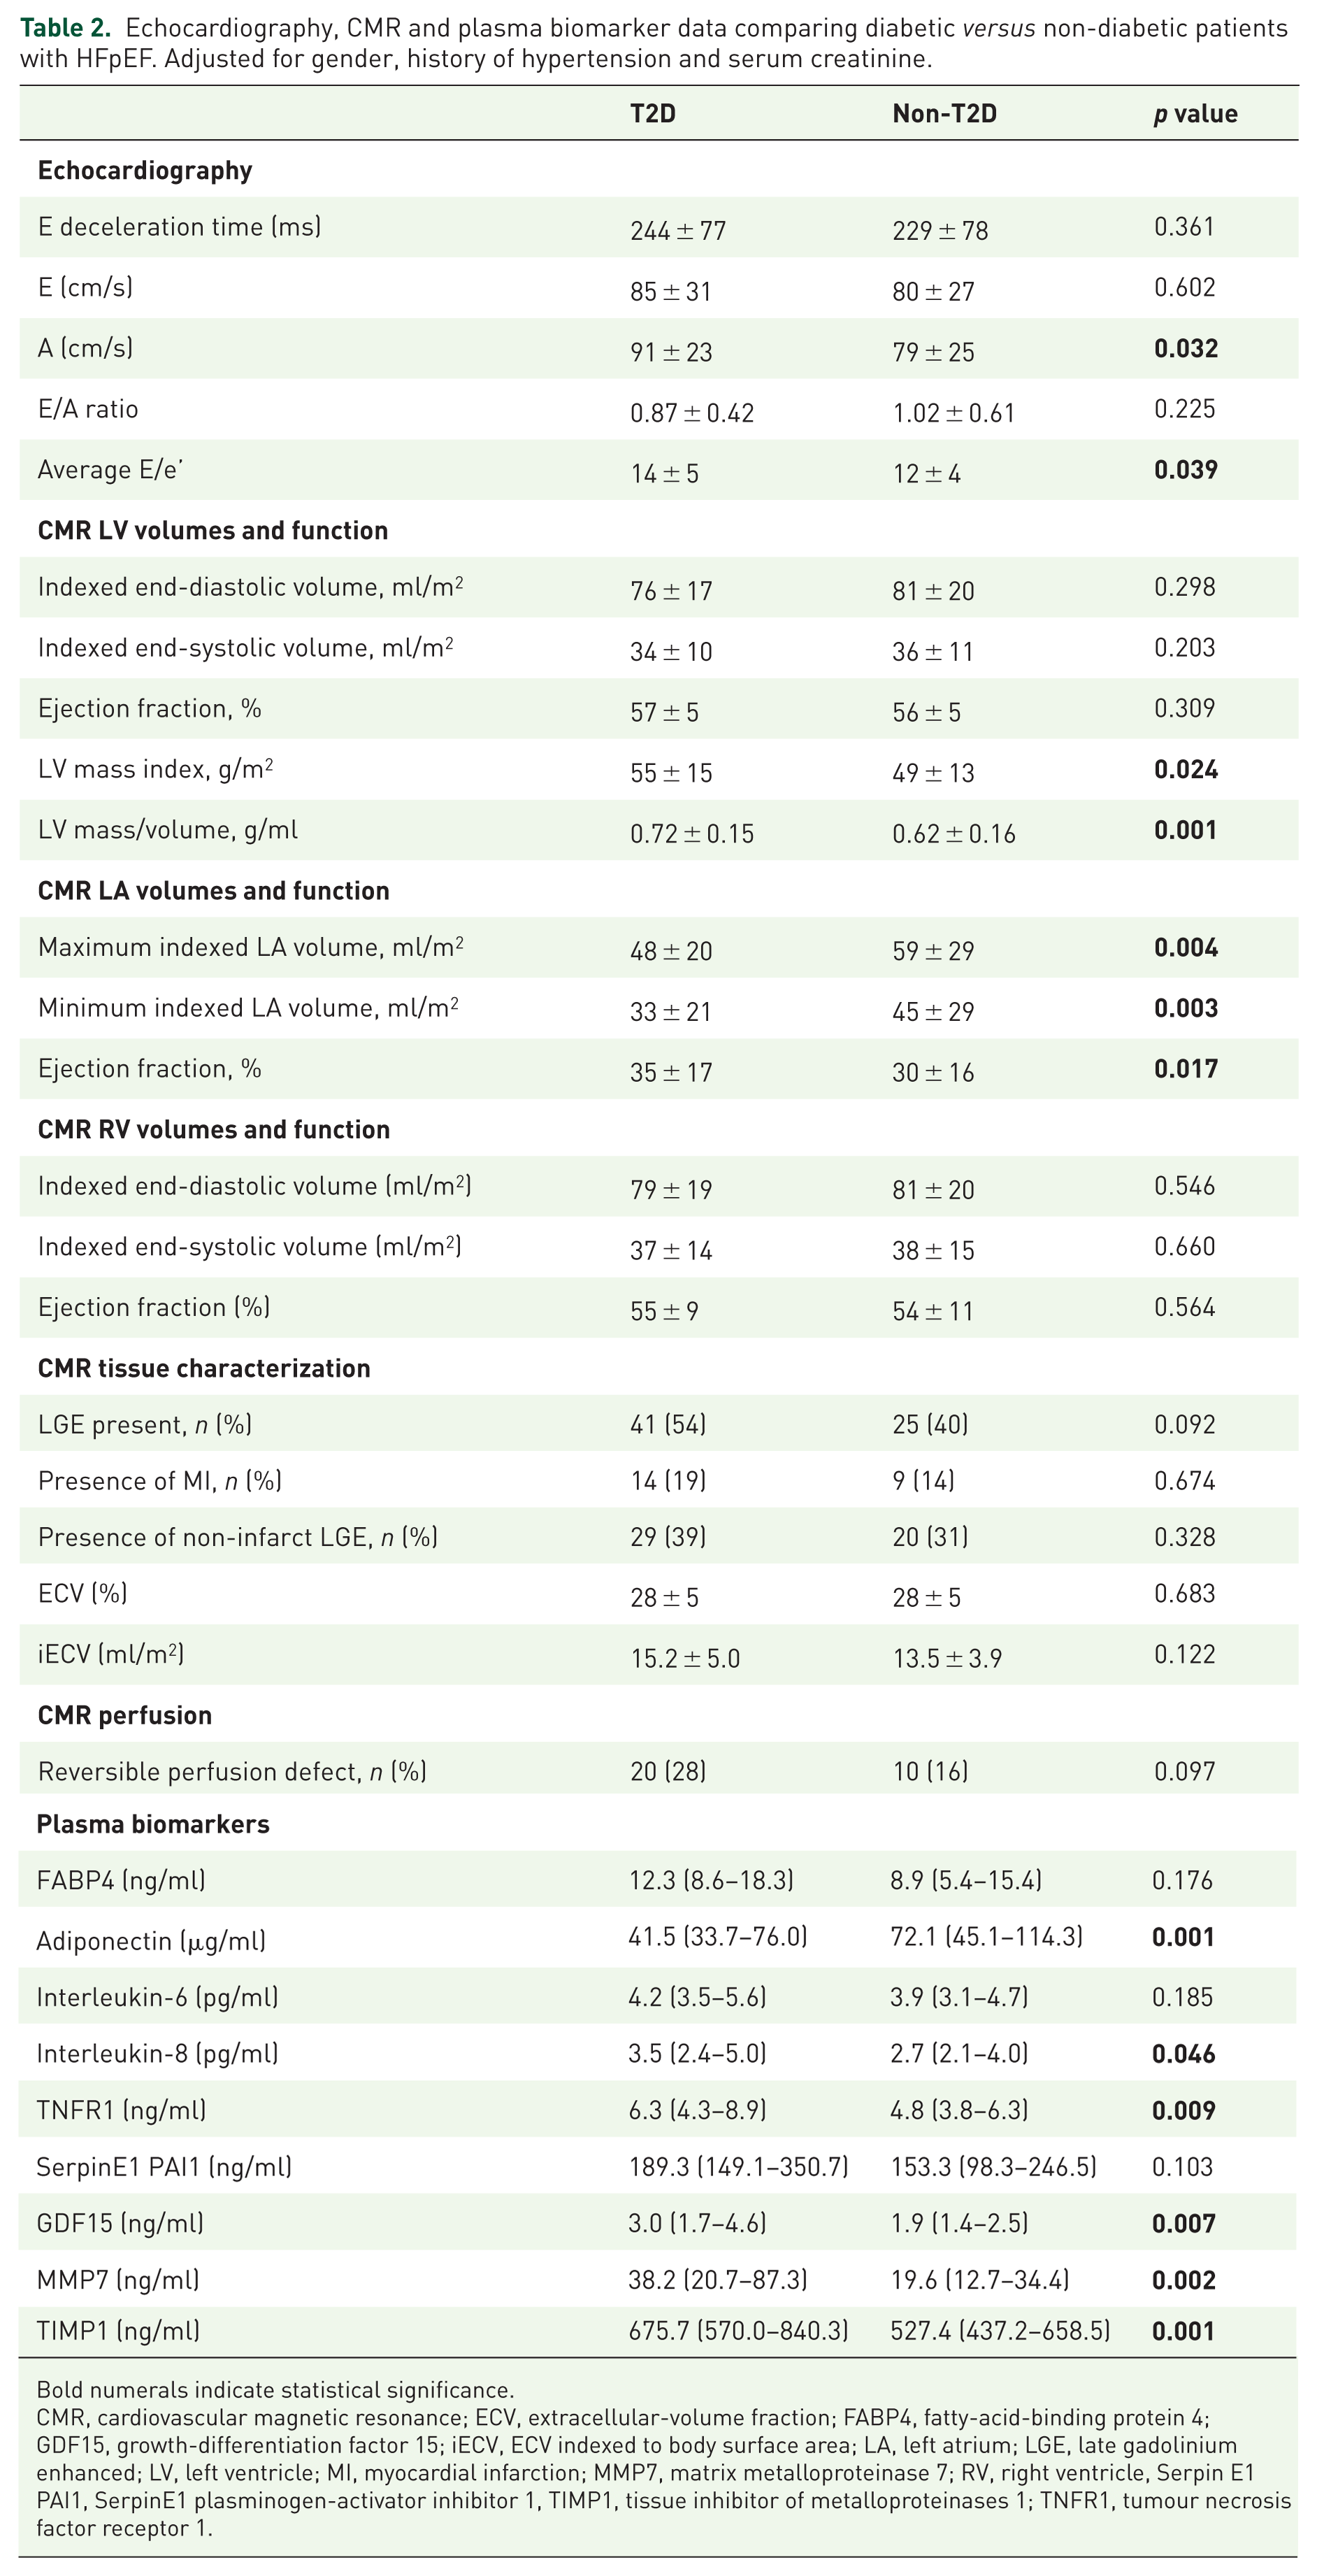
Bold numerals indicate statistical significance.
CMR, cardiovascular magnetic resonance; ECV, extracellular-volume fraction; FABP4, fatty-acid-binding protein 4; GDF15, growth-differentiation factor 15; iECV, ECV indexed to body surface area; LA, left atrium; LGE, late gadolinium enhanced; LV, left ventricle; MI, myocardial infarction; MMP7, matrix metalloproteinase 7; RV, right ventricle, Serpin E1 PAI1, SerpinE1 plasminogen-activator inhibitor 1, TIMP1, tissue inhibitor of metalloproteinases 1; TNFR1, tumour necrosis factor receptor 1.
Baseline CMR characteristics are summarized in Table 2. There were no significant differences in LV and right ventricular volumes or EF between the groups. The T2D group had higher indexed LV mass (55 ± 15 versus 49 ± 13 g/m2, p = 0.024) and a greater degree of LV concentric remodelling (LV mass/volume ratio 0.72 ± 0.15 versus 0.62 ± 0.16, p = 0.001).
Indexed maximal and minimal LA volumes were smaller in people with T2D than those without T2D (p = 0.004 and p = 0.003, respectively). LAEF was greater in patients with T2D than those without (35 ± 17 versus 30 ± 16, respectively, p = 0.017).
CMR tissue characterization: Focal fibrosis evident on LGE imaging was present in just over half (n = 41, 54%) of the HFpEF patients with T2D compared with 25 (40%) of HFpEF patients without T2D (p = 0.092). The patterns of focal fibrosis (i.e. infarct and noninfarct) seen were similar in the two groups (Table 2). ECV and iECV were available for 96 patients (51 people with T2D and 45 people without T2D). There were no differences in diffuse interstitial myocardial fibrosis between the groups, with ECV and iECV being similar in both groups (Table 2).
CMR stress perfusion: Adenosine stress perfusion imaging was performed in 135 participants (72 T2D and 63 non-T2D). There were 30 participants with reversible perfusion defects and in 8 of these, the pattern suggested microvascular dysfunction. Reversible perfusion defects were detected in 20 (28%) T2Ds compared with 10 (16%) non-T2Ds (p = 0.097).
Multivariable predictors of LV remodelling: On multivariable regression, sex, presence of diabetes and ethnicity were independently associated with LV mass/volume (Supplemental Table 1).
Plasma biomarker data
Plasma biomarker data for T2D versus non-T2D patients with HFpEF are presented in Table 2 and Figure 2. Adiponectin was lower in patients with T2D. The plasma inflammatory markers IL-8, TNFR1 and GDF15 were elevated in patients with T2D compared with those without T2D, as were markers of extracellular matrix remodelling (MMP7 and TIMP1).

Plasma biomarker data for T2D versus non-T2D patients.
Correlation of biomarkers with cardiac remodelling
Univariate correlations between plasma biomarkers, LV mass/volume and LA volumes for all patients are presented in Supplemental Table 2. Significant correlations were observed between LV mass/volume and adiponectin (r = −0.328, p < 0.001), TNFR1 (r = 0.249, p = 0.005), GDF15 (r = 0.273, p = 0.002) and MMP7 (r = 0.221, p = 0.013). LA volume was associated with adiponectin (r = 0.291, p = 0.001) and SerpinE1 PAI1 (r = −0.352, p < 0.001).
Clinical outcomes
During a median follow-up duration of 47 months (IQR 38–54) there were a total of 67 composite events (45 hospitalizations for HF and 22 deaths) in the whole study group. Overall, there was no difference in event-free survival between the T2D and non-T2D groups [39 (52%) versus 28 (43%) events, respectively, Log Rank p = 0.485; Figure 3]. Although patients with T2D had more HF hospitalizations than those without T2D [30 (40%) versus 15 (23%)], this difference did not achieve statistical significance (log rank p = 0.253). In those not previously hospitalized for HF, there was no difference in all-cause mortality between T2D and non-T2D patients [9 (12%) versus 13 (20%) deaths, respectively, log rank p = 0.157].
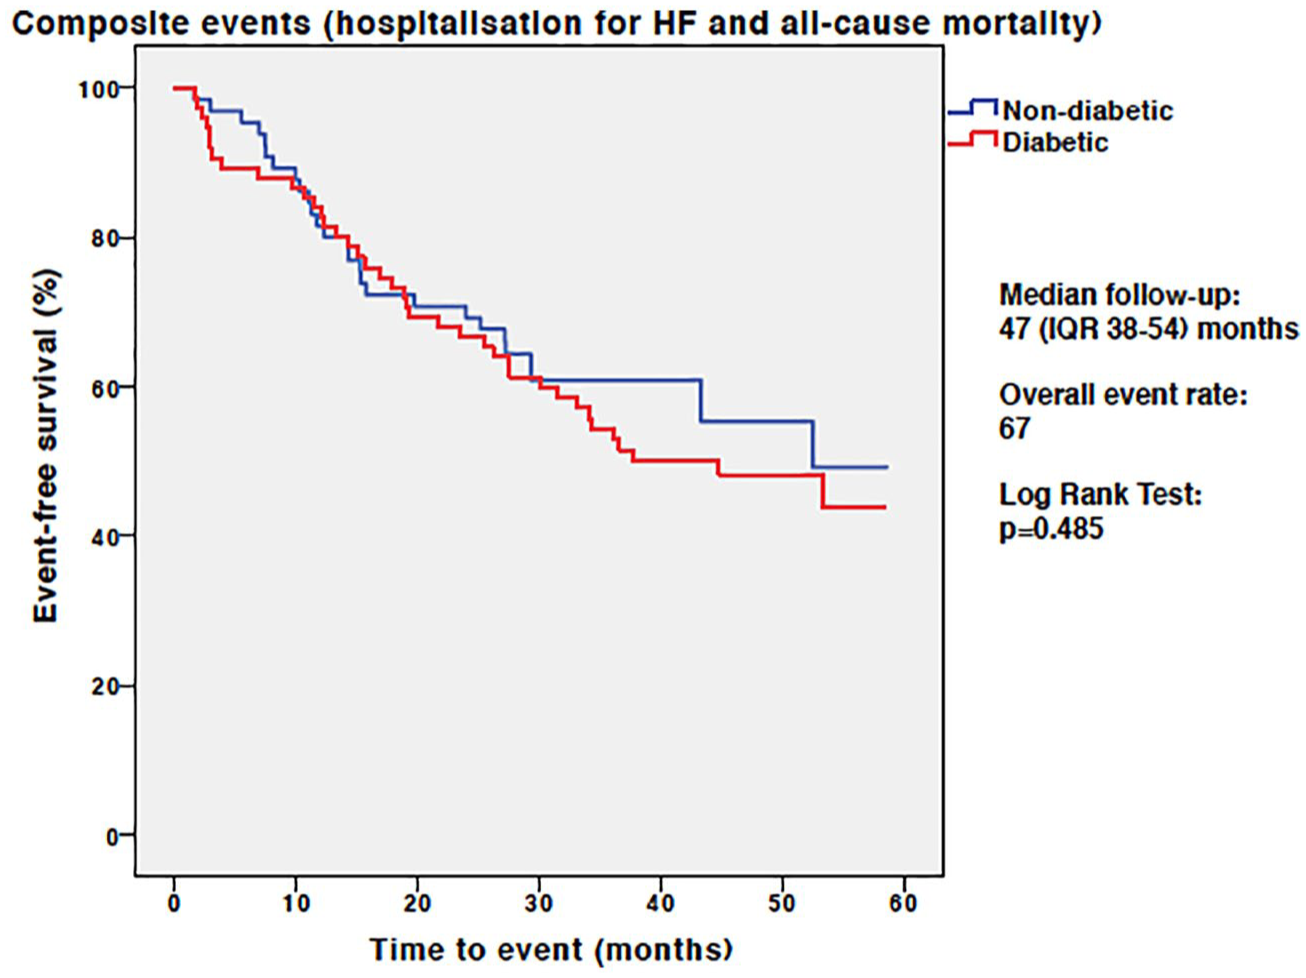
Kaplan–Meier analysis for the composite endpoint of hospitalization for heart failure and all-cause mortality in patients with and without T2D.
Predictors of outcome
Univariable and multivariable predictors of the composite outcome are presented in Table 3. T2D was not associated with outcome. Age, prior hospitalization for HF and a history of pulmonary disease were strong demographic predictors of the composite outcome. Serum creatinine level, BNP and haemoglobin were significant biochemical predictors of the composite outcome. ECV, LV remodelling, LA end-diastolic volume and LAEF, and average E/e′ were significant imaging predictors of the composite outcome. On multivariate analysis, age, a history of pulmonary disease and prior HF hospitalization remained predictors of the primary endpoint. LV mass/volume was the only imaging variable that remained a predictor of the primary endpoint on multivariate analysis (hazard ratio 7.070, 95% confidence interval 1.306–38.276, p = 0.023).
Univariable and multivariable predictors of the composite outcome of hospitalization for HF and all-cause mortality.

Bold numerals indicate statistical significance.
BNP, B-type natriuretic peptide; BP, blood pressure; E, early diastolic transmitral flow velocities; e′, early diastolic mitral annular velocities; ECV, extracellular-volume fraction; EDVi, indexed end-diastolic volume; EF, ejection fraction; ESVi, indexed end-systolic volume; HbA1c, glycated haemoglobin; HF, heart failure; LA, left atrium; LGE, late gadolinium enhanced; LV, left ventricle; MI, mass index; NYHA, New York Heart Association; BP, blood pressure; RV, right ventricle.
Discussion
In this detailed phenotyping study of HFpEF, we have shown that patients with T2D show a distinct pattern of cardiac remodelling compared with patients without T2D. Patients with T2D had dramatically increased concentric remodelling (20% increase) and higher LV filling pressures but despite this, smaller LA volumes and lower NTproANP. These changes were associated with differences in multiple inflammatory and extracellular matrix remodelling biomarkers that suggest the pathophysiologic mechanisms resulting in HFpEF are different in T2D. On adjusted survival analyses, T2D did not represent increased risk of hospitalization for HF or death in our patient group, but concentric LV remodelling did. The fact that we found no overall difference in outcomes between diabetic and nondiabetic patients in our cohort is contrary to other reports,7,8 although the patients in those studies were younger, 8 had lower proportions of Black and south Asian ethnic-minority individuals7,8 and shorter follow-up duration. 8 Furthermore, people with diabetes in this study were younger than those without diabetes and in our multivariable model of outcome, we included adjustment for NYHA symptom status (the T2D group had a higher proportion of people with NYHA III/IV symptom status than those without T2D), perhaps explaining why outcomes were comparable between the two groups. Another possible interpretation of these observations is that the adverse prognosis observed in patients with HFpEF and T2D, compared with those without T2D, is a facet of the associated differences in remodelling seen between these groups.
This is among the first prospective studies, and the largest, to extensively compare phenotypic differences between diabetic and nondiabetic patients with HFpEF using an integrated CMR and plasma biomarker approach. Strengths of this study are the inclusion of consecutively consenting patients including representation from multiethnic population groups, intensive phenotyping with echocardiography and CMR, including tissue characterization, functional capacity and biomarkers.
Clinical and ethnic differences in diabetic HFpEF
HFpEF patients with coexisting T2D have been shown in multiple studies to have poorer clinical outcomes than nondiabetics.6–8 This may be explained by the higher prevalence of cardiovascular risk factors that usually accompany T2D, such as hypertension, dyslipidemia and obesity. Cardiovascular mortality rises steeply for every additional cardiovascular risk factor (e.g. smoking, hypertension, dyslipidaemia) that accompanies diabetes. 22
A striking finding in our cohort is the high prevalence (almost 30%) of Black and south Asian minority patients in the diabetic HFpEF group, compared with only 4% in the nondiabetic HFpEF group. These findings are supported by a recent, large (n = 19,537), observational study comparing south Asian and White HF patients. Type 2 diabetes was three times more common in south Asians than in Whites across both HFpEF and HFrEF. 23 In the absence of T2D, however, both HFpEF and HFrEF were more common in Whites than in south Asians. Furthermore, Asian patients with HF and T2D had worse clinical outcomes than Whites in a combined cohort of patients from Singapore (n = 1002) and Sweden (n = 19,537). 23 It would appear that minority ethnic groups have a much higher risk for HFpEF development in the presence of T2D, although we cannot be certain of this finding due to the risk of selection bias. Further data from large population studies are needed to confirm whether those from ethnic minorities are more likely to develop HFpEF and whether this is linked to outcome.
Cardiac remodelling in diabetic HFpEF
Several differences in cardiac geometry have been described in T2D versus non-T2D HFpEF patients, mostly using echocardiography. However, attempts to characterize cardiac structure in HFpEF with T2D have yielded inconsistent findings. Some have reported that patients with T2D and HFpEF patients have larger LV and LA volumes, together with increased LV hypertrophy,7,8 whereas others have found no differences in LV volumes between T2D and non-T2D participants. 24 Some of the uncertainty may arise because cardiac dimensions may or may not be corrected for body size and LV mass has been variably corrected for body surface area and height. Most of the imaging data have also relied on transthoracic echocardiography, which often results in suboptimal image quality with obesity and other common comorbidities such as chronic obstructive airways disease.
In our cohort, we found no differences in indexed LV volumes between T2D and non-T2D HFpEF patients, although this may be because both groups in our study were obese, which is itself associated with alterations in ventricular volumes. 25 T2D patients did, however, have more LV remodelling compared with nondiabetics, and diabetes status was an independent predictor of LV concentric remodelling. Furthermore, concentric remodelling, the predominant remodelling pattern observed in T2D, was associated with the combined endpoint of death or HF hospitalization. This is consistent with larger cohorts, where concentric remodelling was shown to be associated with an increased risk for developing HF and other adverse cardiac events, and is the predominant remodelling pattern observed in T2D. 26
LA enlargement is increasingly being recognized for its association with adverse cardiovascular outcomes, including atrial fibrillation, stroke and all-cause cardiovascular mortality.27,28 The relationship between T2D and LA remodelling, however, is unclear. Both T2D and obesity have previously been associated with increased LA volumes.7,24 Despite being more obese with higher LV filling pressures than the patients without T2D, however, the diabetic HFpEF patients in our cohort have smaller LA volumes. This finding was supported by the lower NTproANP levels seen in our T2D group. While this finding may be regarded as surprising, similar results were found in the RELAX-HF substudy. 29 Recent data from the large UK Biobank imaging enhancement study of over 5000 people have also shown that diabetes was associated with smaller LA volumes. 30 Classically, LA enlargement is regarded as a sign of early left-heart dysfunction and has prognostic implications in the general population 31 and in patients with HF 32 and is also used to define HFpEF. 33 One explanation for smaller LA volumes in diabetic HFpEF is that they occur as a consequence of atrial constriction caused by systemic inflammation, which is supported by the increased inflammatory biomarker levels observed in this study. Furthermore, a generalized pro-inflammatory state induced by comorbidities such as hypertension and T2D has recently been proposed as a novel paradigm in HFpEF. 34 However, if inflammation does prevent LA enlargement, it would be surprising that atrial function was better preserved in the T2D patients. Nevertheless, the prognostic significance of smaller LA volumes in diabetic HFpEF is as yet unclear, but these findings highlight the distinct pattern of remodelling with T2D.
Plasma biomarkers in diabetic HFpEF
The discovery of an increasing number of biomarkers are giving new insights into the pathophysiology of HF and T2D. We found adiponectin to be lower in diabetic patients. Adiponectin is a hormone produced by adipose tissue, which promotes insulin sensitivity and fatty-acid oxidation. 35 This hormone (or lack of) has been linked to promotion of inflammatory processes that occur during the early phases of atherosclerosis, and therefore, unsurprisingly, markers such as IL-6, IL-8, TNFRI and TNFRII are negatively correlated with adiponectin. However, we did not observe a difference between groups in levels of IL-6, which is a major inflammatory cytokine in cardiometabolic patients and in particular, obesity. 8 The high prevalence of obesity in both groups may account for the lack of observed differences in IL-6 between our two groups, although in this case, we would have also expected similar adiponectin levels. It is possible that changes in adiponectin levels precede inflammation reflected by increased IL-6.
Recent insights into the metabolic origins of HF highlight the metabolic changes the heart undergoes when it is failing, where the myocardium is unable to increase output to meet demand, despite having excess amounts of energy substrates. 36 This reality may be more significant in T2D due to inherent insulin resistance, potentially resulting in the accumulation of toxic metabolic intermediates, which may drive the downstream inflammatory and remodelling changes seen in HF. 37
Natriuretic peptide levels can be influenced by many factors associated with T2D, including obesity, increasing age, use of renin-angiotensin–aldosterone-system inhibitors, and renal dysfunction, as well as diabetes itself. 38 Conversely, natriuretic peptides themselves may affect insulin sensitivity. 39 It is surprising that BNP was not higher in the diabetic patients in this cohort, especially because the LV filling pressures are higher, and because GDF-15 (another marker of myocardial stress) is higher. This discrepancy could be primarily due to the increased adiposity of the diabetic patients in this cohort. 40 However LV wall stress was also likely to be lower in the patients with T2D, since they had higher mass/volume and very similar blood pressure to those without diabetes.
Numerous other biomarkers are being evaluated in diabetic heart disease. In one study comparing biomarker profiles between diabetic and nondiabetic patients with HFpEF, endothelin-1 (a potent vasoconstrictor), galectin-3 and carboxy-terminal telopeptide of collagen type 1 (profibrotic biomarkers) were higher in patients with T2D. 8 We have found a clear predominance of inflammatory, metabolic and extracellular matrix remodelling biomarkers in our diabetic HFpEF patients, which may explain the differences in the cardiac remodelling observed. Several of these are also independently associated with cardiovascular outcomes 41 and may have diagnostic and prognostic utility in the future.
Clinical perspectives
This study demonstrates a distinct pattern of cardiac remodelling in patients with HFpEF and T2D. This indicates that the pathophysiology of HFpEF in patients with T2D is different to those without diabetes, alluded to by a predominance of biomarkers of systemic inflammation and extracellular matrix turnover in diabetic patients. Although T2D does not appear to be associated with outcomes in this cohort, the heterogeneity of the HFpEF phenotype between diabetics and nondiabetics may explain the lack of efficacious therapies for HFpEF, which are not yet targeted to individual patient groups. Further trials are warranted in specific cohorts of patients with HFpEF, driven by a precision medicine approach.
Conclusion
Patients with HFpEF and T2D have dramatically increased concentric LV remodelling, smaller LA volumes and evidence of increased systemic inflammation compared with nondiabetics. These findings may help develop future therapies specifically targeted towards patients with both T2D and HF.
Limitations
The specific cause of death was not available in electronic health records used to collect clinical outcome data in this study. It is therefore possible that several of the deaths that occurred in our cohort were due to noncardiovascular causes. To minimize the inclusion of participants with death from noncardiovascular causes, we excluded individuals with noncardiovascular life expectancy < 6 months from the study. The relatively low clinical-event rates observed in our cohort limit interpretation of our outcome data and permitted the inclusion of only a small number of variables in our multivariable Cox regression analysis. The younger age of our diabetes patients was an important confounder of the clinical outcome data and may explain why we did not observe a difference in event rates between the two study groups, as is the case in other studies. That the diabetes participants in the study experienced similar event rates to those without diabetes despite their younger age, however, suggests that these individuals are indeed at higher risk of cardiovascular events. Nevertheless, the follow-up duration of our cohort is longer than the majority of the published data and is a strength of this study. Lastly, the modest sample size in our study may have limited the observed between-group differences in several of our CMR measures. In particular, differences in the presence of LGE and presence of reversible perfusion defects between groups may have reached statistical significance in a larger cohort.
Supplemental Material
Online_Only_Supplemental_Material_TAE – Supplemental material for Differential left ventricular and left atrial remodelling in heart failure with preserved ejection fraction patients with and without diabetes
Supplemental material, Online_Only_Supplemental_Material_TAE for Differential left ventricular and left atrial remodelling in heart failure with preserved ejection fraction patients with and without diabetes by Gaurav S. Gulsin, Prathap Kanagala, Daniel C. S. Chan, Adrian S. H. Cheng, Lavanya Athithan, Matthew P. M. Graham-Brown, Anvesha Singh, Jing Yang, Zhuyin Li, Kamlesh Khunti, Melanie J. Davies, Jayanth R. Arnold, Iain B. Squire, Leong L. Ng and Gerry P. McCann in Therapeutic Advances in Endocrinology and Metabolism
Footnotes
Acknowledgements
Doctors Gulsin and Kanagala have contributed equally to this work and Professors Ng and McCann have contributed equally to this work. We would like to thank the CMR radiographers at Glenfield Hospital for image acquisition. GPM is supported by a NIHR Career Development fellowship (2014-07-045). This study is part of the research portfolio supported by the NIHR Leicester Biomedical Research Centre and the Leicester Clinical Research Facility. We also acknowledge support from NIHR Collaboration in Leadership in Applied Health Research and Care East Midlands. GPM, IBS and LLN conceived the idea for the study and designed the study protocol. GSG and PK performed the statistical analyses (with MPMGB) and drafted the manuscript. PK recruited the patients, supervised the CMR scans and study visits (with AS). GSG, JRA and LA undertook patient follow up. ASHC and GPM reported the CMR scans. LLN, DCSC, JY and ZL undertook the plasma biomarker profiling. All authors critically revised the manuscript for important intellectual content and approved the final manuscript.
Authors’ note
GPM, KK, MJD, JRA, IBS and LLN conceived the idea for the study and designed the protocol. PK recruited the patients, supervised the CMR scans and study visits (with AS). PK performed the CMR image analysis, which was overseen by GPM. GSG undertook the participant follow-up. GSG, PK, LA and MGB performed the statistical analysis. PK and GSG and drafted the manuscript. ASHC and GPM reported the CMR scans. DCSC, ZL and JY performed the biomarker analyses, which was overseen by LLN. All authors critical revised the manuscript for important intellectual content and approved the final submission.
Funding
The author(s) disclose receipt of the following financial support for the research, authorship, and/or publication of this article: This work was supported by and falls under the portfolio of research conducted within the National Institute for Health Research Leicester Cardiovascular Biomedical Research Unit. Overall project grant: IRS IS_BRU_0211_20033.
Conflict of interest statement
The authors declare that there is no conflict of interest.
Availability of data and material
The datasets generated during and analysed during the current study are available from the corresponding author (GPM) upon reasonable request.
Supplemental material
Supplemental material for this article is available online.
References
Supplementary Material
Please find the following supplemental material available below.
For Open Access articles published under a Creative Commons License, all supplemental material carries the same license as the article it is associated with.
For non-Open Access articles published, all supplemental material carries a non-exclusive license, and permission requests for re-use of supplemental material or any part of supplemental material shall be sent directly to the copyright owner as specified in the copyright notice associated with the article.