
Abstract
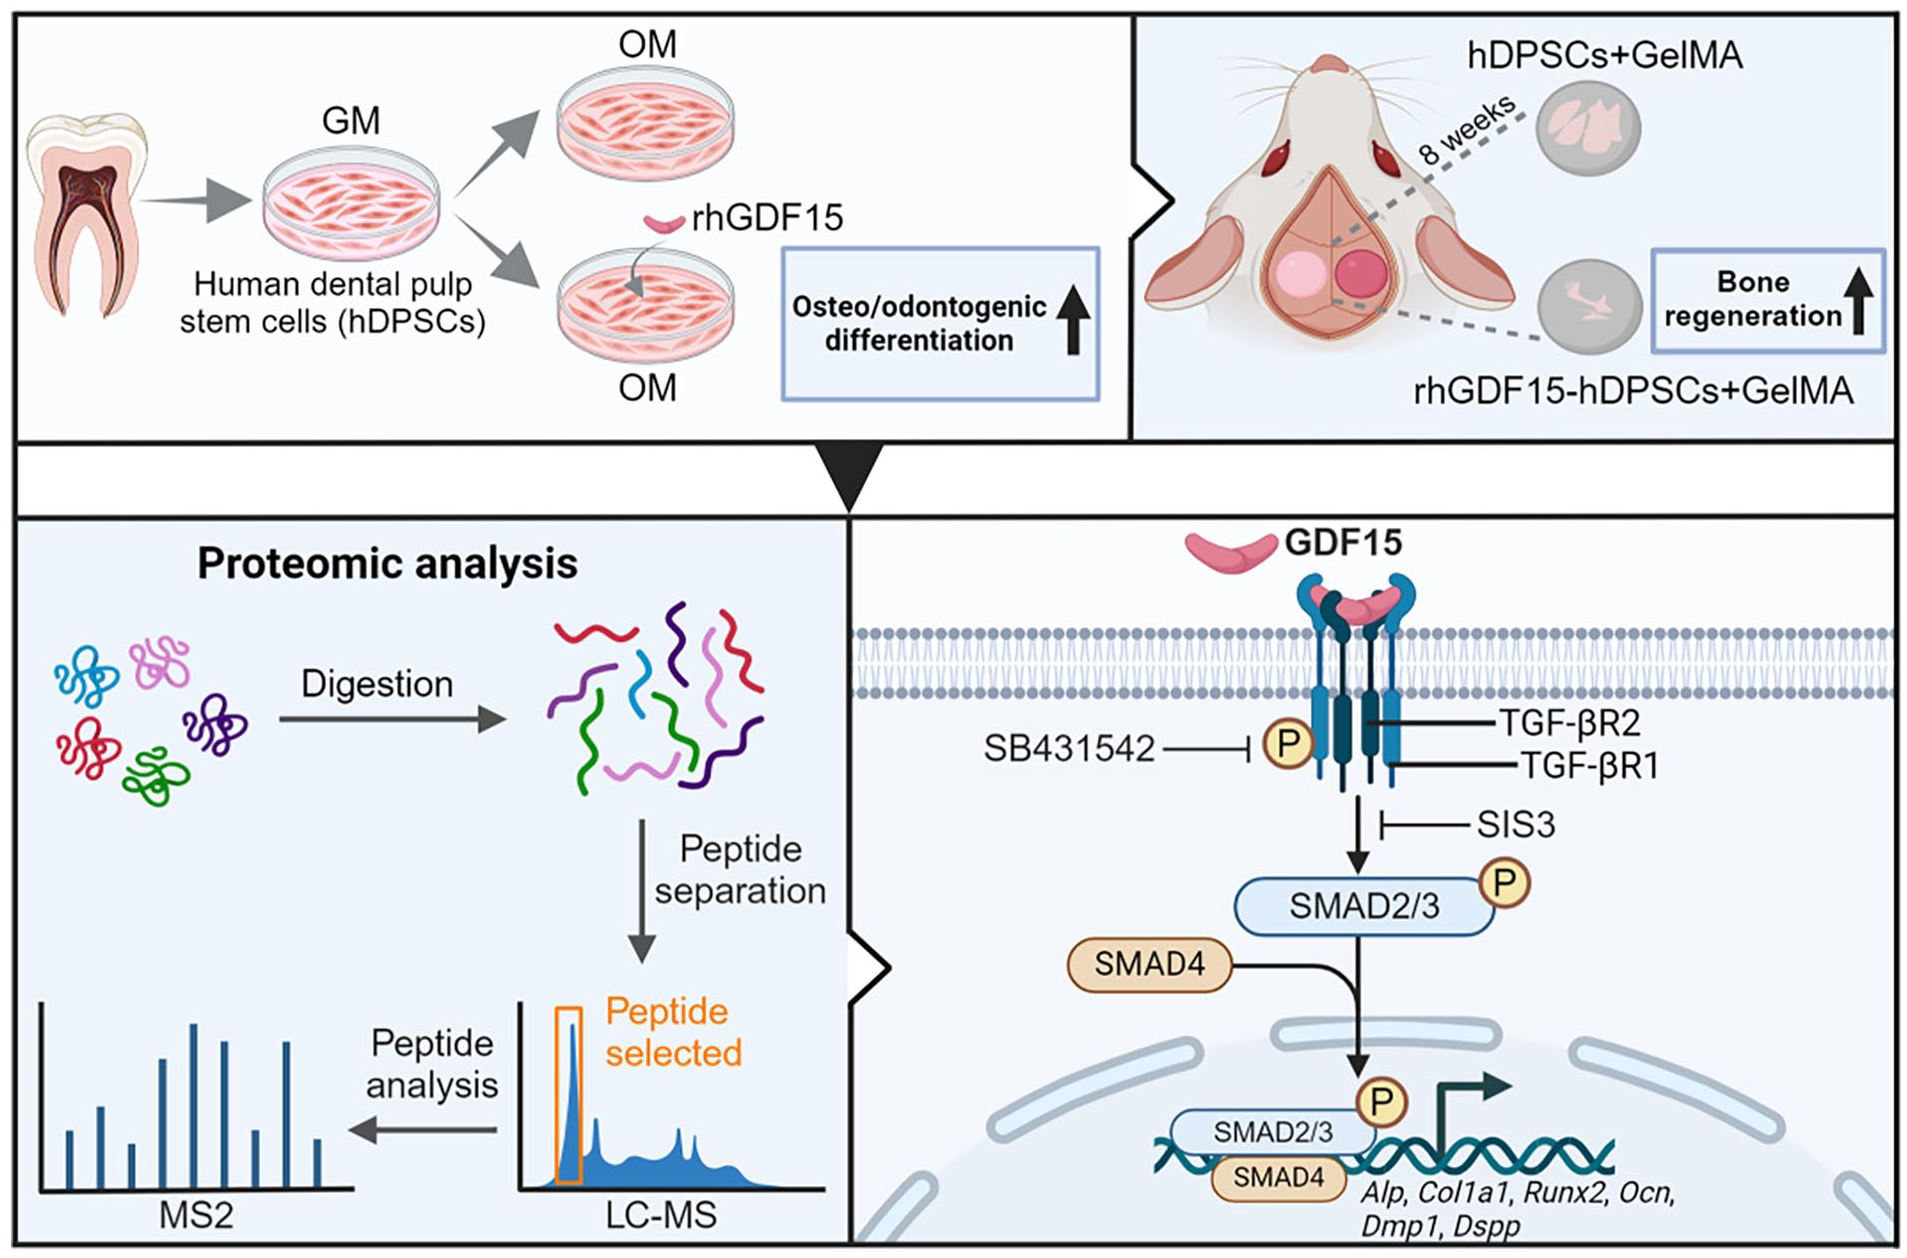
Mesenchymal stem cell-mediated bone tissue engineering strategies, including human dental pulp stem cells (hDPSCs), represent an effective therapeutic approach for bone defect repair, particularly in maxillofacial bone defects. Growth differentiation factor 15 (GDF15), a multifunctional cytokine, plays a critical role in bone tissue formation and remodeling. This study aims to investigate the effects of GDF15 on the osteogenic differentiation of hDPSCs and elucidate the underlying molecular mechanisms. Our findings demonstrate that GDF15 expression and secretion are upregulated during the osteogenic differentiation of hDPSCs. Both Gdf15 overexpression and recombinant human GDF15 (rhGDF15) treatment significantly enhanced the osteogenic differentiation of hDPSCs, whereas Gdf15 knockdown produced the opposite effect. In vivo experiments demonstrated that hDPSCs treated with rhGDF15 significantly enhanced new bone formation within implants in both nude mouse subcutaneous transplantation and rat calvarial defect models. Proteomic analysis identified significant enrichment of the TGF-β/SMAD signaling pathway. Molecular docking analysis and co-immunoprecipitation demonstrated the direct binding interaction between GDF15 and TGF-βR2. Both in vitro Western blotting and in vivo immunofluorescence assays confirmed pathway activation. Critically, pharmacological inhibition of this pathway partially reversed the rhGDF15-induced enhancement of osteogenic differentiation in hDPSCs. Collectively, our findings demonstrate that GDF15 promotes osteogenic differentiation of hDPSCs through activation of the TGF-β/SMAD signaling pathway, thereby proposing a novel therapeutic strategy for bone repair and regenerative treatment.
Keywords
Background
Human dental pulp stem cells (hDPSCs), characterized by their multidirectional differentiation potential, low immunogenicity, easy accessibility, absence of ethical controversies, and high proliferative capacity, represent an ideal stem cell source for cell therapy, regenerative medicine, and tissue engineering applications.1,2 As evidenced by previous studies, hDPSCs exhibit robust osteogenic differentiation potential under osteogenic microenvironment stimulation in both in vitro and in vivo settings.3,4 However, the clinical application of hDPSCs is limited due to their low yield from dental pulp tissues and the progressive decline in stemness and differentiation efficiency during in vitro passaging and expansion.5,6 Therefore, enhancing the osteogenic differentiation efficiency of hDPSCs and elucidating their underlying biological mechanisms are pivotal for the successful development of hDPSC-mediated bone tissue engineering strategies.
The osteogenic differentiation of hDPSCs is orchestrated through sequential regulation and synergistic interplay of a cascade of growth factors and cytokines.7,8 Therefore, the identification and characterization of critical growth factors regulating the osteogenic differentiation of hDPSCs will facilitate advancements in bone tissue engineering and its clinical translation. Researchers have identified that multiple members of the transforming growth factor-β (TGF-β) superfamily play a facilitating role during the osteogenic differentiation of hDPSCs.9–11 Growth differentiation factor 15 (GDF15), a member of the TGF-β superfamily, is critically involved in prenatal development, postnatal growth, and the maintenance and remodeling of diverse tissues and organs. 12 Recently, studies have identified dysregulated expression of GDF15 in multiple bone-related pathologies, including multiple myeloma, primary myelofibrosis, and neoplastic bone metastasis.13–15 Current literature reveals conflicting findings regarding the role of GDF15 in bone-related processes. While some studies demonstrate its pro-osteogenic effects in bone development, bone metabolic homeostasis, and bone pathological remodeling,16–18 others report inhibitory or context-dependent outcomes. 19 In vitro studies demonstrate that recombinant human GDF15 (rhGDF15) stimulation upregulates the expression of osteogenic-related genes (e.g., Runx2, Alp) in osteoblasts, 20 while in vivo models reveal its capacity to promote bone regeneration through angiogenesis-coupled repair, particularly in critical-sized calvarial defects. 21 Conversely, clinical observations indicate that elevated serum GDF15 levels inversely correlate with bone mineral density in postmenopausal Chinese women, suggesting an inhibitory role in osteogenesis. 22 Further investigations demonstrate that GDF15 suppresses osteoblast differentiation markers (e.g., Ocn) while concurrently promoting osteoclastogenesis in vitro. 23 These paradoxical findings underscore the multifaceted nature of GDF15 signaling, where its biological outcomes are critically modulated by microenvironmental niches, pathological states, and hormonal milieus.17,24,25 Previous studies have demonstrated that GDF15 activates both SMAD-dependent (e.g., TGF-β/SMAD and BMP/SMAD) and non-SMAD-dependent (e.g., p38 MAPK, MAPK/ERK, PI3K/AKT) downstream signaling pathways through binding to its cognate receptor.17,26 However, the functional role of GDF15 in the osteogenic differentiation of hDPSCs and its associated molecular mechanisms remain poorly understood.
This study was designed to evaluate the effects of GDF15 on the osteogenic differentiation of hDPSCs in vitro and in vivo, and to elucidate its underlying molecular mechanisms. The findings revealed that the GDF15-TGF-β/SMAD signaling axis plays a pivotal role in potentiating osteogenic differentiation of hDPSCs, thereby providing a novel therapeutic strategy for bone repair and regenerative medicine.
Materials and methods
Isolation and cultivation of hDPSCs
Intact third molars were removed from donors aged 17–22 year. The experiments were approved by the Ethics Committee, performed in compliance with the Declaration of Helsinki, and written informed consent was obtained from all participants. The procedure for isolating hDPSCs aligns with our prior research. 27 Briefly, the pulp was removed from the teeth and diced into tiny fragments (1 mm3). Then, it was digested with 3 mg/mL collagenase type I solution (Sigma-Aldrich, St. Louis, MO, USA) at 37°C for 30 min. Next, the digested pulp sediments were spread evenly in T-25 culture flasks (Jet Bio, Guangzhou, China). After 8–10 h of incubation in the cell culture incubator, growth medium (GM) was carefully introduced into the culture flasks to promote cell growth. GM was composed of alpha-minimum essential medium (Hyclone, South Logan, UT, USA) containing 10% Fetal Bovine Serum (FBS; ExCell Bio, Shanghai, China) and 1% penicillin-streptomycin 100× solution (Hyclone, South Logan, UT, USA). Replace the medium every 3 days. The hDPSCs at passages 3–5 were used in the subsequent experiments.
Colony-forming assay
In culture dishes (Jet Bio, Guangzhou, China) with a 6 cm diameter, 500 cells/well of hDPSCs were plated. The hDPSCs were cultivated in GM for 10 days before being fixed for 15 min with 4% paraformaldehyde (PFA; Beyotime, Shanghai, China), and then stained for 10 min with crystal violet staining solution (Beyotime, Shanghai, China). Image acquisition was conducted using an Epson Perfection scanner (version V330; Epson Co., Ltd., Shanghai, China) and an inverted phase-contrast microscope (Leica, Wetzlar, Germany). Moreover, the rate of colony formation was measured by ImageJ software (Media Cybernetics, Silver Springs, MD, USA).
Cell counting kit-8 (CCK-8) assay
hDPSCs were implanted in 96-well plates (Jet Bio, Guangzhou, China) at 2 × 10³ cells/well and incubated for 12 h to allow adhesion. This time point was day 0. The proliferation rates were measured on days 0, 1, 3, 5, and 7. At the specified time intervals, hDPSCs were treated with 10% CCK-8 reagent (Dojindo, Kumamoto, Kyushu, Japan) at 37℃ for 2 h. A multipurpose microplate luminescence detector (PerkinElmer, Inc., Waltham, MA, USA) was accustomed to measure the reaction solution’s optical density (OD) at 450 nm. In addition, hDPSCs were treated for 0, 1, 3, 5, and 7 days with varying doses of rhGDF15 (PeproTech; Rocky Hill, NJ, USA; 0–100 ng/mL) to assess the impact of GDF15 on the proliferative ability of hDPSCs.
Crystal violet assay
The hDPSCs were adhere-wall cultivated for 12 h after being introduced into 12-well plates (Jet Bio, Guangzhou, China) at a count of 1 × 10⁴ cells/well, then cultured in GM for 0, 1, 3, 5, and 7 days, respectively. At the designated intervals, a 4% PFA was applied to fix the cells, after that, they were dyed with a crystal violet staining solution for 10 min. The images were recorded in the same manner as for the colony-forming assay. The stained cells were lysed with 33% acetic acid (Chongqing Chuandong Chemical (Group) Co., Ltd, Chongqing, China) and the OD of the lysate was detected at 570 nm using the multifunctional microplate luminescence detector.
Flow cytometry
For surface marker identification of hDPSCs, trypsin digestion was used to harvest the cells, and then incubated for 30 min, shielded from light, with CD105-FITC, CD90-FITC, CD73-PE, CD45-FITC, CD19-FITC, and CD14-FITC (BD Pharmingen, San Diego, CA, USA). PE or FITC served as the isotypic controls. Flow cytometry analysis was conducted utilizing BD flow cytometry (BD Biosciences, San Jose, CA, USA).
Osteogenic differentiation of hDPSCs
hDPSCs were seeded into culture plates at a density of 1 × 10⁵ cells/mL. Upon reaching 80% confluence, GM was replaced with osteogenic induction medium (OM), where OM was made by adding 5 mM β-glycerophosphate (Sigma-Aldrich, St. Louis, MO, USA), 50 μg/mL ascorbic acid (Solarbio, Beijing, China) and 100 nM dexamethasone (Solarbio, Beijing, China) to GM. Following Gdf15 overexpression or knockdown in hDPSCs, osteogenic induction was performed using OM. Furthermore, rhGDF15 (10–100 ng/mL) was introduced to the OM for cell induction.
Alkaline phosphatase (ALP) staining
hDPSCs were fixed with 4% PFA for 15 min. According to the manufacturer’s instructions, after rinsing with distilled water to remove residual fixative, the hDPSCs were stained using the BCIP/NBT Alkaline Phosphatase Color Development Kit (Beyotime, Shanghai, China) for 10 min. The images were recorded in the same manner as for the colony-forming assay.
Alizarin red S (ARS) staining
After 15 min of 4% PFA fixation, hDPSCs were stained for 10 min with 1% ARS (Sigma-Aldrich, St. Louis, MO, USA). The cells were rinsed repeatedly with distilled water and air-dried before acquiring images. Additionally, the stained cells were lysed with cetylpyridinium chloride monohydrate (Solarbio, Beijing, China), and the OD of the lysate was determined at 562 nm.
Quantitative real-time PCR (qPCR)
Total RNA was isolated utilizing RNAiso Plus (TaKaRa, Tokyo, Japan), and complementary DNA was synthesized employing the PrimeScript™ RT kit (TaKaRa, Tokyo, Japan). qPCR was executed in compliance with the experimental protocols described in the handbook using the QuantiNova SYBR Green PCR Kit (QIAGEN, Duesseldorf, Germany) and the fluorescence quantitative PCR instrument system (Bio-Rad, Hercules, CA, USA). Gapdh was the internal point of reference. Table 1 contains a list of the target gene sequences.
Sense and antisense primers for qPCR.

Western blotting (WB)
hDPSCs were lysed using a cold RIPA lysis solution (Beyotime, Shanghai, China) with a mixture of protease and phosphatase inhibitors (Beyotime, Shanghai, China). Cells were further lysed using an ultrasonic cell crusher (SCIENTZ, Zhejiang, China) at low temperature. Protein samples were then standardized using a BCA Protein Assay Kit (Beyotime, Shanghai, China). For the extraction of cytoplasmic and nuclear proteins, nuclear and cytoplasmic extraction reagents (Thermo Fisher Scientific, Waltham, MA, USA) were employed to separate them following the manufacturer’s instructions. For plasma membrane protein extraction, the Plasma Membrane Protein Extraction Kit (Proteintech, Wuhan, China) was employed according to the manufacturer’s instructions. After being separated utilizing TGX Stain-Free™ FastCast™ Acrylamide Solutions (Bio-Rad, Hercules, CA, USA), the protein samples were subsequently transferred on polyvinylidene fluoride membranes (Merck Millipore, Billerica, MA, USA). The membranes were blocked for 1 h at room temperature by placing them in 5% skim milk (BioSharp, Hefei, China) or 5% bovine serum albumin (BSA; BioFroxx, Einhausen, Germany) solution. Next, the membranes were incubated in primary antibody solution overnight at 4°C and in HRP-conjugated secondary antibody (Bio-Rad, Hercules, CA, USA) for 2 h. Finally, membranes were visualized with a WB analytical imaging system (Bio-Rad, Hercules, CA, USA). Table 2 lists the primary antibody concentrations that were employed.
Antibody source and application concentration for WB analysis.

Co-immunoprecipitation (Co-IP)
Following stimulation of hDPSCs with rhGDF15 (20 ng/mL) for 30 min, membrane proteins were extracted. The GDF15 antibody (Santa Cruz Biotechnology, Dallas, USA; sc-377195) was conjugated to protein A/G magnetic beads (MedChemExpress, New Jersey, USA) using a rotary mixer (Bio-Rad, Hercules, CA, USA) under sequential conditions: 30 min at room temperature and 2 h at 4°C. Subsequently, the extracted membrane proteins were incubated with the antibody-bead complexes in the rotary mixer under identical conditions (30 min at room temperature and 2 h at 4°C). After thorough washing, the protein samples were eluted by heat-denaturation (95°C for 5 min) and subjected to Sodium Dodecyl Sulfate Polyacrylamide Gel Electrophoresis analysis.
Enzyme-linked immunosorbent assay (ELISA)
Upon reaching 80% confluence, hDPSCs were designated as day 0 cultures, at which point the GM was replaced with OM for subsequent cultivation. The supernatants from the cell cultures were obtained on days 0, 1, 4, 9, 14, and 21 of OM culture (the old medium was substituted with a new one the day before sample collection, and the medium was collected when the cells were incubated for 24 h) and stored at −80℃. The samples were assayed following the instruction manual of the human GDF-15 ELISA Kit (Abclonal, Wuhan, China), and the GDF15 concentration of the corresponding samples was calculated.
Gdf15 overexpression by lentiviral transfection
Lentiviruses expressing Gdf15 and negative control (NC) were bought from Shanghai Genechem Co., Ltd. (Shanghai, China). hDPSCs were exposed to lentivirus-containing supernatants for 16 h, and the transfection mix was immediately substituted by GM. After 72 h, puromycin (2 μg/mL, Sigma-Aldrich, St. Louis, MO, USA) was introduced into the transfected cells for antibiotic screening.
Gdf15 knockdown by siRNAs
The small interfering RNAs (siRNAs) targeting Gdf15 and negative control siRNA (siNC) were procured from Sangon Biotech (Shanghai) Co., Ltd. (Shanghai, China). siRNAs were transfected when cells were confluent to approximately 60%. Briefly, Lipofectamine™ 3000 (Thermo Fisher Scientific, Waltham, MA, USA) and siRNAs were diluted separately with Opti-MEM reduced serum medium (GIBCO BRL, Grand Island, NY, USA), and the diluted liquids were then equitably mixed and subsequently incubated with hDPSCs for 48 h at 37℃. The transfection efficiency of hDPSCs was detected at this time. In subsequent experiments, the transfection reagents were replaced immediately after hDPSCs transfection for 48 h and then switched to OM for culturing. The sequences of siRNAs targeting Gdf15 are exhibited in Table 3.
Sense and antisense sequences for Gdf15 knockdown by siRNAs.

Animals
Nude (BALB/cA-nu) mice and Sprague-Dawley rats were all obtained by Chongqing Tengxin Biotechnology Co., Ltd. (Chongqing, China). All animal experiments were approved by the Ethics Committee and conducted according to the ARRIVE guidelines.
Subcutaneous transplantation in nude mice
After treating hDPSCs with rhGDF15 (20 ng/mL) for 5 days, 4 × 10⁶ hDPSCs were mixed with 30 mg of hydroxyapatite/β-tricalcium phosphate (HA/β-TCP) granular scaffolds (Sichuan Baimeng Bioactive Materials Co., Ltd.; Sichuan, China), and immediately implanted into the dorsal subcutis of 10-week-old male nude mice. After 8 weeks, the implants were obtained, fixed overnight in 4% PFA, decalcified in 10% Ethylene Diamine Tetraacetic Acid, then paraffin-embedded and sectioned.
Healing of calvarial defects in rats
In 8-week-old rats, circular bone fragments with a diameter of 5 mm were removed from both sides of the calvarial apex of the rat skull using a surgical ring drill at a speed of 1000 rpm. Saline cooling was maintained throughout the procedure to prevent thermal damage. When hDPSCs were treated with GM for 5 days with or without adding 20 ng/mL rhGDF15, the cells were used in in vivo experiments. The hDPSCs were suspended in 10% Gelatin methacryloyl (GelMA) at 1 × 10⁷ cells/mL to prepare GelMA/hDPSCs complex liquid implants. Moreover, rhGDF15 was mixed with 10% GelMA at 20 ng/mL to prepare the GelMA/rhGDF15 complex. The prepared complex liquid implants were placed in a cell incubator at 37℃ for backup. Subsequently, GelMA loaded with hDPSCs, rhGDF15, or rhGDF15-hDPSCs were transplanted into a 5 mm diameter calvarial defect area as the experimental groups (referred to as hDPSCs + GelMA, rhGDF15 + GelMA, and rhGDF15-hDPSCs + GelMA groups), with only defect constructed control groups and only GelMA implanted control groups used as controls (referred to as blank group and GelMA group). Subsequently, 50 μL of the liquid implant was added to bone hole and immediately fixed with UV light. Samples were taken 8 weeks after surgery, and then bone healing was assessed using micro-CT and Masson, H&E, and immunochemical staining.
Micro-CT analysis
Samples were imaged and analyzed using a viva CT 40 micro-CT scanner (SCANCO Medical AG, Wangen-Bruttisellen, Switzerland). The scanning resolution for the rat calvaria was 17.5 μm. The scanned data were reconstructed in three dimensions using the viva CT 40 correspondence analysis software and bone volume (BV), BV/ total volume (TV) (BV/TV), trabecular number (Tb.N), and trabecular separation (Tb.Sp) were calculated for each sample.
Hematoxylin & eosin (H&E) staining
Staining was implemented utilizing the H&E staining kit (Solarbio, Beijing, China): hematoxylin for 3 min, differentiation in hydrochloric acid alcohol for 30 s, and eosin for 10 min. The sections were scanned using a Research Grade Whole Slide Scanning System SLIDEVIEW VS200 (Olympus, Tokyo, Japan). To quantify the new bone generated within the grafts, the percentage of the bone formation area was computed using ImageJ software for five images from different regions of the implant.
Masson staining
In accordance with the manufacturer’s instructions, sections were stained employing a Masson staining kit (Solarbio, Beijing, China). The sections were analyzed in a manner consistent with H&E staining.
Immunohistochemical staining
Paraffin sections were dewaxed and then hydrated, heat repair was used to expose the antigenic epitopes, and the primary antibody was incubated with the samples at 4°C for a whole night after being blocked for 10 min with an endogenous peroxidase blocker (ZSGB-BIO, Beijing, China) and 1 h with 10% goat serum (ZSGB-BIO, Beijing, China) at room temperature. Next, the samples were subjected to incubation by an enzyme-labeled sheep anti-mouse IgG polymer (ZSGB-BIO, Beijing, China) for 1 h. Subsequently, freshly prepared DAB color solution (ZSGB-BIO, Beijing, China) was dropped into the samples and allowed to incubate for 1–5 min. The nuclei were then stained for 30 s using a hematoxylin staining solution. Images were acquired using a Research Grade Whole-Slide Scanning System SLIDEVIEW VS200. The concentrations of primary antibodies used are listed in Table 4.
Antibody source and application concentration for immunohistochemical staining.

Immunofluorescence staining
The hDPSCs were fixed with 4% PFA for 15 min, incubated with 0.3% Triton X-100 (Beyotime, Shanghai, China) for 10 min, and blocked with 3% BSA for 1 h. Primary antibodies are incubated with cells for a whole night at 4℃. Subsequently, the cells were incubated with a fluorescent-labeled secondary antibody (Thermo Fisher Scientific, Waltham, MA, USA) at room temperature for 1 h. Finally, nuclear staining was performed with DAPI (Beyotime, Shanghai, China) for 10 min.
For the new bone tissue in calvarial defects in rats, after the tissue was made into paraffin sections, the samples on the sections were deparaffinized, rehydrated, and repaired at high temperatures. The samples were permeabilized with 0.3% Triton X-100 for 10 min and blocked with 10% goat serum (ZSGB-BIO, Beijing, China) for 1 h. The primary antibody was incubated at 4℃ overnight, after which the secondary antibody was incubated for 1 h at room temperature. Subsequently, nuclear staining was performed with DAPI. Images were observed and recorded under the fluorescent microscope Zeiss Axio Observer 7 (Zeiss, Aalen, Germany). Fluorescence intensity was evaluated quantitatively utilizing ImageJ tools.
For immune co-localization analysis of the subcutaneous implants in nude mice, multiplex fluorescence immunohistochemical staining was performed using the Multiplex Immunohistochemistry Kit (Panovue, Beijing, China) following the manufacturer’s protocol. Briefly, tissue sections were deparaffinized and rehydrated, followed by heat-mediated antigen retrieval. Sequential incubations with primary and secondary antibodies were conducted using reagents provided in the kit. Antibody stripping was subsequently performed using the included elution buffer to remove bound antibodies, allowing sequential re-incubation with additional primary and secondary antibodies for multiplex staining. Table 5 lists the main antibody concentrations that were employed.
Antibody source and application concentration for immunofluorescence staining.

Proteomic analysis
Liquid chromatography-tandem mass spectrometry (LC-MS/MS; Shanghai Zhongke New Life Biotechnology Co., Ltd, Shanghai, China) was utilized for proteomic analysis of hDPSCs treated with OM or OM containing 20 ng/mL rhGDF15 for 6 h. Sample lysis of hDPSCs was performed using SDT buffer (4% SDS, 100 mM Tris-HCl, pH 7.6). The protein samples were prepared using filter-assisted sample preparation. Briefly, the samples were mixed in 10 mM dithiothreitol (DTT) for 1.5 h; after being exposed to 20 mM iodoacetamide, the samples were dark-stored for 30 min. Ultimately, the peptides that were produced were gathered as filtrates after trypsin was introduced to the samples and digested overnight (15–18 h) at 37°C. The filtrate was desalted on C18 Cartridges (Empore™ SPE Cartridg C18). LC-MS/MS analysis was conducted using a Q mass spectrometer (Thermo Fisher Scientific). Utilizing MaxQuant software (version 1.6.14), the MS raw data for every sample was combined and retrieved for identification and quantitative analysis. Hierarchical cluster analysis was conducted using Cluster (version 3.0) and Java Treeview software. Motifs were analyzed using MeMe, and protein subcellular localization was predicted using CELLO, a multi-class SVM classification system. The sequences of the differentially expressed proteins were analyzed utilizing InterProScan and the NCBI BLAST+ client software to discover homologous sequences. The Blast2GO program was utilized to map Gene Ontology (GO) terms and annotate sequences. The proteins under investigation were also compared against the online Kyoto Encyclopedia of Gene Genomes (KEGG) database for pathway analysis.
Molecular docking analysis
The proteins used for docking were GDF15 (UniProt ID: Q99988) and TGF-βR2 (UniProt ID: P37173), with structural models retrieved from the AlphaFold Protein Structure Database. Protein-protein molecular docking was performed using the HDOCK server. 28 The protein-protein binding sites are shown in Supplemental Table S1. Binding free energy calculations and residue-level energy decomposition were conducted via the MM/GBSA module of the HawkDOCK server, enabling ranking of amino acid residues based on their energetic contributions (Supplemental Table S2). 29 The docking score was used as the evaluation criterion for molecular docking. Among the 10 output conformations, the optimal docking model was selected, and its binding energy was calculated. Finally, the top-ranked binding poses exhibiting favorable interaction energies were visualized using PyMOL 2.4 software.
Statistical analysis
All experiments were performed with a minimum of three independent replicates. The data are presented as mean ± standard deviation. To do statistical studies, GraphPad Prism 9 (GraphPad, San Diego, CA) was utilized. One-way ANOVA or the Student’s t-test were among the techniques employed to determine significance, with a p < 0.05 deemed significant.
Results
The secretion of GDF15 was upregulated during the osteogenic differentiation of hDPSCs
In the extracted hDPSCs, it was observed that the cells had a spindle-shaped morphology (Figure 1(a)), strong clone formation (Figure 1(b)), proliferation (Figure 1(c) and (d)) and osteogenic differentiation (Figure 1(e), (f), (h), and (i)), and were positive for the cell surface markers CD73, CD90, and CD105 (Figure 1(g)). During induction of differentiation, mRNA expression of Gdf15 was significantly increased especially on days 14 and 21 (Figure 1(h)). WB detected a down-regulation of intracellular GDF15 protein levels (Figure 1(i)), but the results of ELISA pointed to an increase in extracellular secretion of GDF15 (Figure 1(j)).

GDF15 secretion was significantly upregulated during the osteogenic differentiation of hDPSCs. (a) Morphology of primary hDPSCs. Scale bars (white): 100 μm. Morphology of passage 3 hDPSCs at 24 h of culture. Scale bars (black): 250 μm. P0 = Passage 0; P3 = Passage three. (b) Colony-forming assay to assess the self-renewal ability of hDPSCs. Scale bars: 250 μm. (c) The CCK-8 assay was employed to assess the proliferation of hDPSCs. (d) Proliferation of hDPSCs detected by crystal violet staining. Scale bars: 250 μm. (e) ALP staining of hDPSCs grown in OM for a week. Scale bars: 250 μm. (f) ARS staining of 21-day-cultured hDPSCs in OM and quantitative analysis of mineralized nodule deposition. Scale bars: 250 μm. (g) Flow cytometry demonstrated that the hDPSCs highly expressed CD105, CD90, and CD73; and lowly expressed CD45, CD19, and CD14. (h) During induction, intracellular mRNA levels of Gdf15 and osteogenic-specific genes (Alp, Runx2, Osx, Ocn, and Dspp) were elevated. (i) During induction, osteogenic-specific proteins (ALP, RUNX2, OPN, DMP1, and DSPP) were upregulated and intracellular GDF15 protein was reduced in hDPSCs. Relative quantitative analysis of gray scale values of protein bands. The internal control was GAPDH. (j) Increased GDF15 secretion was detected by ELISA after osteogenic induction. Data were displayed as mean ± SD (*p < 0.05, **p < 0.01, ***p < 0.001, ****p < 0.00001).
Gdf15 overexpression promoted osteogenic differentiation of hDPSCs in vitro
Gdf15 was successfully overexpressed in hDPSCs by lentiviral transduction (Figure 2(a)–(d)). ALP staining exhibited an increase in its staining intensity in comparison to the NC group following 7 days of induced culture of transfected hDPSCs (Figure 2(e)). Similarly, on days 14 and 21, the overexpression group had stronger ARS staining intensity and more mineralized nodules (Figure 2(f)). Furthermore, the overexpression group had significantly higher levels of osteogenic-specific genes (Alp, Col1a1, Runx2, Osx, and Dmp1) during induction (Figure 2(g)). These results indicated that Gdf15 overexpression may facilitate differentiation of hDPSCs toward osteogenic direction.

Gdf15 overexpression promoted osteogenic differentiation of hDPSCs in vitro, while Gdf15 knockdown suppressed it. (a) Images of GFP-positive hDPSCs were observed using fluorescence microscopy. Scale bars: 200 μm. GFP, Green Fluorescent Protein. (b) Relative mRNA expression of Gdf15 in the NC and Gdf15 overexpression (Gdf15) groups. (c) Protein levels of GDF15 in the NC and Gdf15 groups. (d) Relative mRNA expression of Gdf15 in Gdf15 overexpressing hDPSCs after 7, 14, and 21 days of incubation in the OM. (e) ALP staining of the Gdf15 and NC groups on day 7 of osteogenic differentiation. (f) ARS staining and quantitative analysis of overexpressed hDPSCs were performed on days 7, 14, and 21 of osteogenic differentiation. (g) Osteogenic-specific genes (Alp, Col1a1, Runx2, Osx, and Dmp1) and their relative mRNA levels in hDPSCs was examined by qPCR on days 7, 14, and 21 of the induced differentiation. (h) Relative mRNA expression of Gdf15 in the siNC and Gdf15 knockdown (siGdf15) groups. (i) GDF15 protein levels in siNC and siGdf15 groups. (j) Relative mRNA expression of Gdf15 in siRNA-transfected hDPSCs after 7, 14, and 21 days of incubation in the OM. (k) ALP staining in the siNC and siGDF15 groups on day 7 of induced differentiation. (l) ARS staining and quantitative analysis were performed on hDPSCs transfected with siRNA on days 7, 14, and 21 of induced differentiation. (m) Relative mRNA levels of Alp, Col1a1, Runx2, Osx, and Dmp1 in siRNA-transfected hDPSCs on days 7, 14, and 21 of induced differentiation. Scale bars: 250 μm (ALP and ARS staining); Mean ± SD was employed to express all data (*p < 0.05, **p < 0.01, ***p < 0.0001, ****p < 0.00001).
Gdf15 knockdown inhibited osteogenic differentiation of hDPSCs in vitro
Three siGdf15 (siGdf15-a, siGdf15-b, and siGdf15-c) sequences were designed for hDPSC siRNA gene knockdown experiments. Follow-up experiments selected siGdf15-a because it had the highest knockdown efficiency (Figure 2(h)–(j)). Compared with the siNC group, the ALP staining intensity of siGdf15 group was decreased on day 7 of induction (Figure 2(k)). Similarly, on days 14 and 21, ARS staining intensity decreased and fewer mineralized nodules were detected in the siGdf15 group (Figure 2(l)). qPCR revealed that in the siGdf15 group, the mRNA levels of genes relevant to osteogenic processes were reduced (Figure 2(m)). These results suggested that Gdf15 knockdown could inhibit osteogenic differentiation of hDPSCs.
RhGDF15 promoted the osteogenic differentiation of hDPSCs
For proliferation, Ki67 immunofluorescence staining exhibited that GDF15 significantly promoted hDPSC proliferation. From day 3 to 7, the cell proliferation rate of rhGDF15 treatment groups were faster than that of control group, and the 20 ng/mL treatment group was the fastest (Supplemental Figure S1A, B). Moreover, the results of the CCK-8 test are consistent with this (Supplemental Figure S1C). These results suggested that rhGDF15 can promote hDPSC proliferation in vitro.
The effect of rhGDF15 on osteogenic differentiation of hDPSCs was investigated in vitro. ALP staining on day 7 of induction and ARS staining on day 21 of induction exhibited stronger staining intensity and more calcium deposition in the rhGDF15-treated groups (Figure 3(a)–(c)). The rhGDF15-treated groups depicted increased mRNA expression of Alp and Runx2 on day 7, upregulation of Col1a1 and Osx on day 14, and a significant increase in Ocn, Dmp1, and Dspp on day 21 (Figure 3(f)). Furthermore, WB analysis exhibited that the levels of COL1A1, RUNX2, DMP1 and DSPP proteins were significantly increased in the rhGDF15 (20–100 ng/mL)-treated groups (Figure 3(d) and (e)). Therefore, 20 ng/mL rhGDF15 was selected in subsequent research. Further analysis revealed that the 20 ng/mL rhGDF15-treated group had stronger ALP staining (Figure 3(g)) on days 3, 5, and 7 of induction, stronger ARS staining (Figure 3(h)) on days 7, 14, and 21, and produced more mineralized nodules (Figure 3(i)). COL1A1 protein expression was higher in the 20 ng/mL rhGDF15-treated group on day 7 of induction than in the control group, while DMP1 expression was higher on day 14. RUNX2, OPN, and DSPP protein levels were significantly upregulated on both day 7 and day 14 (Figure 3(j)). Based to these findings, rhGDF15 can stimulate the osteogenic lineage differentiation of hDPSCs in vitro.
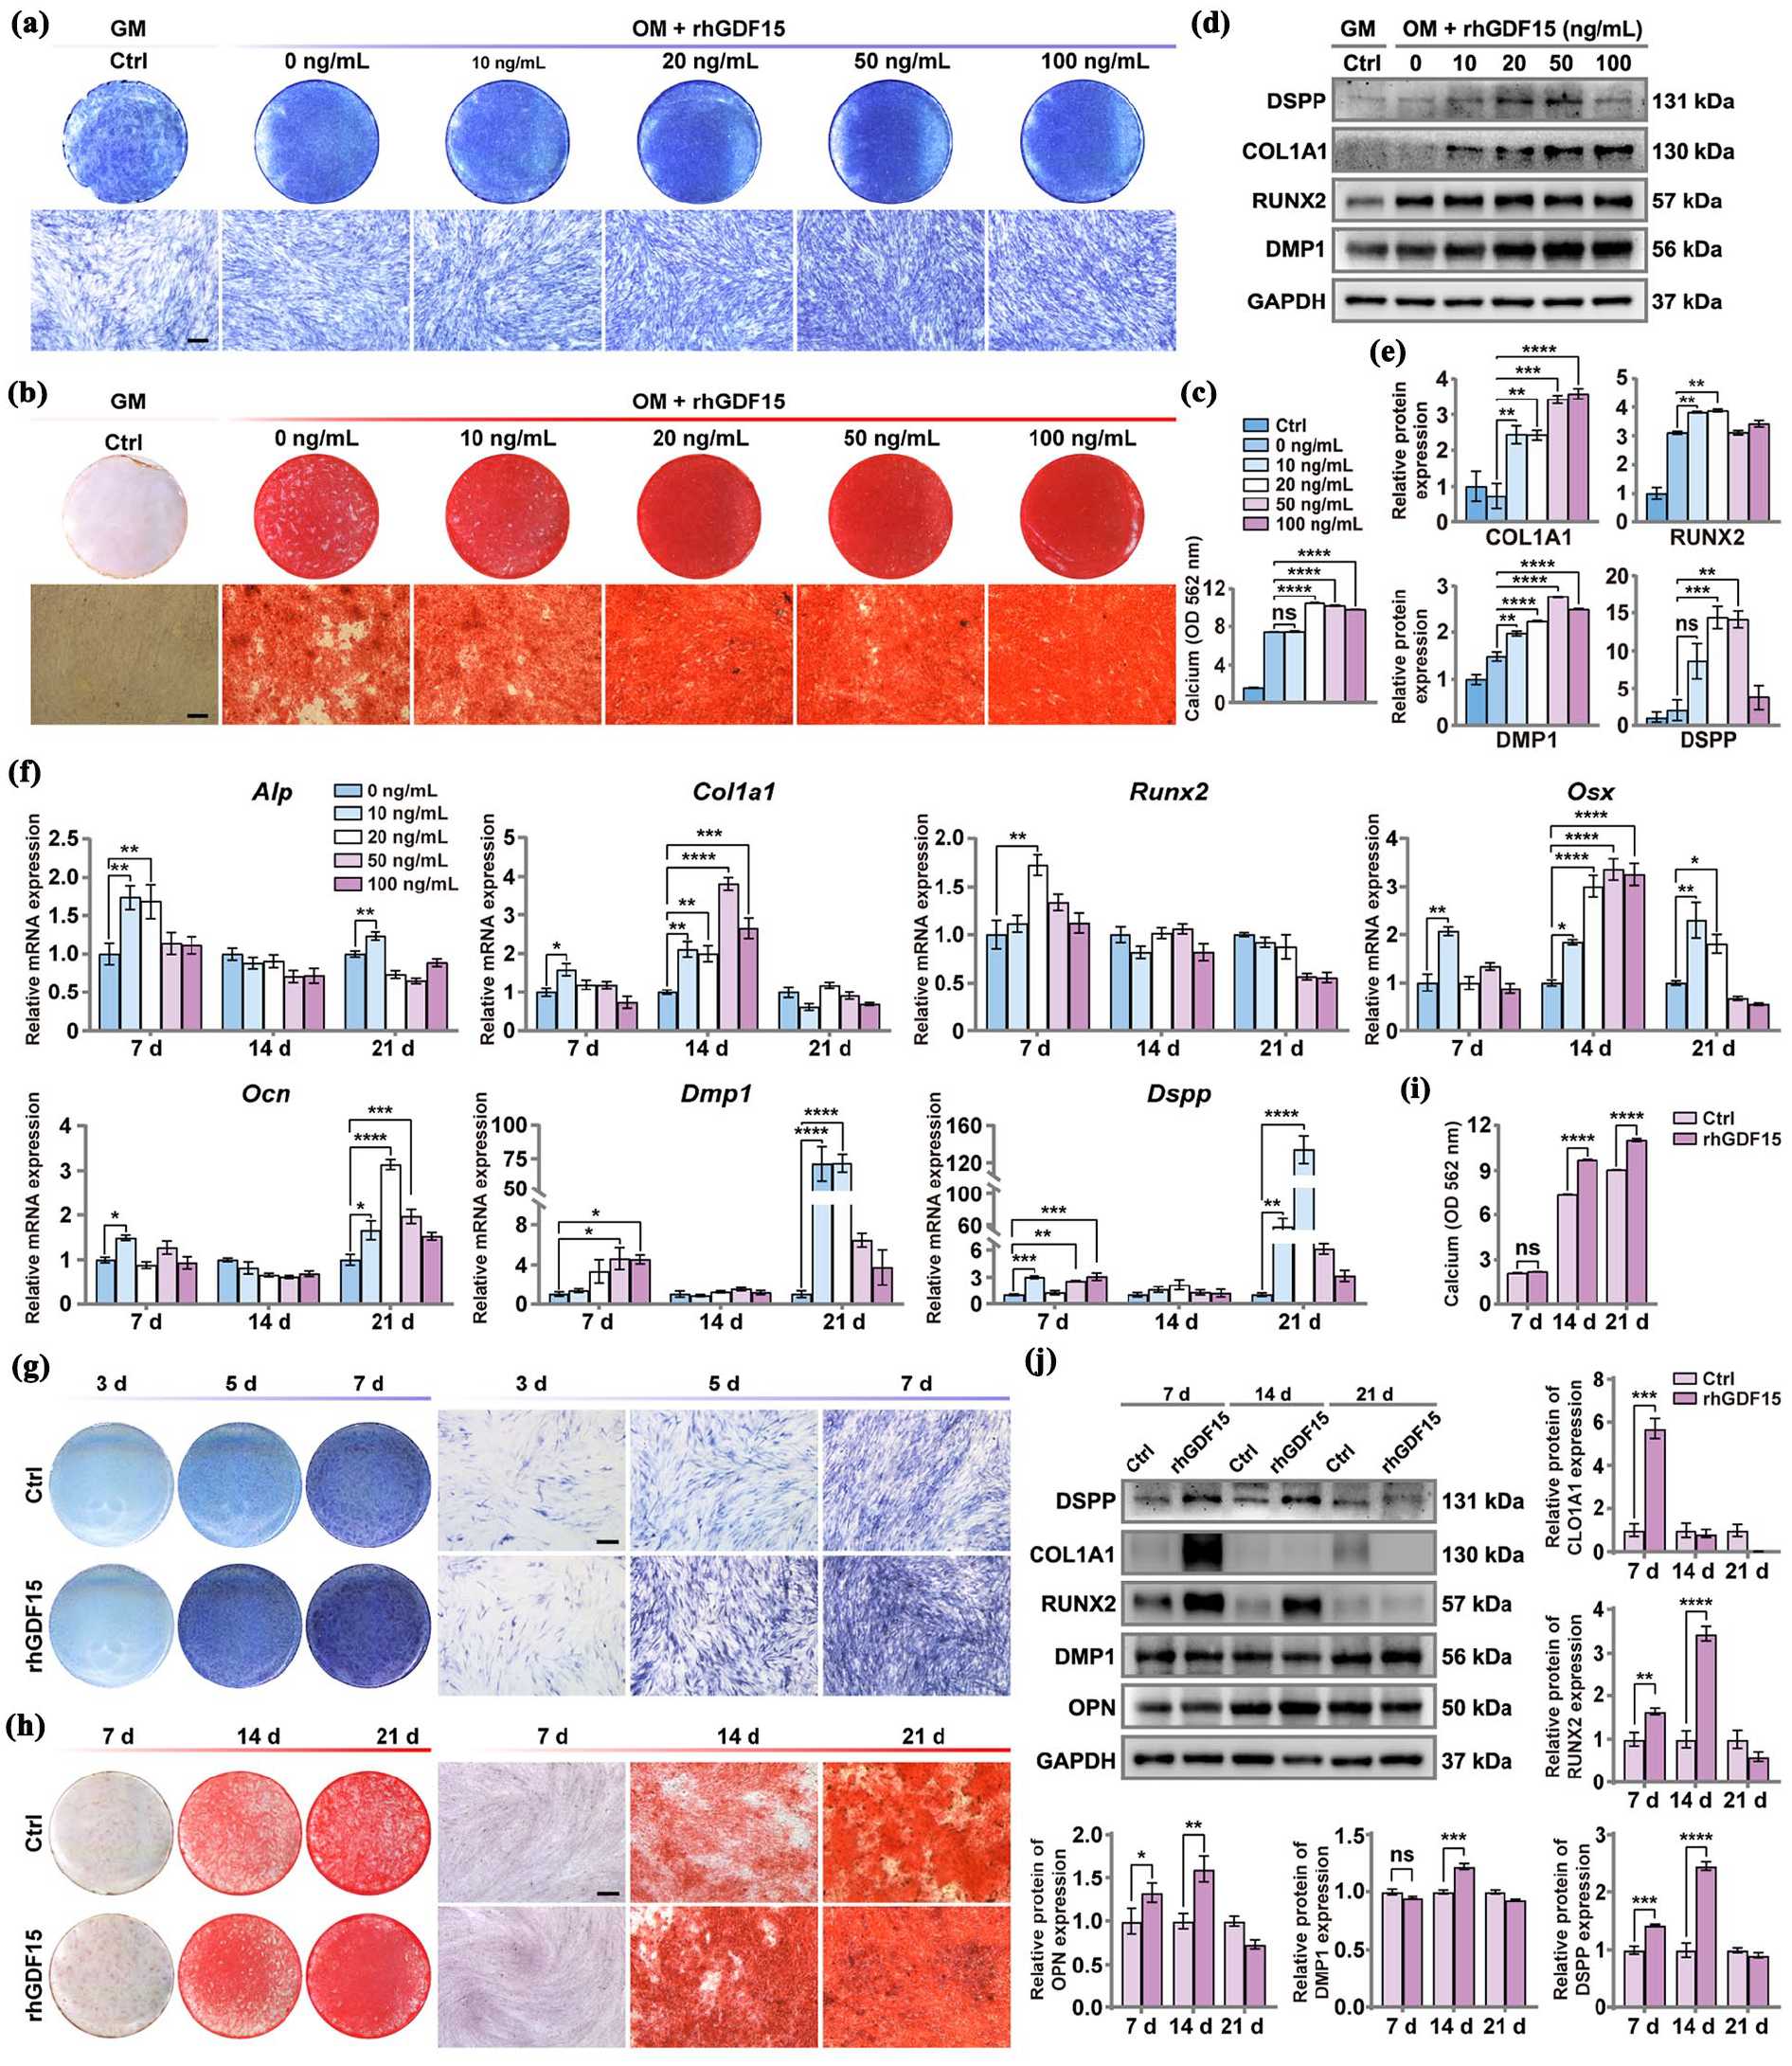
rhGDF15 stimulated the osteogenic differentiation of hDPSCs in vitro. (a) ALP staining was conducted after treating hDPSCs for a duration of 7 days. (b) Typical pictures of ARS staining on day 21 of induction. (c) Relative quantitative analysis of ARS staining. (d) Expression of osteogenic-specific proteins (COL1A1, RUNX2, DMP1, and DSPP) on day 7 of osteogenic differentiation. (e) Grayscale analysis of the protein bands. (f) Relative mRNA levels of osteogenic-specific genes (Alp, Col1a1, Runx2, Osx, Ocn, Dmp1, and Dspp) on days 7, 14, and 21 of induction. (g) Results of ALP staining of hDPSCs cultivated in OM containing 20 ng/mL rhGDF15 at 3, 5, and 7 days. (h) ARS staining images of hDPSCs cultured with OM containing 20 ng/mL rhGDF15 at 7, 14, and 21 days. (i) Relative quantitative analysis of ARS staining. (j) Expression of osteogenic-specific proteins (COL1A1, RUNX2, OPN, DMP1, and DSPP) in hDPSCs was detected by WB on days 7, 14, and 21 after stimulation by 20 ng/mL rhGDF15 and grayscale analysis of protein bands. Scale bars: 250 μm. Data were displayed as mean ± SD (*p < 0.05, **p < 0.01, ***p < 0.001, ****p < 0.0001).
GDF15 promoted osteogenesis in vivo
To evaluate the effects of GDF15 on bone formation in vivo, HA/β-TCP scaffolds loaded with rhGDF15-treated hDPSCs were subcutaneously implanted into nude mice (Figure 4(a)). As confirmed by H&E staining (Figure 4(b) and (d)) and Masson’s staining (Figure 4(c) and (e)) analysis, in comparison to the untreated hDPSCs group, the rhGDF15-treated group exhibited a considerably higher percentage of bone formation area to total implant area. Furthermore, osteogenic-specific proteins (OPN, DMP1, and DSPP) were considerably more expressed in implants of the rhGDF15-treated groups than in the control group (Figure 4(f)). Further, we employed a rat calvarial defect model to explore the bone healing ability of hDPSCs treated with rhGDF15. GelMA loaded with hDPSCs, rhGDF15, or rhGDF15-hDPSCs were transplanted into a 5 mm diameter calvarial defect area as the experimental groups (Figure 4(g) and (h)). Eight weeks later, micro-CT analysis demonstrated that the experimental groups exhibited significantly enhanced new bone formation, progressing from the peripheral to the central regions of the defect site, compared to the GelMA control group (Figure 4(h)). Quantitative measurements analysis depicted that in the rhGDF15-hDPSCs + GelMA group, the BV/TV and Tb.N of new bone were all greater than those in the GelMA group. Conversely, Tb.Sp exhibited the opposite trend (Figure 4(i)). H&E staining (Figure 4(j) and (k)) and Masson’s staining (Figure 4(l)) revealed that a minimal quantity of bone was generated at the boundary of the defect in GelMA group. In the experimental groups, significant new bone production was seen, particularly in the rhGDF15 + GelMA and rhGDF15-hDPSCs + GelMA groups (Figure 4(j)–(l)). The expression of OPN and DMP1 in the bone defect area was considerably greater in the rhGDF15 + GelMA and rhGDF15-hDPSCs + GelMA groups compared to the GelMA group, according to immunofluorescence analysis (Figure 4(m) and (n)). The above findings reflected that rhGDF15 significantly promoted the osteogenic differentiation of hDPSCs, thereby facilitating bone tissue regeneration.
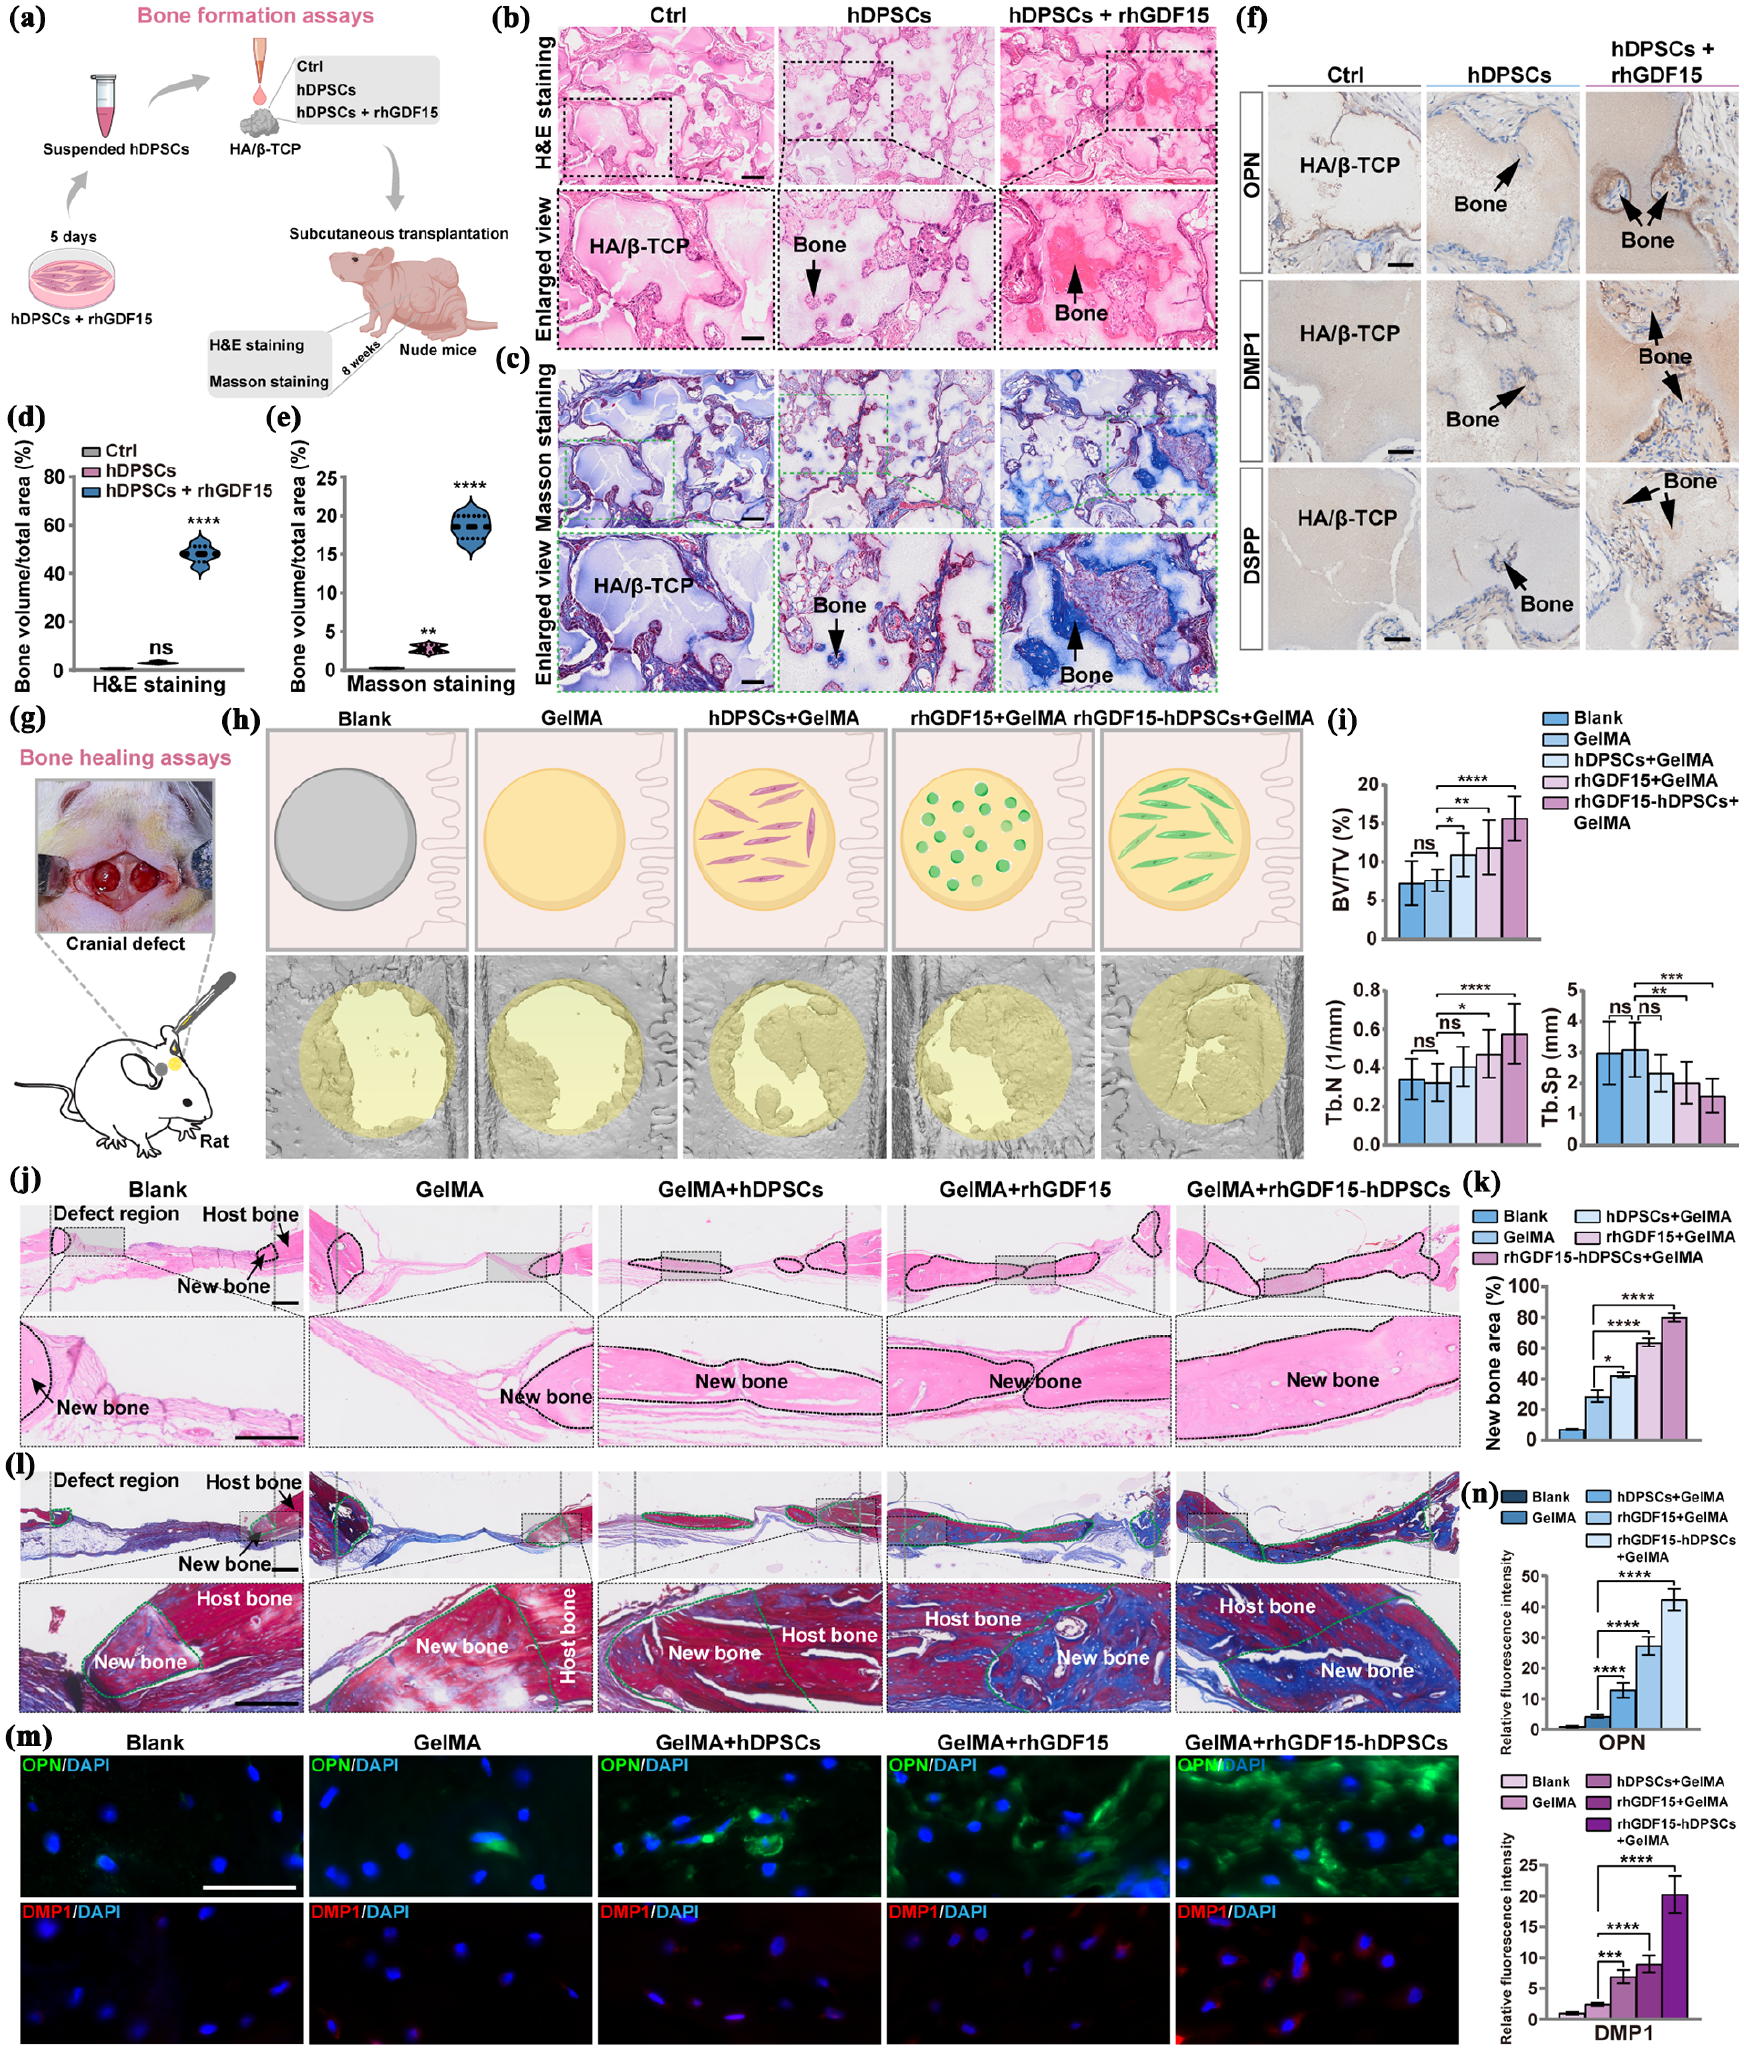
rhGDF15 promoted bone formation and bone repair in vivo. (a) Schematic diagram depicting the experimental workflow to assess the impact of rhGDF15 on bone formation. (b and c) Typical pictures of Masson and H&E staining of bone formation areas in the implant. Scale bars: 200 μm. Black or green boxes indicate enlarged areas. Scale bars: 100 μm. The arrow indicates the bone tissue in the implants. (d and e) Quantitative evaluation of Masson and H&E staining. (f) Typical photos of immunohistochemical staining for OPN, DMP1, and DSPP in the bone-forming region of the implant. Scale bars: 50 μm. Arrows indicate the osteogenic regions within the implants. (g) Diagrammatic representation of calvarial defect model in rats. (h) Schematic diagram of the experimental grouping of calvarial defects. Eight weeks after transplantation, the defect area was reconstructed using micro-CT analysis. The yellow circle indicated a 5 mm defect area. (i) BV/TV, Tb.N, and Tb.Sp was qualitatively measured. (j and l) Representative pictures of Masson and H&E staining of the area of new bone formation. Scale bars: 500 μm. Magnified images (gray squares) were captured at the center and edges of the calvarial defect. Scale bars: 250 μm. The gray dashed lines indicate the boundaries of the defect area. Irregular areas circled by black or green dashed lines indicate new bone creation in the area of the defect. Arrows indicate new bone or the host bone. (k) Percentage of new bone area in defect region. (m) Immunofluorescence staining to visualize the expression of DMP1 and OPN in the region of new bone formation. Scale bars: 100 μm. (n) The immunofluorescence staining of DMP1 and OPN was quantified. Mean ± SD was employed to express all data (*p < 0.05, **p < 0.01, ***p < 0.001, ****p < 0.0001).
RhGDF15 activated TGF-β/SMAD cellular signaling of hDPSCs
Studies have demonstrated that glial cell-derived neurotrophic factor family receptor alpha-like protein (GFRAL) identified in the brain is a receptor for GDF15.30,31 However, in the present study, Gfral mRNA was barely expressed in hDPSCs after the cells were treated with OM containing rhGDF15 for 7, 14, and 21 days, respectively (Supplemental Figure S2A–C). Next, hDPSCs were subjected to proteomic analysis, where hDPSCs were treated with OM (OM group) or OM containing rhGDF15 (OM + rhGDF15 group). Differentially expressed proteins of hDPSCs were analyzed through heatmap analysis (Figure 5(a)) and visualized by volcano plot (Figure 5(b)). 5824 proteins were found in both extracts, with 26 proteins uniquely present in the OM + rhGDF15 group compared to the OM group (Figure 5(c)). Based on subcellular localization analysis, the majority of these proteins (48.21%) were found in the nucleus (Figure 5(d)). GO enrichment analysis depicted that the more prominent terms in molecular functions as binding, in cellular components as cell, and biological processes as cellular processes (Figure 5(e)). Pathway enrichment analysis of the KEGG identified the TGF-β signaling pathway as the most highly enriched pathway (Figure 5(f)).

Proteomic analysis identified significant enrichment of the TGF-β/SMAD signaling pathway. (a) Proteins that are differently expressed in the OM and OM + rhGDF15 groups are displayed in a heatmap. (b) Volcano map. Blue means comparatively little expression, whereas red exhibits comparatively strong expression. (c) Venn Diagram Analysis. (d) Subcellular localization analysis. (e) Enriched GO terms ranked top in molecular functions, cellular components, and biological processes. (f) Enrichment KEGG analysis of the top 20 in the bubble chart. The p value is represented by the color, and the number of proteins with differential expression is shown by the size of the dots.
Ligands attach to target cell membrane receptors in the TGF-β/SMAD signaling pathway to initiate downstream signaling. 32 Through qPCR analysis, we detected that Gdf15 overexpression significantly upregulated the mRNA levels of Tgf-βr2 in hDPSCs (Figure 6(a)); similarly, Gdf15 knockdown decreased the mRNA its level (Figure 6(b)). Furthermore, during induction, rhGDF15 treatment upregulated the mRNA levels of Tgf-βr2 in hDPSCs (Figure 6(c)). Molecular docking analysis visualized top-ranked binding sites with favorable interaction energies, enabling direct observation of the GDF15-TGF-βR2 complex interface (Figure 6(d)). Furthermore, Co-IP assays confirmed the interaction between GDF15 and TGF-βR2 on the plasma membrane of hDPSCs (Figure 6(e)).

rhGDF15 activated TGF-β/SMAD signaling pathway in hDPSCs. (a and b) Tgf-βr2 mRNA levels in hDPSCs overexpressing or knockdown of Gdf15 were measured after culturing in OM for 7, 14, and 21 days. (c) Tgf-βr2 mRNA levels in hDPSCs treated with OM containing rhGDF15 were measured after 7, 14, and 21 days of culture. (d) Structural modeling for molecular docking analysis of GDF15 and TGF-βR2. GDF15 and TGF-βR2 are depicted in blue-purple and orange-yellow, respectively. Hydrogen bonds are indicated in yellow. (e) Co-IP assay showing representative protein bands of GDF15 and TGFβ-R2 in hDPSCs. (f) Levels of TGF-β/SMAD signaling pathway-specific proteins after 20 ng/mL rhGDF15 treatment of hDPSCs for the indicated times were tested utilizing WB and grayscale analysis of protein bands. (g) Levels of TGF-β/SMAD signaling pathway-specific proteins after rhGDF15 (0–100 ng/mL) treatment of hDPSCs for 30 min were detected by WB and grayscale analysis of protein bands. (h) Expression of total, plasma, and nuclear proteins of p-SMAD2 and p-SMAD3 in hDPSCs after stimulation with rhGDF15 (20 ng/mL) for 30 min, and grayscale analysis of protein bands. (i) Immunofluorescence co-localization of TGF-β/SMAD signaling proteins in implants in the nude mouse subcutaneous transplantation model. Scale bars: 100 μm. The area of new bone formation is delineated by yellow dashed lines. The white dashed box demarcates the regions selected for high-magnification demonstration of osteogenic areas. Scale bars: 100 μm (enlarged view). Data were displayed as mean ± SD (*p < 0.05, **p < 0.01, ***p < 0.001, ****p < 0.0001).
Next, we detected the expression of critical proteins of the pathway in rhGDF15-stimulated hDPSCs by WB. The results exhibited that GDF15 stimulation increased the expression of TGF-βR2, p-SMAD2/SMAD2, and p-SMAD3/SMAD3 in hDPSCs, particularly when hDPSCs were exposed to 20 ng/mL of rhGDF15 for a duration of 30 min (Figure 6(f) and (g)). Additionally, a significant nuclear translocation of p-SMAD2 and p-SMAD3 was observed in rhGDF15-treated hDPSCs (Figure 6(h)). In the nude mouse subcutaneous transplantation model, immunofluorescence co-localization analysis detected significantly elevated expression of TGF-βR2, p-SMAD2, and p-SMAD3 within the bone formation regions of rhGDF15-treated implants compared to those with untreated hDPSCs (Figure 6(i)). Previous research has revealed that GDF15 also belongs to the BMP subfamily. 18 Accordingly, we investigated the BMP/SMAD signaling pathway and found that the phosphorylation ratio of p-SMAD1/5/9/SMAD1/5/9 exhibited no significant change in expression after rhGDF15 treatment of hDPSCs (Supplemental Figure S3A, B). These findings further confirmed that GDF15 promoted osteogenic lineage differentiation of hDPSCs via the TGF-β/SMAD signaling pathway, rather than through the BMP/SMAD cascade.
Increased osteogenic differentiation of hDPSCs due to GDF15 stimulation was partially reversed by inhibitors of the TGF-β/SMAD signaling
To investigate whether the TGF-β/SMAD signaling pathway plays a regulatory role in GDF15-mediated osteogenic differentiation of hDPSCs, we utilized specific TGF-β/SMAD pathway inhibitors, SB431542 and SIS3. The inhibitor concentrations (SB431542 (10 μM) and SIS3 (3 μM)) were selected based on WB (Figure 7(a)). After pretreatment of hDPSCs with SB431542 or SIS3 for 1 h, rhGDF15 treatment significantly reduced the expression of p-SMAD2/SMAD2 and p-SMAD3/SMAD3 (Figure 7(b) and (c)). Moreover, the results of immunofluorescence staining analysis were consistent with WB analysis (Figure 7(d)). hDPSCs were treated with rhGDF15 to induce osteogenic differentiation, in combination with the TGF-β/SMAD pathway inhibitors SB431542 or SIS3. After 7 days, the upregulation of mRNA levels of osteogenic-specific genes (Alp, Col1a1, Runx2, and Osx) induced by rhGDF15 was reversed by inhibitors treatment (Figure 7(e) and (f)). Furthermore, as evidenced by ALP staining (Figure 7(g)) and ARS staining (Figure 7(h)), treatment with the inhibitors significantly attenuated the osteogenic differentiation of hDPSCs. WB analysis also revealed that the increased expression of osteogenic-specific proteins (COL1A1, RUNX2, OPN, DMP1, and DSPP) in hDPSCs following rhGDF15 stimulation was partially reversed by treatment with the inhibitors (Figure 7(i) and (j)).

Activation of the TGF-β/SMAD signaling pathway by GDF15 is partially reversed by the inhibitors. (a) The concentration of the inhibitor was selected based on the analysis of the protein level ratios of phosphorylated to total SMAD2 or SMAD3. (b and c) The protein expression levels and quantitative analysis of p-SMAD2/SMAD2 and p-SMAD3/SMAD3 were assessed in hDPSCs pretreated with inhibitor for 1 h followed by rhGDF15 stimulation for 30 min. (d) Representative images and quantitative analysis of p-SMAD2 or p-SMAD3 immunofluorescence staining. Scale bars: 100 μm. (e and f) The osteogenic effects of inhibitor-treated hDPSCs were analyzed by qPCR. (g) ALP staining following 7 days of treatment. Scale bars: 250 μm. (h) ARS staining following 21 days of treatment and relative quantitative analysis. Scale bars: 250 μm. (i and j) The osteogenic effects of hDPSCs treated with inhibitors for 7 days were evaluated by WB, and the protein bands were analyzed in gray. Mean ± SD was employed to express all data (*p < 0.05, **p < 0.01, ***p < 0.001, ****p < 0.0001).
In vivo, rhGDF15- or rhGDF15 + TGF-β/SMAD inhibitor-treated hDPSCs combined with HA/β-TCP scaffolds were implanted subcutaneously in nude mice (Figure 8(a)). H&E staining (Figure 8(b)) and Masson’s staining (Figure 8(c)) analyses confirmed abundant osteogenesis in the rhGDF15-treated group, whereas the combined inhibitor and rhGDF15-treated groups displayed a substantial decrease in the formation of bones area. Furthermore, in the combined inhibitor and rhGDF15-treated groups, the levels of osteogenic-specific proteins (OPN, DMP1, and DSPP) were also lower than the rhGDF15-treated group (Figure 8(d)). The study demonstrated that pharmacological inhibition of the TGF-β/SMAD signaling pathway partially reversed rhGDF15-stimulated osteogenic differentiation in hDPSCs.

rhGDF15 promoted bone formation through TGF-β/SMAD signaling in vivo. (a) Schematic diagram illustrating the experimental procedure for subcutaneous bone formation in nude mice. (b and c) Representative photos and quantitative analysis of H&E and Masson staining of the bone formation areas in the implants. Scale bars: 200 μm. The black or green boxes indicates an enlarged area. Scale bars: 100 μm. (d) Typical photos of immunohistochemical staining for OPN, DMP1, and DSPP in the bone-forming region of the implant. Scale bars: 50 μm. The arrow indicates the area of bone formation. The black and green boxes indicate the enlarged areas. Scale bars: 200 μm. Mean ± SD was employed to express all data (****p < 0.0001).
Discussion
Studies have demonstrated the significant potential of hDPSCs in bone regeneration.2,33 Under appropriate growth factors and microenvironmental conditions, hDPSCs undergo osteogenic differentiation, forming mineralized nodules in vitro and generating new bone tissue in vivo.34,35 However, their clinical application faces challenges, including the need to precisely modulate hDPSCs differentiation and functionality, as well as to enhance their proliferation and osteogenic capacity. Our findings demonstrate that GDF15 stimulates osteogenic differentiation of hDPSCs both in vitro and in vivo, a process mediated by the TGF-β/SMAD signaling pathway.
Our study revealed that rhGDF15 enhances the proliferation of hDPSCs. Previous studies have identified the pro-proliferative effects of GDF15 in diverse cell types, including cardiac fibroblasts, 36 senescent chondrocytes, 37 bone marrow stromal cells (BMSCs), 14 and myeloma cells. 13 Our findings confirm that hDPSCs are responsive to GDF15-mediated proliferative regulation, expanding its therapeutic potential in regenerative medicine applications. As reported in the literatures, GDF15 was secreted by cells such as macrophages, 38 BMSCs 39 and periodontal ligament cells.20,40 In this study, we observed that GDF15 is synthesized intracellularly and subsequently secreted extracellularly during the osteogenic differentiation of hDPSCs. Based on these results, we hypothesize that GDF15 may not only enhance hDPSCs proliferation but also play an active role in their osteogenic differentiation through autocrine/paracrine signaling mechanisms.
Next, we investigated the osteogenic differentiation potential of GDF15 in hDPSCs in vitro. Extensive evidence supports the critical role of TGF-β superfamily members in bone formation, regeneration, and repair.41–43 As a TGF-β superfamily ligand, GDF15 has exhibited divergent regulatory effects on osteogenesis in prior studies.14,23 For instance, GDF15 was reported to suppress osteogenic differentiation in BMSCs by downregulating osteogenic markers (e.g., Runx2, Ocn) and inhibiting mineralization capacity. 23 Conversely, other studies demonstrated that GDF15 promotes osteoblastic lineage commitment in BMSCs and pre-osteoblasts under defined culture conditions.14,18 These conflicting observations likely stem from variations in experimental parameters, cellular origins, and methodological approaches. In the present study, through systematic functional analyses, including ALP and ARS staining, calcium deposition assays, qPCR, and WB analysis of osteogenic markers (e.g., RUNX2, ALP, OCN), we provide conclusive evidence that GDF15 robustly enhances the osteogenic differentiation of hDPSCs in vitro.
To comprehensively evaluate the osteogenic potential of GDF15, both ectopic and in situ bone regeneration models were employed. For the subcutaneous transplantation model in nude mice, the HA/β-TCP scaffold was chosen based on its well-documented osteoconductive properties, structural stability, and ability to mimic the mineralized extracellular matrix of bone.44,45 The immunodeficient nature of nude mice further eliminates confounding immune responses, ensuring reliable assessment of hDPSC-mediated osteogenesis in isolation. 46 In our nude mouse subcutaneous transplantation model, the constructs loaded with rhGDF15-activated hDPSCs exhibited robust osteogenic capacity, corroborating previous reports on the rhGDF15-driven osteoblastic lineage commitment of BMSCs in vivo. 14 Meanwhile, GelMA hydrogel is another widely used scaffold for cell loading in in situ bone regeneration.47,48 Our rat calvarial defect model further elucidated the bone-regenerative capacity of GDF15, as evidenced by robust mineralization and mature trabecular bone formation within defects repopulated with GDF15-activated hDPSCs. These findings align with previously emerging evidence that GDF15 markedly enhances bone healing in critical-sized calvarial defects. 21 The complementary use of these models not only validates the robustness of rhGDF15 in stimulating osteogenic differentiation of hDPSCs across diverse microenvironments but also highlights the importance of matching scaffold characteristics to specific clinical scenarios.
GDF15 binds to target cell surface receptors, and then initiates downstream signaling cascade responses. 49 Researchers have established that GFRAL as the sole known endogenous receptor that exhibits a strong affinity for GDF15.50,51 GDF15 regulated energy metabolism and body weight primarily through appetite suppression and its physiological pathways dependent on interactions with GFRAL. 30 However, the researchers only found GFRAL expression in the hindbrain and prostate.15,52 GDF15 may bind to receptors other than GFRAL. 25 Our research found that Gfral mRNA is not expressed in hDPSCs. Therefore, we speculate that the GDF15-mediated promotion of osteogenic differentiation in hDPSCs may involve additional signaling pathways. GDF15 has been reported to influence body weight by interacting with TGF-βR2 in the TGF-β/SMAD signaling pathway to regulate food intake. 53 Pathway enrichment analysis of our proteomic data revealed significant enrichment of the TGF-β/SMAD signaling pathway. The signaling possesses significance for osteogenic differentiation.54,55 For instance, the research found that through this signaling, hyaluronic acid facilitates osteogenic differentiation of human amniotic mesenchymal stem cells (MSCs), 56 and amygdalin facilitated MSC-mediated fracture healing. 57 This study demonstrated that GDF15 bound to TGF-βR2 in hDPSCs, activated the TGF-β/SMAD signaling pathway, and enhanced osteogenic differentiation both in vitro and in vivo. The phosphorylation levels of target proteins in hDPSCs were significantly reduced upon treatment with the TGF-β/SMAD pathway-specific inhibitors, leading to suppressed osteogenic differentiation both in vitro and in vivo. Furthermore, results revealed that the BMP/SMAD1/5/9 signaling pathway remained unactivated following rhGDF15 stimulation of hDPSCs. Collectively, these findings establish that GDF15 promotes osteogenic differentiation of hDPSCs through the TGF-β/SMAD axis rather than the BMP/SMAD1/5/9 cascade.
While this study provides mechanistic insights into GDF15-driven osteogenic differentiation of hDPSCs, certain limitations warrant consideration. As a stress-responsive cytokine, GDF15 exhibits low baseline expression in human tissues under physiological conditions but is markedly upregulated in diverse pathological contexts, including hypoxia, inflammation, tissue injury, and cancer.17,58 Our experimental models focused exclusively on GDF15′s osteoinductive effects in a controlled in vitro environment and ectopic and in situ bone formation models, which may not fully recapitulate the complex interplay between GDF15 and hDPSCs in disease-associated microenvironments. Future studies should investigate how pathologically elevated GDF15 levels influence the lineage commitment and functional plasticity of hDPSCs, particularly in disease-relevant models incorporating inflammatory cytokines or hypoxic stress.
Conclusion
In summary, our findings demonstrate that GDF15 enhances bone regeneration by promoting the osteogenic differentiation of hDPSCs, a process mediated at least partially through activation of the TGF-β/SMAD signaling pathway. These mechanistic insights position GDF15 as a promising candidate growth factor in regenerative medicine, offering a novel therapeutic strategy for bone tissue engineering that leverages the intrinsic differentiation potential of hDPSCs.
Supplemental Material
sj-docx-1-tej-10.1177_20417314251357752 – Supplemental material for GDF15 promotes osteogenic differentiation of human dental pulp stem cells by activating the TGF-β/SMAD signaling pathway
Supplemental material, sj-docx-1-tej-10.1177_20417314251357752 for GDF15 promotes osteogenic differentiation of human dental pulp stem cells by activating the TGF-β/SMAD signaling pathway by Pingmeng Deng, Bin Yang, Chuling Huang, Yuejia Li, Ziyi Mei, Yong Li and Jie Li in Journal of Tissue Engineering
Footnotes
Ethical considerations
All human teeth sample collection experiments and animal experiments were approved by the Research Ethics Committee of the Affiliated Hospital of Stomatology, Chongqing Medical University (CQHS-REC-2021 (LSNo. 040) and CQHS-REC-2023 (LSNo.087)). The study was performed in accordance with the Declaration of Helsinki and the ARRIVE guidelines.
Consent to participate
Written consent was secured from all participants.
Author contributions
PD designed the study, performed most of the experiments, analyzed the data and wrote the manuscript. BY assisted in the rat calvarial defect experiments and data analysis. CH performed proteomics sample preparation and data analysis. YL and ZM participated in the cell experiments and related data analysis. YL supervised the experimental methodology and provided intellectual contributions to the experimental design and analysis. JL conceived the project, supervised the experiments, performed the manuscript review and obtained the funding. All authors read and approved the final manuscript.
Funding
The author(s) disclosed receipt of the following financial support for the research, authorship, and/or publication of this article: This research was supported by National Natural Science Foundation of China (Grant No. 82071072), Natural Science Foundation of Chongqing (Grant No. CSTB2022NSCQ-LZX0004), and CQMU Program for Youth Innovation in Future Medicine (Grant No. W0179).
Declaration of conflicting interests
The author(s) declared no potential conflicts of interest with respect to the research, authorship, and/or publication of this article.
Data availability statement
All data are available from the corresponding authors upon reasonable request.
Supplemental material
Supplemental material for this article is available online.
References
Supplementary Material
Please find the following supplemental material available below.
For Open Access articles published under a Creative Commons License, all supplemental material carries the same license as the article it is associated with.
For non-Open Access articles published, all supplemental material carries a non-exclusive license, and permission requests for re-use of supplemental material or any part of supplemental material shall be sent directly to the copyright owner as specified in the copyright notice associated with the article.