
Abstract
The regenerative potential of skeletal stem cells provides an attractive prospect to generate bone tissue needed for musculoskeletal reparation. A central issue remains efficacious, controlled cell differentiation strategies to aid progression of cell therapies to the clinic. The nacre surface from Pinctada maxima shells is known to enhance bone formation. However, to date, there is a paucity of information on the role of the topography of P. maxima surfaces, nacre and prism. To investigate this, nacre and prism topographical features were replicated onto polycaprolactone and skeletal stem cell behaviour on the surfaces studied. Skeletal stem cells on nacre surfaces exhibited an increase in cell area, increase in expression of osteogenic markers ALP (p < 0.05) and OCN (p < 0.01) and increased metabolite intensity (p < 0.05), indicating a role of nacre surface to induce osteogenic differentiation, while on prism surfaces, skeletal stem cells did not show alterations in cell area or osteogenic marker expression and a decrease in metabolite intensity (p < 0.05), demonstrating a distinct role for the prism surface, with the potential to maintain the skeletal stem cell phenotype.
Introduction
Currently in orthopaedic medicine, there is an unmet need for bone tissue to treat fractures and bone degeneration in an increasing ageing population1–3. Skeletal stem cells (SSCs) offer the potential to improve musculoskeletal repair given their capacity to differentiate into bone 4 . However, before SSCs can be used in the clinic, delineation of the developmental pathway and, critically, elucidation of the specific processes in SSC differentiation into osteoblasts are required.
A wealth of data have illustrated the role of topographical surface patterns, including patterns such as grooves, ridges, pits and pillars and their ability to act as cues to direct differentiation of stem cells5–8. The mechanism by which this occurs is yet to be fully understood. However, it is thought that integrins and cytoskeletal components together with intracellular signalling mechanisms play an important role 9 . In particular, integrin organisation and arrangement is of importance in transducing signal pathways to direct cell differentiation and function for enhancement of osteogenic differentiation 10 . Seminal studies over a decade ago have demonstrated that a regular nanotopographical arrangement with slight offset can increase focal adhesion formation and modulate osteogenic differentiation 9 . Interestingly, the majority of topographical designs studied to date have been machine generated. Application and lessons from nature in the use of a biomimetic approach could provide additional advantages over existing topographical designed approaches and bring unexplored surface patterns for which design may not readily replicate.
Background
The surface of the Pinctada maxima oyster shell, on initial observation, appears distinct from bone tissue and yet there are important similarities 11 . Nacre, the substance lining the inside of P. maxima and other bivalve mollusc shells, and bone are both composed of an inorganic, mineralised matrix and an organic fraction composed of proteins. The organic fraction provides a scaffold and biological signals which promote crystallisation. This allows for a substance which is strong and yet displays considerable flexibility. In bone, 70% of dry weight is composed of inorganic mineralised calcium phosphate in the form of hydroxyapatite 12 . Nacre, however, has a much greater proportion of inorganic mineralised matrix (97% of dry weight), which is mainly in the form of the calcium carbonate mineral, aragonite 13 .
The potential for nacre and bone interactions was first noticed in 1931 when ancient Mayan skulls were discovered with dental implants composed of nacre 11 . This demonstrated the biocompatibility of nacre with bone. This phenomenon was studied further by Lopez and colleagues14,15 many decades later in 1991, who showed that not only could human osteoblasts grow on nacre but, after prolonged culture, they also produced a mineralised tissue matrix between osteoblasts and nacre chips. Histological analysis of the composition of this tissue found that the tissue adjacent to the bone chips contained a hydroxyapatite-rich mineralised matrix. Interestingly, the mineralised tissue formed next to the nacre chips was composed of lamellar sheets which closely resembled those of nacreous shell. Raman spectroscopy allowed for confirmation of aragonite crystals present in the matrix 14 . Bone regeneration initiated by nacre was proven in experiments in ovine bone defects, rabbit defects and human maxillofacial defects, illustrating the powerful role of nacre in bone regeneration16–19.
As nacre appeared to enhance bone regeneration in published in vivo studies, it could be hypothesised that nacre has the ability to drive SSC osteogenesis, leading to enhancement of bone regeneration. To date, only a limited number of studies have examined the role of nacre in directing osteogenesis from SSC populations. SSC population specifically refers to a self-renewing stem cell that resides in postnatal bone marrow stroma with the capacity to differentiate into cartilage, bone, haematopoiesis-supportive stroma and marrow adipocytes and, critically, responsible for the regenerative capacity inherent to bone. Bone marrow stromal cells (BMSCs) commonly refer to the heterogeneous population of cultured plastic adherent cells isolated from the bone marrow. The SSC, present within bone marrow stroma, is responsible for the regenerative capacity inherent to bone. The SSC population is a separate population to the typically stated mesenchymal stem cell (MSC). The term MSC was originally coined in reference to a hypothetical common progenitor of a wide range of ‘mesenchymal’ (non-hematopoietic, non-epithelial, mesodermal) tissues and it is widely accepted that MSCs exist in a broad range of postnatal tissues and organs, with a broad spectrum of lineage potentialities.
Nacre matrix was found to lead to an increase in expression of alkaline phosphatase (ALP) in rat BMSC 20 . Further to this, bone marrow–derived human SSCs cultured with nacre chips displayed an increase in ALP activity, indicating osteogenic differentiation 21 . Thus, it could be hypothesised that the nacre shell may provide SSCs with an ideal topography for SSC differentiation or/and provide a chemical environment to enhance differentiation. A previous study aimed to separate the topography from the chemistry by replicating nacre topographical features into polycaprolactone (PCL) and studied the behaviour of commercially available MSCs on the PCL replicas 22 . The authors studied the crystallinity of the mineralised matrix formed when MSCs were cultured on the PCL nacre replicas. The results detail that MSCs produced a mineralised matrix with higher crystallinity than chemically induced osteogenic differentiation, indicating a different pathway of differentiation 22 .
In this study, a similar approach of using PCL replicas is taken to study the topographical effects of the nacre region of P. maxima, as well as the topography of the calcite prisms which form the outer layer of P. maxima shells (Figure 1). In addition, the current studies have used PCL replicas to examine the role of the topography from the prism region of P. maxima, which is also composed of calcium carbonate crystals and forms in the region where the two sections of the shell join together. Interestingly, the role of the topography from this part of the shell is less well-understood and this study has examined the role of this material and the topography of this material in modulation of SSC behaviour. The cell source used in the current studies was human primary bone marrow–derived SSCs from an aged population, clinically relevant for studying bone regeneration therapies. The effect of nacre and prism topography has not been studied on this SSC population and will inform translational and bone formation in human bone populations.

Schematic representation of biofabrication of PCL topographical surfaces. (1) Polydimethylsiloxane (PDMS) was poured on shell and heat cured at 60°C for 60 min. The mould was then removed from the shell. (2) Polycaprolactone (PCL) beads were washed in methanol and left to air dry. PCL beads were then melted at 80°C and PDMS mould transferred to molten PCL and features replicated using hot embossing. At this point, flat control PCL surfaces were generated using glass slides. When the PCL had cooled, the PDMS stamp was removed. (3) PCL topographical surfaces were prepared for cell culture with plasma treatment. (4) SEM images of PCL-replicated nacre and prism topographies. To prepare for SEM, surfaces were sputter coated with 7 nm platinum.
Aim
To date, the osteogenic effect of a solid two-dimensional (2D) nacre and prism surface on primary SSC behaviour and function remains unknown and this study sets out to delineate and examine this further. In order to distinguish the chemistry of nacre and prism substrate from topography, a soft lithography approach was used to develop cell culture surfaces with nacre and prism topographical features but without the surface chemistry of nacre or prism shell regions. As the P. maxima shell nacre topography is known to enhance osteogenic differentiation, potential for direction towards osteogenesis will be studied through observations of alterations in cell morphology, gene expression markers and metabolomics following SSC culture on the topographical surfaces. The topography of these bioimprinted surfaces could provide mechanical and topographical cues to alter SSC behaviour, potentially towards an osteogenic fate.
Methods
Surface generation
PCL prism and nacre topographical surfaces were fabricated as outlined in Figure 1 and the fabrication process detailed in Alakpa et al. 22 Prior to culturing, surfaces were sterilised under ultraviolet light for 30 min and washed twice with sterile phosphate-buffered saline (PBS).
SSC isolation
A total of four patient samples were used for this study (samples from females aged 51, 52, 56 and 71). Bone marrow from the four patients was utilised for isolation and culture of bone marrow SSCs. SSC isolation has been described previously.23,24 Bone marrow was first washed and the solution was passed through a 70-μm cell strainer and subjected to density centrifugation using Lymphoprep™ (Lonza, Slough, UK). The buffy coat layer, containing bone marrow mononuclear cells, was incubated with blocking buffer (α-MEM (Lonza), 10% human serum (Sigma, Gillingham, UK), 5% foetal bovine serum (FBS) (Thermo Fisher Scientific, Basingstoke, UK) and 10 mg/mL bovine serum albumin (BSA) (Sigma)) followed by washing with magnetic-activated cell sorting (MACS) buffer (PBS with 0.5% BSA and 2 mM ethylenediaminetetraacetic acid (EDTA; Sigma)). Cell suspension was incubated with 1 mL STRO-1 antibody (generated in-house from hybridoma). Following washing with MACS buffer, cells were incubated in rat anti-mouse IgM microbeads (Miltenyi Biotec Ltd, Woking, UK). After further washing with MACS buffer, target cell population was isolated by MACS and resuspended in basal media (α-MEM containing 10% FBS and 1% penicillin/streptomycin; Lonza) and plated into tissue culture flasks.
Cell culture
STRO-1+–enriched SSCs were maintained at 5% CO2 at 37°C in culture flasks and used at passage 1. Cell culture media used was basal culture media unless otherwise stated. Osteogenic media was basal media supplemented with 10 nM vitamin D3 (Sigma) and 100 μM ascorbic acid (Sigma). Prior to seeding, cells were treated with collagenase IV (Sigma) and released from the flask using 1× trypsin (Lonza). STRO-1+ SSC were seeded into 24-well plates at 1000 cells/cm2. After 24 h of seeding, surfaces were transferred to new 24-well plate and media replaced. Media was subsequently changed every 3–4 days for the duration of the experiments.
Scanning electron microscopy
Surfaces were washed in sterile water and left to air dry. Surfaces were then sputter coated with 7 nm platinum using Q150T turbo-pumped sputter coater/carbon coater (Quorum Technologies Ltd, East Sussex, UK). In order to ensure charge distribution, Electrodag 1415 (AGG3648, Agar scientific, Essex, UK) was painted from the edge of surfaces to metal mounting stub. Samples were viewed using Quanta FEG 250 scanning electron microscope (SEM; FEI™, Eindhoven, The Netherlands). The SEM was controlled by xT microscope control software, which also allowed for image capturing.
CellTracker Green imaging
To visualise cells, 50 μg of CellTracker Green (CTG; Thermo Fisher) was dissolved in 10-μL sterile dimethyl sulfoxide. This was pipetted into a falcon tube containing 15 mL of α-MEM. Media was removed from wells, washed once with PBS and CTG/α-MEM mix was added to the well. Cells were then incubated in the dark at 37°C for 1 h. Cells were washed with PBS and the media replaced with basal media. Cells were imaged at the required time point. Sample images were captured using a Zeiss Axiovert 200 inverted microscope (Zeiss, Cambridge, UK) and Zeiss Axiovision software version 4.9. Fluorescent images were captured using Axiocam MR with the FITC filter.
Analysis of cell spreading
To quantify cell area in an unbiased fashion, CTG images were processed using image analysis software CellProfiler 2.2.0.25,26 The image process pipeline is detailed in Table S1. For image analysis, a minimum of eight images per condition were used, and a minimum of 60 cells were used to generate average cell area. Each image was checked individually to ensure that CellProfiler recognised cell correctly and incorrect recognition was removed from analysis (Figure S1).
Quantitative reverse transcriptase-polymerase chain reaction
Prior to lysis, cells were washed twice with PBS. Lysis buffer buffer RLT (Qiagen, Manchester, UK) supplemented with 0.05% Reagent DX (Qiagen) was added to each well and cells lysed using pipette tip. RNA was extracted using AllPrep DNA/RNA/miRNA universal kit (Qiagen), following manufacturers’ protocol. Equal amounts of RNA were used for complementary DNA (cDNA) synthesis using Taqman Reverse Transcription Reagents (Thermo Fisher Scientific) according to the manufacturers’ protocol. Amplification by quantitative reverse transcriptase-polymerase chain reaction (qRT-PCR) was performed using human-specific primers (Sigma). Each 20-μL reaction contained 1 μL of diluted cDNA, 10 μL of GoTaq (Promega, Southampton, UK) and a final concentration of 1 μM forward and reverse primers. For the qRT-PCR run, Applied Biosystems (Thermo Fisher Scientific) Real-Time PCR system was set up to run first with two holding stages (2 min at 50°C, 10 min 95°C), followed by 40 cycles (15 s at 95°C, 1 min at 60°C) where fluorescence was measured and held at 4°C. Data were analysed using 7500 Software version 2.3 (Life Technologies, Basingstoke, UK). Threshold for calculating Ct (cycle threshold) value was set at 0.2 and all samples normalised to expression of ACTB as a housekeeping gene. The 2−ΔΔCt method was used for relative quantification of gene expression. 27
Immunofluorescent microscopy
Prior to staining, surfaces were washed twice with PBS and fixed in 4% paraformaldehyde (PFA; Sigma) for 30 min. Cells were blocked and permeabilised with blocking buffer composed of PBS, 0.3% Triton X-100 (Sigma-Aldrich) and 5% goat serum (Thermo Fisher Scientific) for 60 min at room temperature. Anti-osteopontin antibody (1:100 dilution; Abcam, UK) was added and incubated overnight at 4°C. After incubation, the surfaces were washed three times with PBS supplemented with 0.05% Tween 20 (Sigma-Aldrich). Following this, secondary antibody (goat anti-mouse; Abcam, Cambridge, UK) and TRITC-conjugated phalloidin (diluted at 1:500; Merck-Millipore, Watford, UK) were incubated with the cells for 1 h. Following this, cells were then incubated with DAPI (dilution 1:100 in PBS; Thermo Fisher Scientific) for 10 min. Cells were then washed three times with PBS/Tween. For storage before imaging, surfaces were mounted with fluoromount™ (Sigma-Aldrich) and sealed with clear nail varnish. Surfaces were stored in the fridge, in the dark and imaged within 1 day. Cells were imaged as with imaging following CTG staining.
Cellular metabolomics
Female patient 56 was used for cellular metabolomics experiments. Metabolites were extracted on days 10 and 21 after seeding. Surfaces were washed twice with chilled PBS. Chilled extraction buffer (chloroform:methanol:water, 1:3:1 (v/v)) was added to surfaces and agitated with shaking at 4°C. Samples were transferred to screw cap vials and centrifuged to pellet cell debris. Supernatant was then transferred to screw cap vials. A liquid chromatography–mass spectrometry (LC-MS) system was used for cellular metabolomics. Metabolomic analysis was performed at Glasgow Polyomics Centre (University of Glasgow) with 10 μL aliquot of supernatant. Hydrophilic interaction liquid chromatography (HILIC) was carried out on UltiMate 3000 RSLC system (Thermo Fisher Scientific) using ZIC-pHILIC 5 μm column (150 mm × 4.6 mm). The mobile phase was composed of 20 mM ammonium carbonate in either water or acetonitrile. A linear gradient was run for 24 min at 20% in water/80% acetonitrile, followed by change to 92%water/8% in acetronitrile for 8 min, before being brought down to 20% water/80% acetonitrile. Orbitrap QExactive (Thermo Fisher Scientific) was used for MS analysis in polarity switching mode, within the mass range m/z 70–1050. Metabolite identification used Glasgow Polyomics Centre in-house XCMS/MzMatch/IDEOM pipeline using a set of standards to define mass and chromatographic retention times. 28 Peak intensities were normalised to protein concentration using BSA assay (Thermo Fisher Scientific). Ratios for each metabolite were calculated using peak intensity, relative to flat control surfaces and these ratios were used for statistical analysis.
Statistical analysis
Cell area measurements were performed with patients 51, 52 and 56 and data represented as mean ± SD. Gene expression experiments were performed with patients 51, 52, 56 and 71 and data represented as mean ± SEM. Two-way analysis of variance (ANOVA) followed by Tukey’s post hoc was performed on results of cell area measurements and gene expression analysis. Patient female 56 was used for metabolomics experiments and performed in triplicates, with data represented as mean ± SD. One-way ANOVA followed by Dunnett’s post hoc was performed on metabolite intensity peak ratios. Principal component analysis (PCA) was carried out using MetaboAnalyst 4.0. 29 The p values less than 0.05 were considered significant.
Results
Morphological changes on shell topographies
STRO-1–enriched SSCs were cultured on nacre and prism replicated PCL topographies and control flat surfaces, cultured under basal conditions and the cell area measured at days 4 and 7, to ensure that cell density remained sufficiently low to allow for accurate single-cell measurements. As these PCL surfaces are opaque, cells were stained with CTG and imaged using fluorescence imaging (Figure 2(a)–(f)). On day 4, there were negligible differences in cell area between nacre, prism and control flat topography (Figure 2(g)). On day 7, as expected, there was a higher density of cells on the surfaces as the SSCs proliferate and an overall decrease in cell area was observed. From day 4 to day 7, average cell area decreased from 3250.9 ± 617.32 μm2 to 2195.0 ± 359.0 μm2 (p < 0.001). On day 7, an increase in cell area on nacre surfaces (2472.2 ± 447.8 μm2), compared to flat (2097.0 ± 220.1 μm2) and prism (2015.9 ± 298.0 μm2), was observed. However, due to patient variation between SSC samples, this did not reach statistical significance.

Morphology of SSCs cultured on nacre, prism and flat topographical surfaces. Cells were stained with CellTracker Green and imaged at (a–c) day 4 and (d–f) day 7. Mean cell area (μm2) was calculated at day 4 and day 7 (g), (n = 3 patients – females aged 51, 52 and 56), *p < 0.05; **p < 0.01.
Enhancement of osteogenic markers on shell topographies
To investigate osteogenic differentiation on the PCL topographies, expression of a range of early to late osteogenic markers was examined over 28 days of culture and compared to SSC cultured on flat PCL surfaces under osteogenic conditions (flat OM) (Figure 3(a)–(e)). A 28-day culture was chosen as osteogenic differentiation can take up to 28 days to reach full maturation and full examination of any potential osteogenic differentiation. RUNX2 expression did not vary between the topographical surfaces and flat control surfaces. A decrease in expression in RUNX2 was identified on nacre topographies on day 28 (Figure 3(a)). It was apparent that expression of RUNX2 was considerably higher in SSC cultured under osteogenic conditions. ALP expression on nacre topographies reached a maximum on day 14 (p < 0.01) (Figure 3(b)). This was observed to be nacre topography-specific and a similar result was not observed on prism topographies. Differences in expression between topographical surfaces at recorded time points were not observed for COL1A1 expression. Interestingly, expression of COL1A1 was found to be lower in the presence of OM compared to flat surfaces in the absence of OM.
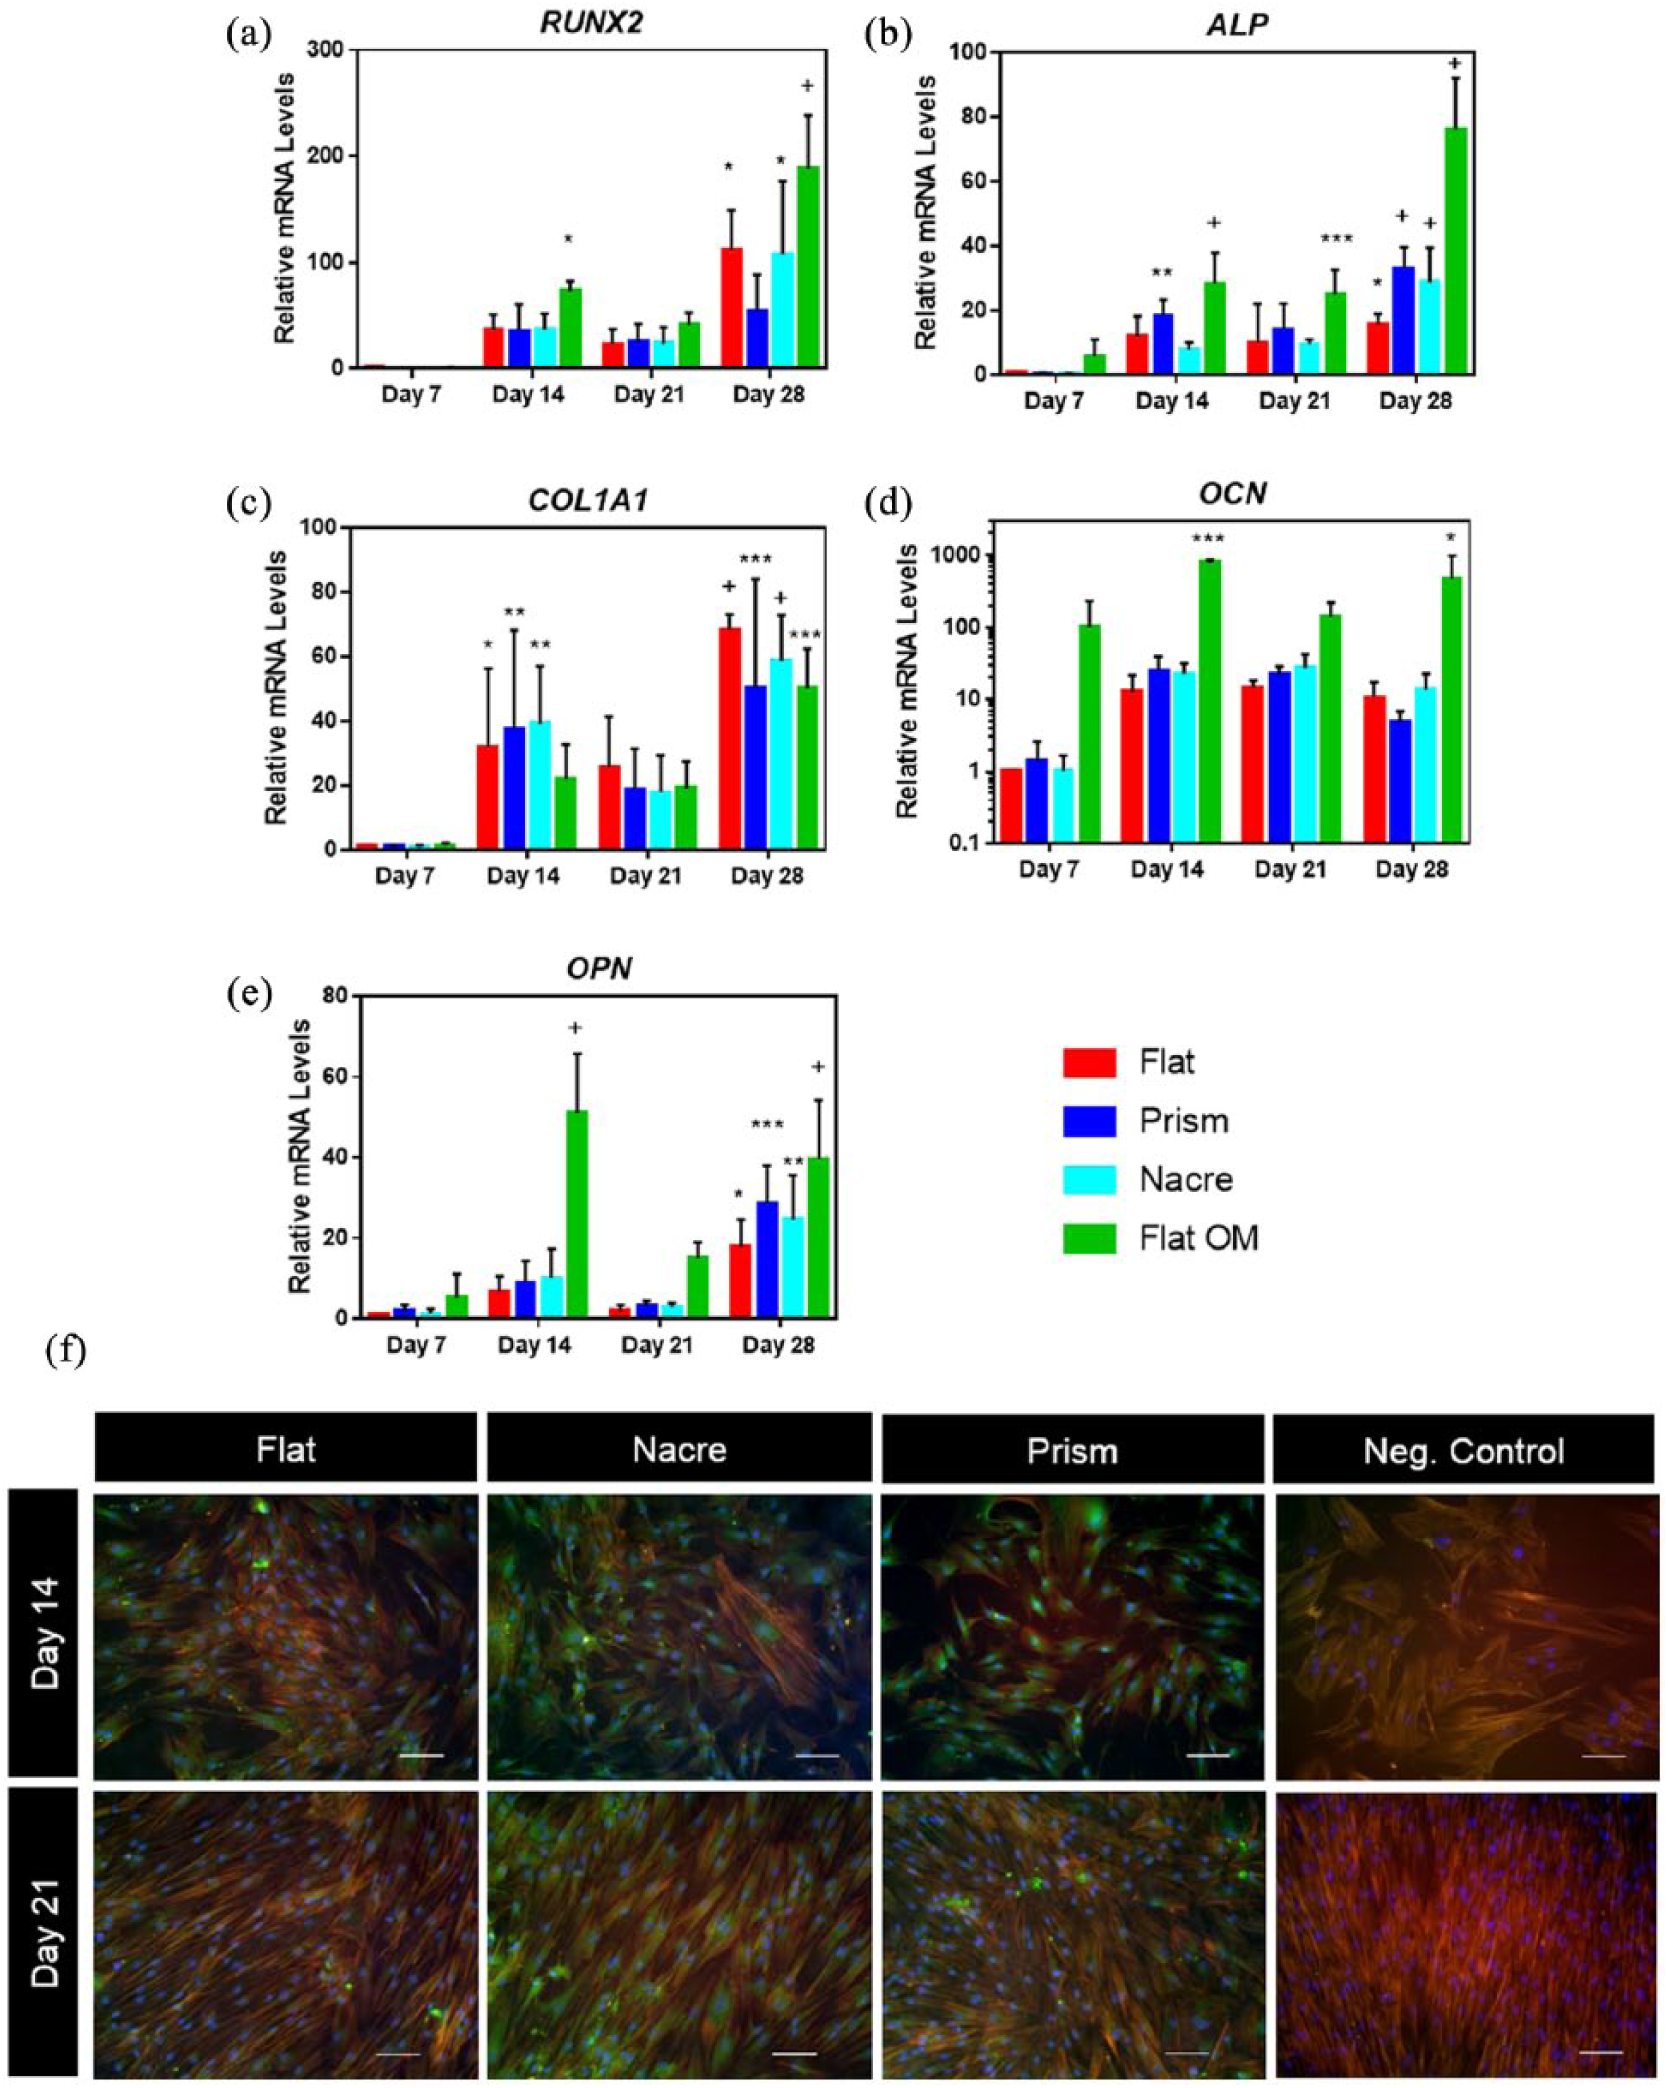
Changes in osteogenic mRNA and protein on shell topographies. (a–e) Expression of RUNX2, ALP, COL1A1, OCN and OPN mRNA in SSC cultured on nacre, prism and flat osteogenic media (flat OM) topographies over 28 days. n = 3 patient samples, *p < 0.05; **p < 0.01; ***p < 0.001; +p < 0.0001. (f) Immunofluorescence of OPN on days 14 and 21 on flat, nacre and prism topographies. Negative control is SSCs stained in the absence of anti-OPN antibody, cultured on standard commercial tissue culture plastic. White arrows indicate area of OPN protein. Scale bar = 100 μm.
On day 21, there was an increase in expression of OCN on SSCs cultured on both nacre (27.1 ± 15.2) and prism (21.8 ± 7.1) PCL topographies compared to the flat control (14.7 ± 3.7). On day 14, an increase in OPN expression was observed in nacre topographies (10.1 ± 7.4) compared to both prism (8.9 ± 5.4) and flat control (6.7 ± 3.7). It should be noted that there was a significant variation in expression from different SSC patient donors. Further to this, there was also significantly higher expression of osteogenic markers when flat PCL surfaces were cultured in the presence of OM. Immunofluorescence staining of OPN confirmed gene expression data, indicating an increase in OPN levels on days 14 and 21 comparing nacre topographies to flat control (Figure 3(f)). Expression of miRNAs, known to be associated with osteogenesis, miR-138 and miR-218, showed no significant difference between flat and shell topographies (Figure S2).
Cellular metabolomic profile of SSCs on shell topographies
To determine how metabolic pathways within SSC populations responded to the nacre and prism topographies, we performed metabolomics analysis using LC-MS on SSCs cultured on the shell topographies. For this experiment, days 10 and 21 were chosen as during initial pilot studies, these time points displayed increased SSC metabolomic activity and therefore would reflect activity of metabolically active SSCs. We selected a 10-day time point for metabolomics to ensure that cell density was sufficiently low enough to avoid/minimise any cell interactions and ensure analysis was solely a reflection of the effect of the topography in the differentiation process of SSCs.
An overview of average metabolite intensity at day 10 detailed an increase in intensity on nacre topographies (p < 0.05) and a decrease in intensity on prism topographies (p = 0.0455) relative to flat control (Figure 4(a)–(c)). Interestingly, the metabolite intensity ratio was similar from nacre topography (2.32 ± 0.30) to flat control exposed to osteogenic media (flat OM) (2.35 ± 0.26) (Figure 4(a)) and this was also observed on a heat map displaying individual metabolites (Figure 4(h)). When this was analysed by carbohydrate- and lipid-associated metabolites, the similarity between nacre topography and flat OM remained (Figure 4(b) and (c)). At day 21, usually associated with differentiation towards a mature osteogenic phenotype, the metabolite intensity was altered in comparison with the day 10 (Figure 4(d)–(f)). Metabolite intensity on flat control and flat OM was observed to be similar (1.02 ± 0.28 and 1.16 ± 0.31, respectively). Critically, an increase in metabolite intensity was only observed on nacre topographies (1.54 ± 0.6) (Figure 4(d)). This is reflected in the heat map of metabolites identified on day 10 (Figure S3) and day 21 (Figure S4). The heat map also showed differences between the triplicates. SSCs on prism surfaces appeared to be more metabolically active at this time point compared to day 10 (Figure 4(d)), as the intensity compared to flat control increased from 0.58 ± 0.1 to 1.07 ± 0.1. PCA plots show linkage between flat OM and nacre and flat and prism surfaces on day 10 (Figure 4(g)). However, this was lost by day 21 (Figure 4(h)). Individual metabolites
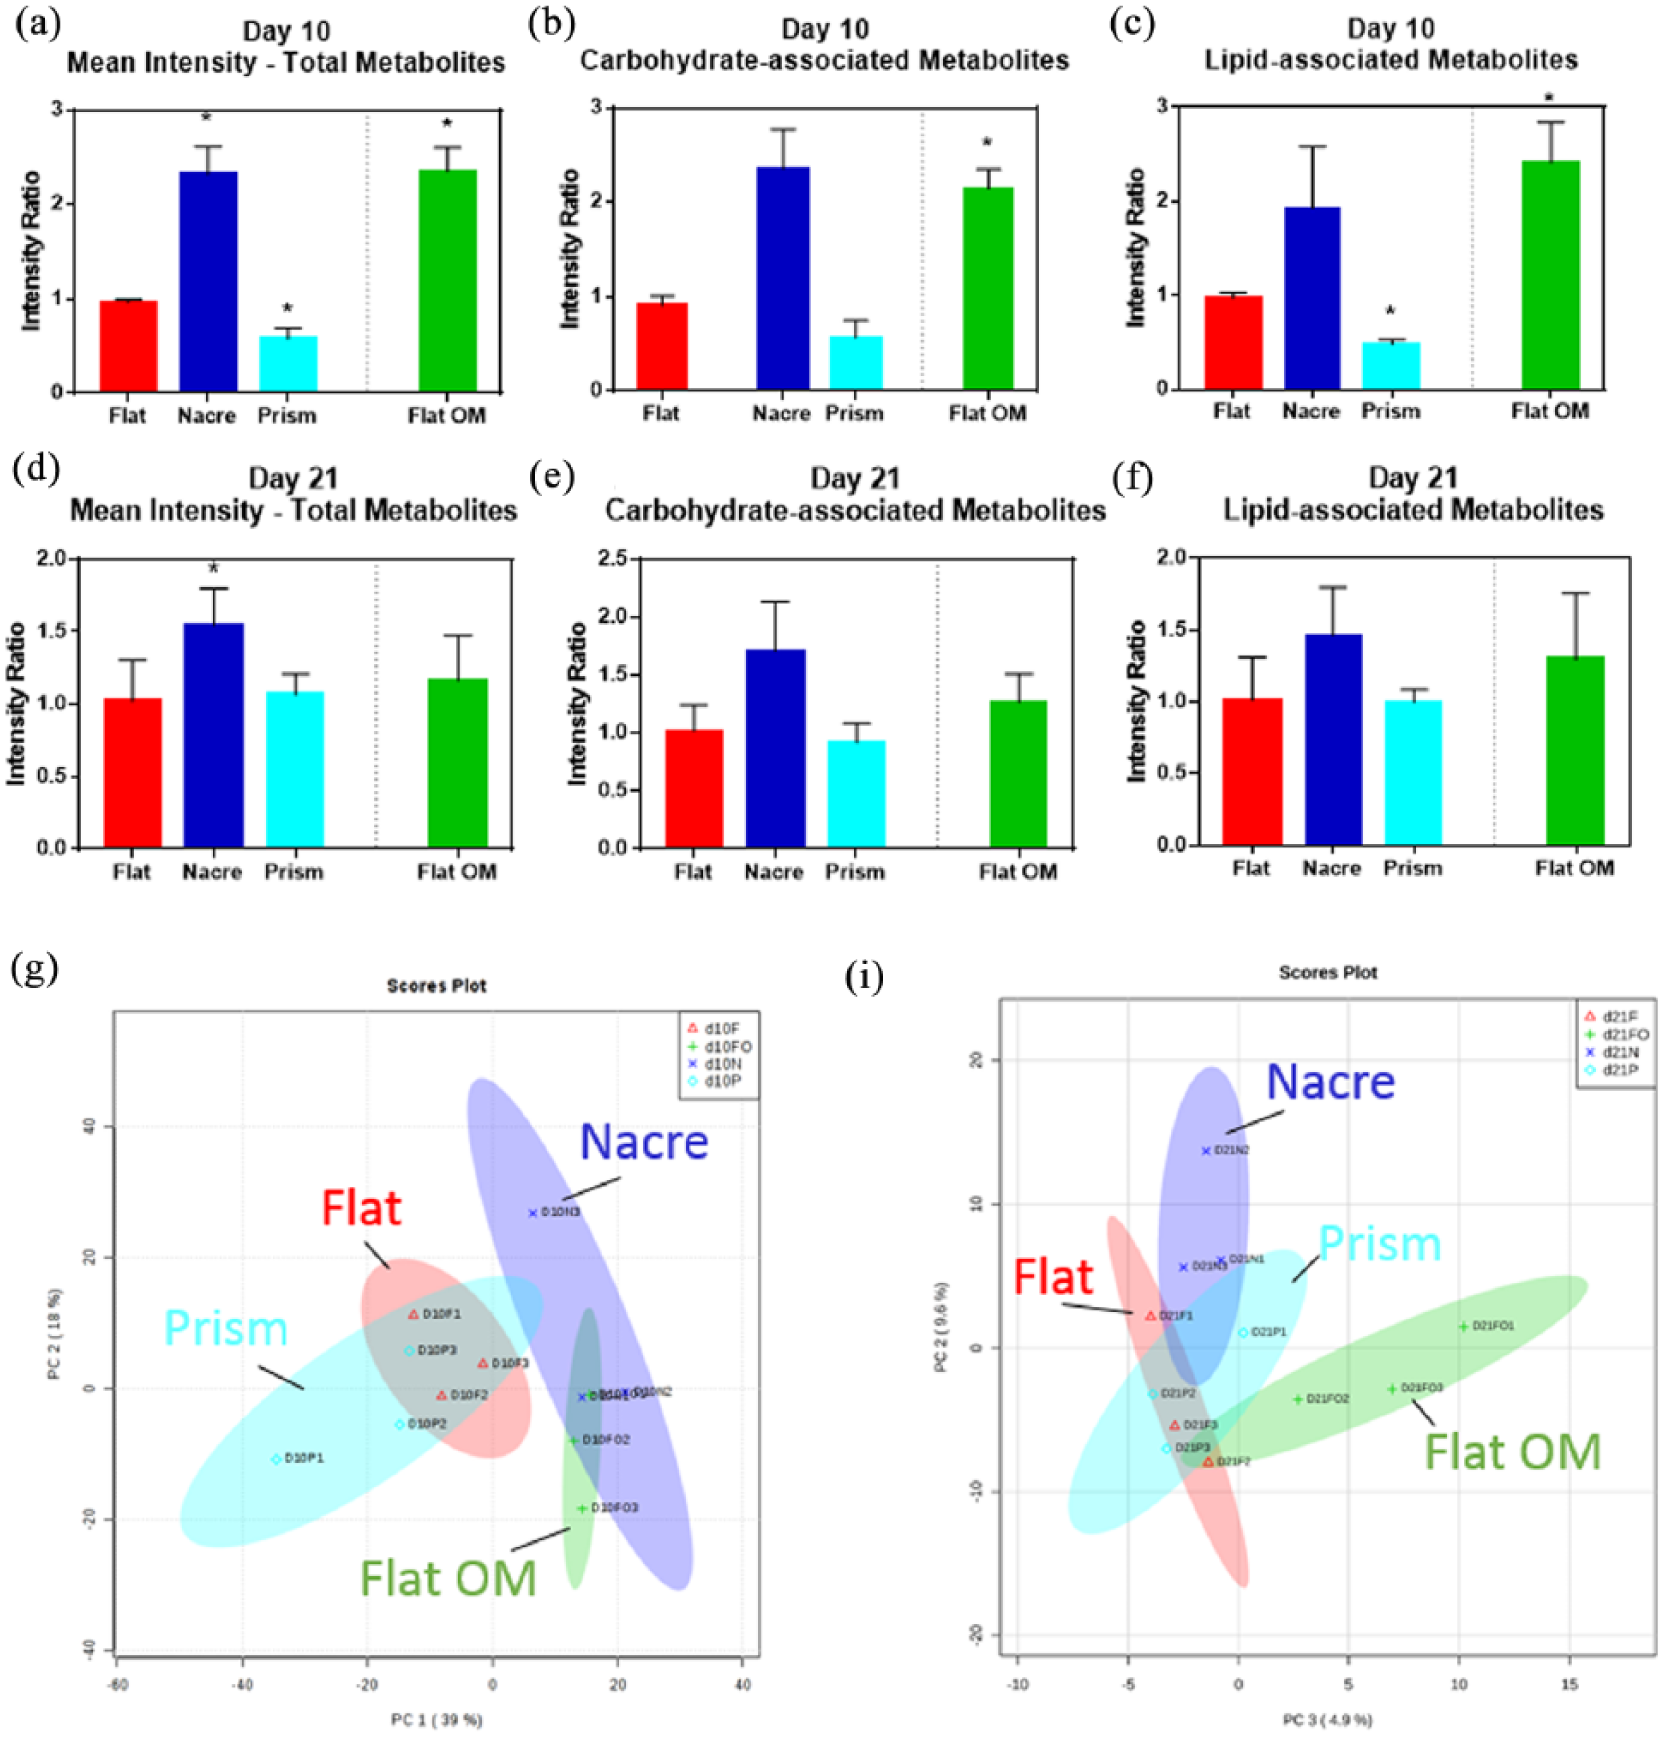
Metabolomic analysis of SSC culture on nacre and prism shell topographies. Intensity ratio, relative to flat control, of (a and d) total metabolites, (b and e) carbohydrate-associated metabolites, and (c and f) lipid-associated metabolites for (a–c) day 10 and (d–f) day 21. Flat OM represents flat surface cultured in osteogenic media. Peak intensity ratio normalised to flat control, n = 3 replicates. PCA plots for (g) day 10 and (h) day 21.
Identified networks and canonical pathways associated with changes in metabolites
Through the use of Ingenuity Pathway Analysis (IPA) software (Qiagen), canonical pathways associated with nucleotide metabolism were analysed (Figure 5). IPA investigates all known metabolites associated with these pathways and if they are up on nacre and prism topographies or flat OM. The majority of metabolites identified were upregulated on nacre topographies and flat OM on day 10 (Figure 5(a) and (c)). On prism topographies, metabolites associated with nucleotide metabolism were downregulated (Figure 5(b)). As identified on analysing peak intensity, on day 21, an increase in metabolite intensity on nacre topographies was observed compared to metabolites on flat OM surfaces (Figure 5(d) and (f)).
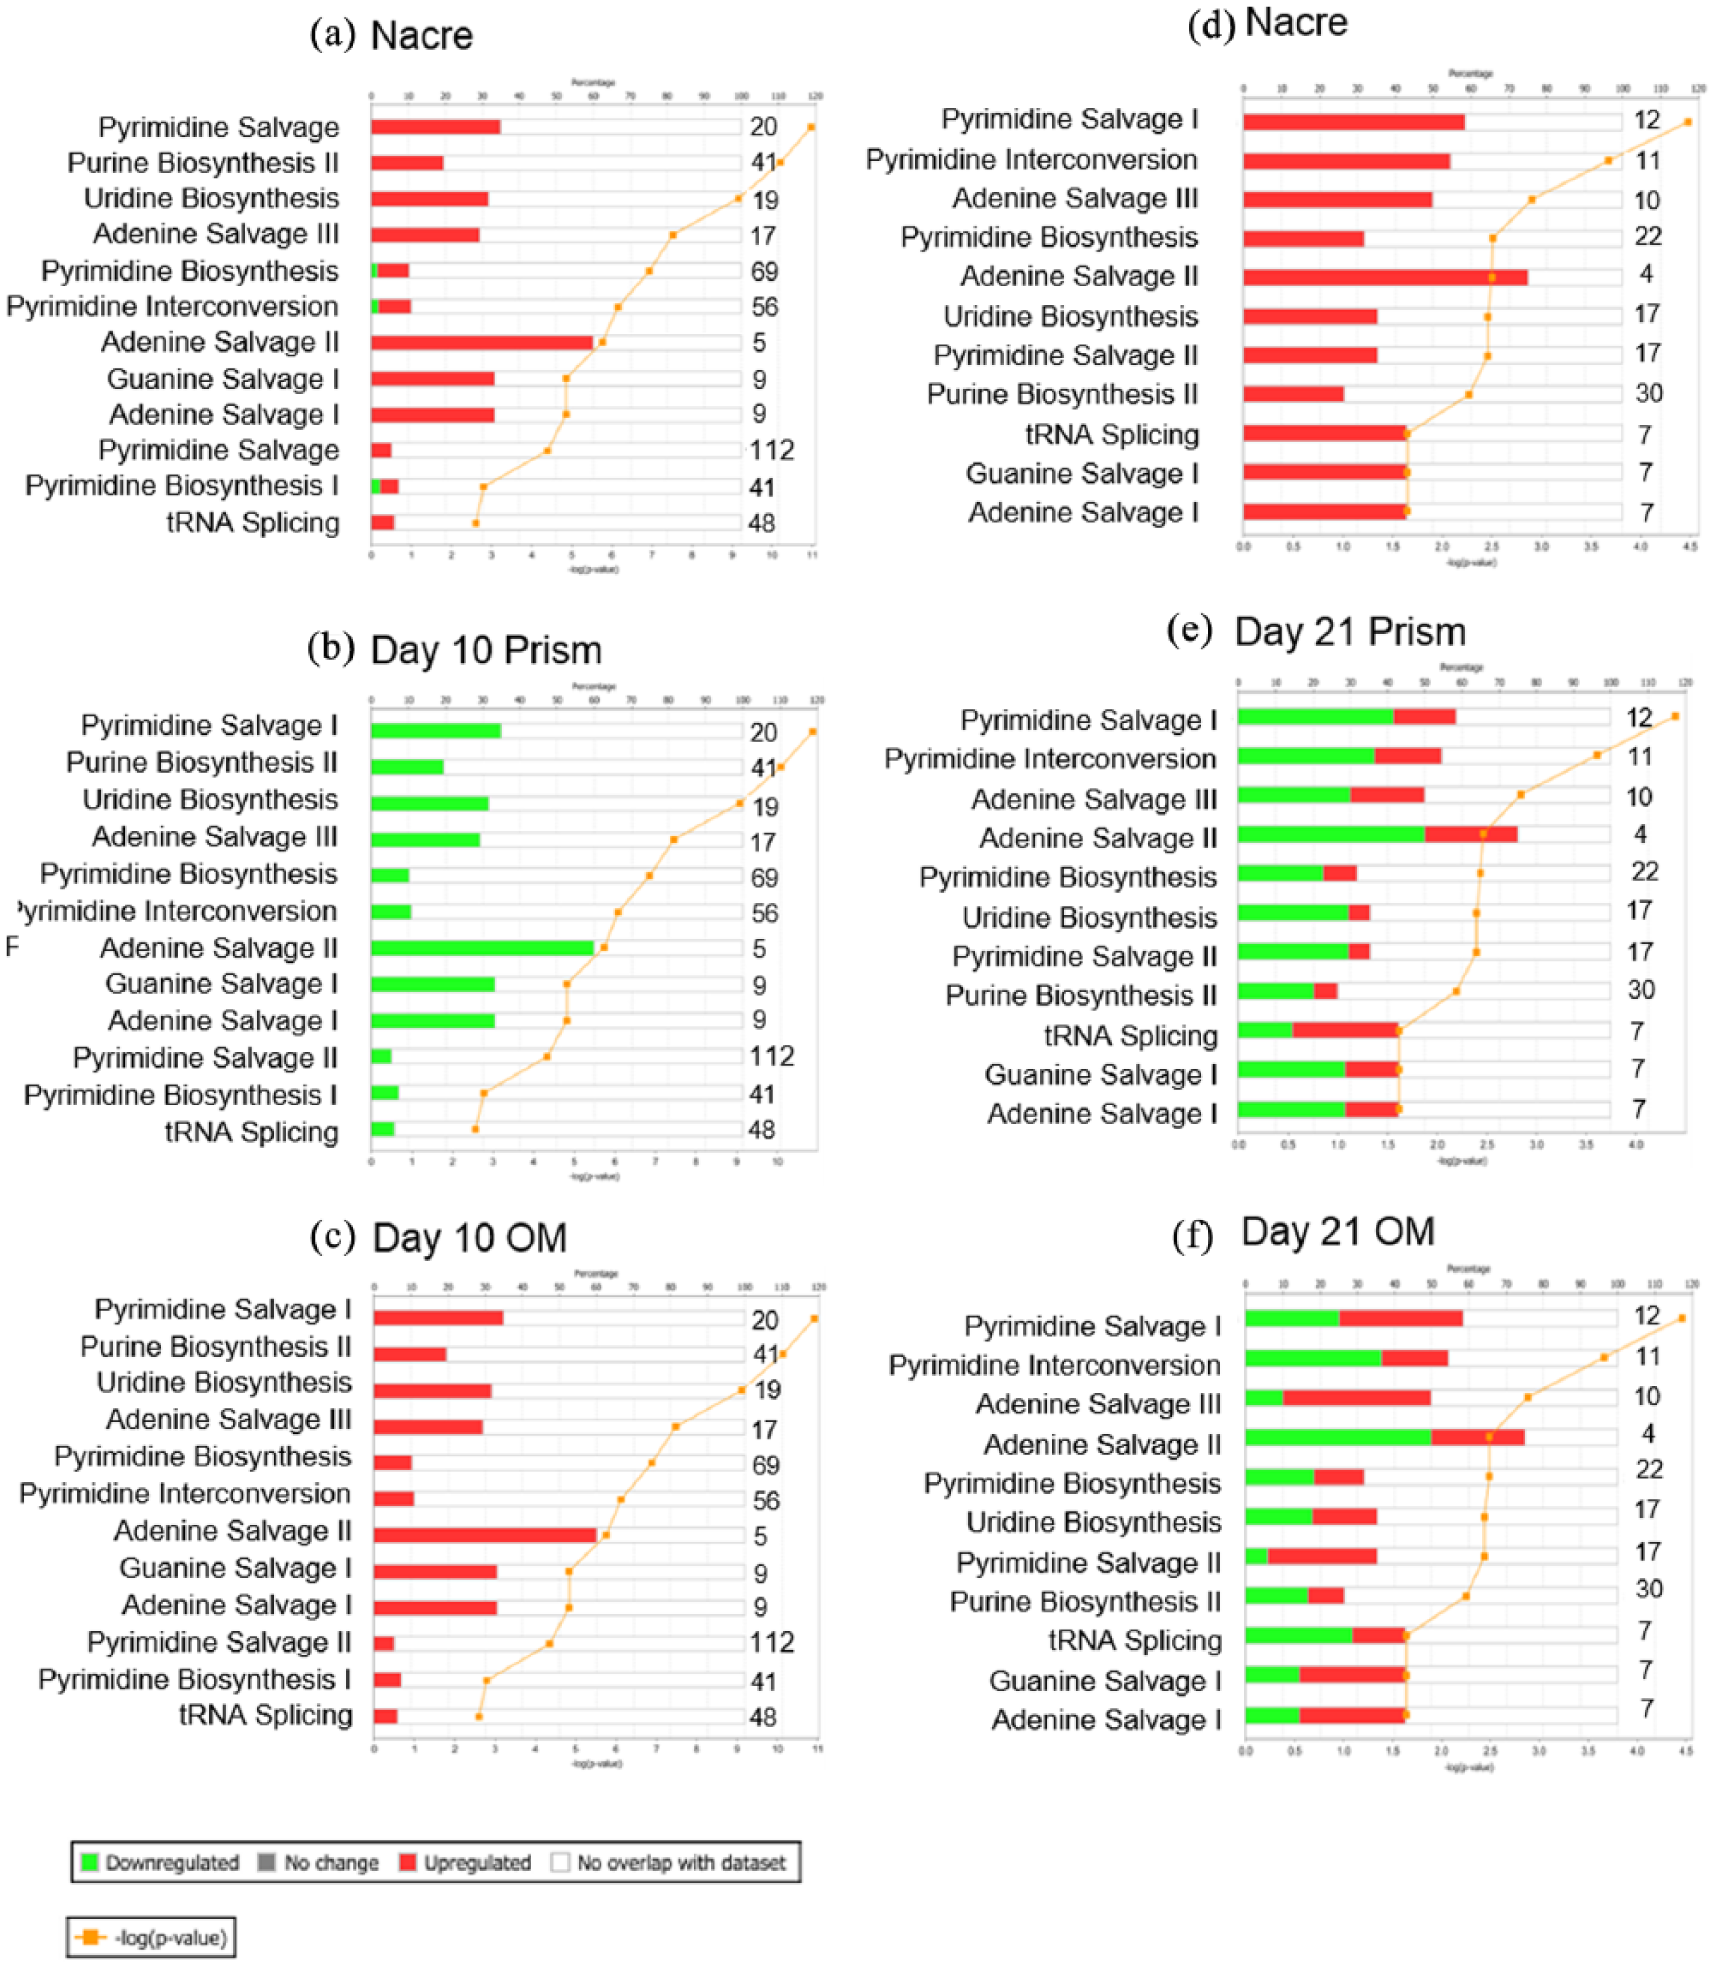
Nucleotide metabolism–associated canonical pathways for SSCs cultured on nacre, prism and control OM surfaces on days 10 and 21. IPA-generated canonical pathways associated with nucleotide metabolism for SSC on day 10 on (a) nacre topographies, (b) prism topographies and (c) flat osteogenic media control. Canonical pathways on day 21 on (d) nacre topographies, (e) prism topographies and (f) flat osteogenic media control. Shown in either red or green and on the numbers to the right of each bar was the number of metabolites identified in the sample out of all possible known associated metabolites. Threshold considered for the analysis was – log(p value) > 1.5. Legend on bottom left.
Application of IPA software (Qiagen) demonstrated networks of associated metabolites generated including links to proteins known to be associated with metabolites from literature databases that predict the protein regulation/activation state. The network generated for nacre PCL topography and flat OM conditions were similar at day 10, indicating potential for a comparable cellular phenotype (Figure S6A and C). At day 21, the metabolomic networks generated for nacre topography showed enhanced activation in comparison with flat OM (Figure S7A and C). At day 10, on both nacre topographies and flat OM, key hubs associated with osteogenic differentiation were identified to be activated including ERK1/2, acetyl coA carboxylase (ACAC) and collagen 1α and increase in metabolites associated with the tricarboxylic acid (TCA) cycle. On prism topography, the opposite was observed and the network generated displayed different activation levels (Figure S6B). Here, at day 10, a predicted decrease in ERK1/2, ACAC and collagen 1α was discovered. Added to this, an activation of lactate dehydrogenase was observed in prism-associated networks. Due to difficulties in generating the high number of samples required for metabolomic analysis, one patient (female aged 56 years) was used for this experiment and examined in triplicates.
Discussion
This study has demonstrated the ability of SSCs to respond to shell topographical surfaces. The nacre surface induced osteogenic differentiation of human SSCs, with an increase in OPN, OCN and ALP expression, compared to flat control PCL surfaces. Furthermore, the similarities in metabolic profile between SSCs on nacre surfaces compared to SSCs cultured in osteogenic media strengthen the potential for the nacre surface to induce osteogenic differentiation. In contrast, primary SSCs cultured on the prism surface presented a distinct and, significantly, a different response. On prism surfaces, a mixed increase in expression of osteogenic markers was observed, with an increase in OCN but not ALP compared to flat control without OM. Through the use of IPA for metabolomics profiling, SSCs cultured on prism surfaces displayed considerably less activity compared to flat control.
Previous studies have suggested that an increase in cell area is observed during osteogenic differentiation 30 . In the current studies, a non-significant increase in cell area was observed on nacre surfaces and demonstrated the ability of SSCs to respond to nacre topographical surface features. Examination of the expression of master bone regulator RUNX2 indicated no effect of topography on gene expression. RUNX2 is known to be expressed early on during osteogenic differentiation and functions to enhance transcription of bone-associated proteins such as ALP, OPN and OCN31–34. Given that an increase in ALP, OPN and OCN was observed, it could be speculated that an increase in RUNX2 expression occurs at a time point not investigated during this study. ALP, OCN and OPN are known to be indicators of osteogenic differentiation35,36. The increase in expression of these markers in the current studies supports the idea of potential osteogenic differentiation on the topographies. When comparing increases of observed expression to expression measured in flat OM surfaces, it is apparent that the expression observed on topographical surfaces is not as high as that identified during culture with OM. From this, we can tell that chemically induced osteogenic differentiation is more powerful than topographical-induced differentiation, though, nonetheless, topography has a moderate effect on gene expression.
When differentiating, SSCs form specialised, terminally differentiated cells and the environment within the cell changes, including the way in which cells process metabolites 37 . The metabolomic profile of SSCs is known to change during differentiation with more energy as a consequence of oxidative phosphorylation pathways in the mitochondria as differentiation progresses37,38 and accompanying this is an increase in energy-related metabolite intensity 39 . In the current studies, this change in metabolite processing was illustrated by the comparison between SSCs on flat control to flat OM where we observed an increase in metabolite intensity and increase in oxidative phosphorylation–associated TCA cycle metabolites. The similarities between flat OM and nacre topographies in aspects studied including nucleotide processing canonical pathways and activation of network hubs support the hypothesis of osteogenic differentiation of SSCs on the nacre topographical surface. Networks generated suggested an increase in TCA cycle components on nacre surfaces and flat OM, an indication of increased levels of oxidative phosphorylation. An increase in individual metabolites (creatine, glutamine, pyruvate and carnitine) observed has been linked to osteogenic differentiation40–42. Coupled with this, a predicted activation of collagen α1 and ERK1/2 strengthens the case for osteogenic differentiation on the nacre topography43,44. ACAC catalyses the conversion of acetyl-CoA to malonyl-CoA and therefore enhances the level of malonyl-CoA available, an increase which has been previously linked to stem cells progressing from a quiescence to differentiated state 45 . An increase in activation observed in this study further details SSC differentiation on the nacre surfaces. Interestingly, at day 21, the metabolomic profile of SSCs on flat OM appears to be less active in comparison with the nacre topography. Since differentiation is promoted by two different mechanisms in these studies, either chemically or topographically, it is likely that the progression of differentiation is different on these surfaces which could explain the variation.
The nacre surface presents the cells with a nanodisordered feature arrangement, previously shown to be important for the induction of osteogenesis8,9. This type of surface is believed to induce integrin clustering resulting in altered phenotype. Nacre is a natural surface and therefore the topography is distinct to machine computer–designed and generated topographies, which allows for further variation within the surface. It could be natural variation which allows nacre to provide the topographical cues necessary for osteogenic differentiation. In addition, when using the initial P. maxima shell as a mould, on the surface, there was not only the natural topography of the shell but also the proteins produced by the shell. The resulting PCL topographical mould is created via an intermediary polydimethylsiloxane (PDMS) mould and includes several washing steps. It is likely that during this time, the presence of these additions to the topography will have been removed, and only the shape of the proteins transferred during the soft lithography process, although it should be noted that this was not tested in the current studies, and the effect of the presence of these proteins remains currently unknown.
It has become apparent in recent studies that stem cells and wider bone regeneration processes benefit from a three-dimensional (3D) environment46,47. The use of a 2D topography, as in the current studies, could limit possible enhancement of osteogenesis observed in a 3D nacre topography environment. Future studies will evaluate the effect of a 3D nacre topographical environment on behaviour of SSCs.
To date, information on the role and function of the prism surfaces remains limited and the potential to modulate skeletal cell function and cell behaviour remains poorly understood. As this topography is vastly different to the nacre, it is not surprising that it has a different effect on the cell. Cell area of SSCs on prism surfaces was similar to flat control, indicating a lack of response to the surfaces, at least in terms of cell spreading. Analysis of gene expression demonstrated a significant increase in OCN expression. However, a similar result was not seen in other osteogenic markers tested including ALP and OPN, indicating lack of osteogenic response. Interestingly, there was an increase in RUNX2 expression on day 28, however; since RUNX2 expression is usually expected early on in osteogenic differentiation, this is unlikely to indicate potential osteogenic differentiation. Analysis of the metabolic profile of SSCs on prism surfaces demonstrated a decrease in metabolomic intensity. An increase in predicted activation of lactate dehydrogenase rather than those linked to TCA cycle indicated the potential for stem cell maintenance on this surface. 48 Further to this, a decrease in nucleotide biosynthesis and ACAC suggests a quiescent population. The role the prism surface remains to be fully elucidated; however, the current results suggest that the surface could provide topographical cues for maintenance of the stem cell phenotype.
In this study, SSCs were obtained from residual tissue samples of patients undergoing routine hip replacement and there are variations in sample retrieval area and health of bone marrow, both of which can result in differences in cell behaviour and their ability to respond to biomechanical factors. This patient sample variation has been observed previously 49 and has led to observed variation within the samples analysed in the authors’ experiments. A similar variation has been observed in the current studies and most apparent in gene expression studies. While this can complicate results of an experiment, these variations reflect the natural variation when using primary human tissue and emphasise the importance of using a clinically relevant cell population. It should be noted here that during these initial studies, a small number of patient samples, a total of four, were examined. This could have led to the observed sample variation and further studies should add to the current studies by increasing the number of samples examined to reduce experimental variation as a consequence of patient variability. Although the results discussed in these current studies showed enhancement of expression of osteogenic markers on nacre topographies and an increase in metabolomic activity of SSC cultured on nacre topography, the results were not consistent for all messenger RNA (mRNA) investigated and, interestingly, for cell area. In addition, analysis for the presence of mineralised tissue in the current work was not performed and future planned studies will address this issue.
The enhancement of osteogenic differentiation of commercially available MSCs on nacre has previously been shown, and this was associated with mineral formation of a higher crystallinity compared to mineralised matrix produced from chemically stimulated MSCs 22 . This study details nacre and prism effect on primary SSCs from donors who were undergoing routine total hip replacement for bone degeneration. Evaluation of a clinically relevant population, as in the current studies, confirms that nacre topography could induce osteogenic differentiation in the clinic. In order to translate these findings to the clinic, future experiments using nacre PCL-replicated topography to investigate in vivo bone regeneration on 2D topography would be required.
Conclusion
This study demonstrates a role for nacre PCL topography from P. maxima oyster shells to induce osteogenic differentiation in human SSCs and progenitor populations. Increase in cell area; increase in ALP, OCN and OPN gene expressions; and increase in metabolites and close association with SSCs cultured in flat OM conditions illustrated the potential for the nacre surface to control osteogenic differentiation. Further to this, this study improves understanding of stem cell response to prism topography. While the gene expression studies produced mixed results, metabolomics network analysis from SSCs cultured on the prism surface indicates that there was a maintenance of the SSC phenotype on these surfaces. By studying cell behaviour using a clinically relevant population, we have shown the potential for nacre topography to be used for controlling osteogenic differentiation in patients with degenerative bone disease and begun to understand the effects that the prism shell topography has on controlling SSC phenotype.
Supplemental Material
Waddell_et_al_SupplementaryFinal – Supplemental material for Biomimetic oyster shell–replicated topography alters the behaviour of human skeletal stem cells
Supplemental material, Waddell_et_al_SupplementaryFinal for Biomimetic oyster shell–replicated topography alters the behaviour of human skeletal stem cells by Shona J Waddell, María C de Andrés, Penelope M Tsimbouri, Enateri V Alakpa, Maggie Cusack, Matthew J Dalby and Richard OC Oreffo in Journal of Tissue Engineering
Footnotes
Acknowledgements
The authors gratefully acknowledge Carol-Anne Smith and Vineetha Jayawarna from University of Glasgow for preparation of topographical surfaces and Julia Wells from University of Southampton for technical support. This manuscript is dedicated to the memory of Professor Adam Curtis, who inspired, challenged and was unfailingly generous in his support of our work within the nanotopographical field over the last two decades.
Declaration of conflicting interests
The author(s) declared no potential conflicts of interest with respect to the research, authorship and/or publication of this article.
Ethical approval
Bone marrow samples were obtained from patients undergoing routine hip replacement. Surgery at University Hospital Southampton with full ethical consent and approval from the local hospital ethics committee (LREC 194/99/w, 27/10/10) and informed consent was obtained from all patients.
Funding
The author(s) disclosed receipt of the following financial support for the research, authorship, and/or publication of this article: The work in the authors’ laboratories was supported by grants from the BBSRC (BB/L021072/1 and BB/L00609X/1 and UK Regenerative Medicine Platform (MR/K026682/1) and University of Southampton to R.O.C.O. M.J.D. and M.C. acknowledge MRC grant MR/K011278/1.
Supplemental Material
Supplemental material is available for this article online.
References
Supplementary Material
Please find the following supplemental material available below.
For Open Access articles published under a Creative Commons License, all supplemental material carries the same license as the article it is associated with.
For non-Open Access articles published, all supplemental material carries a non-exclusive license, and permission requests for re-use of supplemental material or any part of supplemental material shall be sent directly to the copyright owner as specified in the copyright notice associated with the article.