
Abstract
Skeletal disorders pose significant challenges to health and quality of life, underscoring the critical need for innovative bone repair methods. Recent studies have spotlighted the promising role of extracellular vesicles (EVs) derived from bone marrow mesenchymal stem cells (BMSCs) in conjunction with biomimetic peptide (BP) WKYMVm (WK) for bone repair. This research leveraged a self-healing hydrogel as a carrier, effectively loading EVs and WK to enhance treatment efficacy. Through the regulation of vascular formation and osteoblast differentiation, notable advancements were achieved in mending femoral defect bone injuries, offering new possibilities for addressing bone metabolic disorders. The detailed methodology encompassed hydrogel preparation, EVs and WK loading, in vitro cell studies, and rat model experiments. Results unveiled that graphene oxide gelatin hydrogel loaded with wkymvm and extracellular vesicles (GOG@WK-EVs) notably bolstered osteogenic differentiation of bone cells and angiogenesis, while impeding osteoclast differentiation, culminating in potent bone regeneration within femoral defects.
Introduction
The skeleton is the second most frequently transplanted tissue globally, with over two million bone transplants performed each year for treating fractures and bone defects. However, traditional treatments such as bone grafts and metal implants face significant challenges, including infection risks, postoperative pain, high costs, and additional surgeries, complicating patient recovery and increasing healthcare burdens. 1 As a result, researchers have turned to advanced biomaterials, aiming to develop safer, more efficient solutions that overcome the limitations of conventional treatments and enhance bone repair outcomes.
Hydrogels are promising candidates in bone repair due to their three-dimensional porous structure, which resembles the extracellular matrix (ECM), and their excellent biocompatibility, which supports cell and bone tissue growth. 2 These hydrogels can fill irregular bone defects, reduce inflammatory responses, and minimize tissue damage. 3 However, traditional injectable hydrogels depend on a “sol-gel” transition that is difficult to control and may lead to incomplete solidification, limiting their clinical utility.4,5 Consequently, researchers have explored self-healing hydrogels, which utilize dynamic covalent bonds to improve stability, extend material lifespan, and better support bone repair. 6
Beyond hydrogels, biomimetic peptides (BPs) like WKYMVm (WK) and bone marrow mesenchymal stem cell (BMSC)-derived extracellular vesicles (EVs) have demonstrated strong potential in bone defect repair. EVs, which carry essential proteins, mRNAs, and miRNAs, play a crucial role in promoting bone cell differentiation and angiogenesis, accelerating the bone healing process. 7 WK, a biomimetic peptide, mimics natural signaling pathways that regulate osteogenesis and vascular formation, offering synergistic benefits for bone regeneration. 8 Direct injection of EVs and WK into bone defect sites can, however, result in rapid dispersion due to body fluid movement, diminishing their effectiveness.
This study aims to develop a self-healing and shear-thinning hydrogel (GOG), formed through dynamic covalent bonds, to enhance bone regeneration. We hypothesize that co-loading bone marrow mesenchymal stem cell-derived EVs and the biomimetic peptide WK into the GOG hydrogel will produce a synergistic effect in bone repair, achieving greater therapeutic efficacy than using them individually. Through this hydrogel carrier, we expect to achieve localized, sustained release of EVs and WK at bone defect sites, fully leveraging their complementary actions in promoting osteogenic differentiation and vascular formation, thereby maximizing their regenerative potential.
Materials and methods
Cell culture and identification
Healthy rat BMSCs (Catalog Number: CP-M131, Procell, China) were cultured in α-MEM medium (Catalog Number: SH30265.01, HyClone, Thermo Fisher Scientific, USA) supplemented with 15% fetal bovine serum (FBS; Catalog Number: 10091148, Thermo Fisher Scientific, USA) and 100 U/mL penicillin-streptomycin solution (Catalog Number: 10378016, Thermo Fisher Scientific, USA) at 37℃ in a 5% CO2 environment. The passage was performed when BMSCs reached 80% confluence, and in the third passage, BMSCs were used for differentiation testing and extraction of EVs.
BMSCs identification
A single-cell suspension was prepared at 1 × 10⁶/mL after washing with PBS. Cells were then divided into groups and incubated with fluorescently labeled antibodies: CD44-FTITC (Catalog Number: MA5-17522, Thermo Fisher Scientific, USA), CD90-PE (Catalog Number: ab33694, Abcam, UK), CD45-FITC (Catalog Number: ab33916, Abcam, UK), CD34-PE (Catalog Number: ab223930, Abcam, UK), and IgG (Catalog Number: ab150165, Abcam, UK). Following a 30-min incubation at 4℃, unbound antibodies were washed away with PBS, and the expression of corresponding marker antibodies in the samples was analyzed using a flow cytometer. Subsequently, the differentiation of BMSCs into osteoblasts, adipocytes, and chondrocytes was evaluated by staining with Alizarin Red Staining (ARS), Oil Red O, and Alcian Blue according to the instructions provided in the BMSCs differentiation induction kits (Catalog Number: PD-003/4/5, Procell, China).
BMSCs were cultured in α-MEM medium containing 10% FBS and macrophage colony-stimulating factor (M-CSF) (10 ng/mL, Catalog Number: PCK044, Procell, China) for 1 day. The concentration of M-CSF was adjusted to 30 ng/mL for continued cultivation for 3 days. Subsequently, adherent cells were differentiated into BMMs.
Rat umbilical vein endothelial cells (UVECs) were obtained from Procell (Catalog Number: CP-R232) and cultured in endothelial cell medium (ECM, Catalog Number: 1001, Wegene, China) supplemented with 5% fetal bovine serum, 1% v/v penicillin/streptomycin, and 1% ECGS (Catalog Number: KGY1052, KGI, China) at 37℃ in a 5% CO2 environment. UVECs from passages 2–5 (P2–P5) were used for subsequent cellular functional experiments.
Cell grouping
The cell experiments: (1) Control group (incubated with PBS as a control); (2) GOG group (incubated with GOG hydrogel); (3) GOG@EVs group (incubated with GOG@EVs hydrogel); (4) GOG@WK group (incubated with GOG@WK hydrogel); (5) GOG@WK-EVs group (incubated with GOG@WK-EVs hydrogel).
Isolation, purification, and identification of EVs derived from BMSCs
The third passage of BMSCs was cultured until reaching 80%–90% confluence. After removing the culture supernatant and washing twice with PBS, the cells were incubated with 10% FBS medium devoid of EVs and continued cultivation in a CO2 incubator at 37℃ for 48 h. The collected culture supernatant underwent centrifugation steps at 500g for 15 min at 4℃ to remove cell debris, 2000g for 15 min at 4℃ to eliminate cell debris or apoptotic bodies, and 10,000g for 20 min at 4℃ to discard large vesicles. Subsequently, the supernatant was filtered through a 0.22 μm filter, followed by ultracentrifugation at 110,000g for 70 min at 4℃, resuspended in sterile PBS, and subjected to downstream experiments under the same conditions. All ultracentrifugation steps were performed at 4 °C using the Beckman ultracentrifuge (Optima L-90K, bio-thing, USA) equipped with the SW-32Ti rotor, while the remaining low-speed centrifugation utilized the Beckman Allegra X-15R benchtop centrifuge (Beckmancoulter, USA).
Nanoparticle tracking analysis (NTA)
EVs were dissolved in 1 mL PBS at a concentration of 20 μg, vortexed for 1 min to ensure uniform distribution, and then the size distribution of EVs was directly observed and measured using NanoSight nanoparticle tracking analyzer (Malvern Instruments Ltd, Malvern Panalytical).
Transmission electron microscopy (TEM)
Freshly isolated EV samples (20 μL) were loaded onto carbon-coated copper electron microscope grids for 2 min and negatively stained with phosphotungstic acid solution (12501-23-4, Sigma-Aldrich, USA) for 5 min. The grids were subsequently rinsed three times with PBS to remove the excess phosphotungstic acid solution, partially air-dried using filter paper, and observed at 80 kV using the Hitachi H7650 TEM (DOLEE).
Western blot analysis was employed to identify surface markers of EVs. After concentrating the EV suspension and determining the protein content using the BCA assay kit (23227, Thermo Fisher Scientific, USA), SDS-PAGE gels were prepared for protein denaturation, electrophoresis, membrane transfer, and detection of specific marker proteins HSP70, CD9, CD81, and Calnexin on EVs.
DiR dye (D12731, Thermo Fisher Scientific, USA) was added to the EV solution at a concentration of 1:400 and incubated for 30 min to obtain DiR-labeled EVs. Subsequently, the excess dye was removed by ultracentrifugation at 100,000g for 90 min to obtain the labeled EVs.
Sources of reagents and materials
Dextran (00271), NaIO4 (769517), β-glycerol phosphate (50020), dexamethasone (D1756), ascorbate-2-phosphate (49752), cetylpyridinium chloride (CPC, C1000000), Triton X-100 (X100PC), paraformaldehyde (8.18715), crystal violet (61135), lithium phenyl-2,4,6-trimethylbenzoylphosphinate (LAP, 900889), gelatin methacryloyl (GelMA, 900629), Gel lysis kit (S7705), glycerol-3-phosphate (G9422), dexamethasone (D4902), and ascorbate-2-phosphate (49752) were all purchased from Sigma-Aldrich (MO, USA). The peptide WK (Trp-Lys-Tyr-Met-Val-D-Met-NH2) was obtained from Nanjing Peptide Valley Biotechnology Co., Ltd. (Jiangsu, China), and was fluorescently labeled with FITC by the company.
Preparation of GOG@WK-EVs hydrogels
A 3% NaIO4 solution (w/v) was added dropwise to a 5% Dextran solution (w/v), and the mixture was stirred in the dark for 3 h. An equal amount of diethylene glycol was added to quench the unreacted NaIO4. After complete dialysis of the oxidized Dextran (ODex) solution, freeze-drying was carried out at −80℃. The resulting freeze-dried foam of ODex was stored at −20℃. The synthesis of ODex was characterized by 1H nuclear magnetic resonance (NMR) and Fourier-transform infrared (FTIR) spectroscopy (Supplemental Figure S1). The oxidation degree of Dextran was quantitatively determined by reacting the aldehyde groups incompletely with tert-butylcarbazate (TBC), resulting in an oxidation degree of 35.6%.
GelMA and LAP were dissolved in PBS at 50°C (with final concentrations of 10% and 0.25% w/v, respectively). The solution was then mixed with the ODex solution to reach a final concentration of 1% (w/v). After incubation at 37°C for 30 min, a sulfonated graphene oxide gelatin hydrogel (S-GOG) was obtained. By irradiating the S-GOG with 405 nm light (25 mW/cm2) for 90 s, GOG was produced. For the loading of peptides and EVs into the GOG hydrogel, the WK peptide solution/EVs solution was pre-mixed with the ODex solution, incubated at 37°C for 30 min, followed by the addition of the GelMA and LAP solution, resulting in final concentrations of 500 μg/mL for WK-FITC and 0.2 μg/μL for EVs.
A solution containing 10% GelMA (w/v) and 0.25% LAP (w/v) was irradiated at 405 nm light for 90 s (25 mW/cm2) to obtain GelMA hydrogels, serving as the control.
Characterization of GOG hydrogels
FTIR analysis
The FTIR spectra of ODex, GelMA, S-GOG, and GOG were measured using a NICOLET 6700 FTIR spectrometer (Thermo, USA) in the range of 4000–550 cm-1.
Scanning electron microscopy (SEM)
Following freeze-drying, the hydrogels were loaded onto copper grids, sputter-coated with gold, and characterized using a scanning electron microscope (FEI QUANTA200, Czech).
Compression analysis
The GelMA, S-GOG, GOG, GOG@WK, GOG@EVs, and GOG@WK-EVs hydrogels were subjected to compression stress-strain analysis using a universal testing machine (GnstonE3000, UK). The hydrogels were prepared into cylinders with a diameter of 13 mm and a height of 5 mm. The compression analysis was conducted at 80% of the original height with a stable strain rate of 1 mm/min.
Rheological testing
Rheological measurements were performed using an AR-G2 rheometer (TA Instruments). Time sweep oscillatory tests were conducted immediately after loading the precursor hydrogel mixture with 0.5% strain and 1 Hz frequency to monitor the gelation process. Once the hydrogel was stable, frequency sweep tests were conducted at 0.5% strain and 1 Hz frequency over 1–100 rad/s. To quantitatively assess the self-healing ability of the hydrogel, the gel was first broken by increasing the strain from 0.5% to 200% at 1 Hz, followed by monitoring the self-healing behavior through time sweep tests as the strain returned to 0.5%.
In vitro release of WK and EVs in GOG@WK-EVs
WK-FITC, EVs-DiR, ODex, GelMA, and LAP were dissolved in PBS following previous methods. WK-FITC and EVs-DiR were mixed with the ODex solution and incubated at 37℃ for 30 min. GelMA and LAP solutions were added to obtain S-GOG hydrogels containing WK-FITC at a final concentration of 500 μg/mL and EVs at a final concentration of 0.2 μg/μL. 1.5 mL of S-GOG was irradiated with 405 nm (25 mW/cm2) light for 90 s, then immersed in a 15 mL centrifuge tube containing 4 mL of PBS. At different time points (1, 3, 6, 9, 12, 15, 18, and 21 days), 100 μL of supernatant was collected and supplemented with fresh 100 μL of PBS. The concentration of WK and EVs in the supernatant was evaluated by measuring the fluorescence intensity of FITC (Ex: 492 nm, Em: 518 nm) and DiR (Ex: 754 nm, Em: 778 nm) in the supernatant. Release curves were plotted based on the ratio of supernatant to total fluorescence intensity.
Cell counting kit-8 (CCK-8) method, live/dead cell staining for cell viability, and proliferation assessment
Live/dead cell staining
BMSCs, BMMs, and UVECs were seeded at a density of 2 × 10⁴ cells per well in 48-well plates coated with different hydrogels and cultured for 6, 12, 24, and 48 h. Live/dead cell staining was performed using the Live/Dead Cell Viability Assay Kit (L10119, Invitrogen, USA) according to the manufacturer’s instructions. Calcein-AM and ethidium homodimer-1 were diluted in D-PBS to final concentrations of 2 and 4 μM, respectively. Subsequently, the culture medium was removed from BMSCs, BMMs, and UVECs at different time points, and the staining solution was added to the wells. The cells were then incubated at 37°C and 5% CO2 for 30 min in a humidified cell culture incubator. Live cells (green, Ex: 480 nm, Em: 530 nm) and dead cells (red, Ex: 530 nm, Em: 645 nm) were imaged using an inverted fluorescent microscope (IMT-2, Olympus, Japan).
MTT assay
BMSCs, BMMs, and UVECs were seeded at a density of 2 × 10⁴ cells per well in 48-well plates coated with different hydrogels and cultured for 6, 12, 24, and 48 h. The CyQUANT™ MTT Cell Viability Assay Kit (V13154, Invitrogen, USA) was used according to the manufacturer’s instructions. To prepare a 12 mM MTT stock solution, 1 mL of PBS was added to Component A and vortexed or sonicated until dissolved. In another tube, 10 mL of 0.01 M HCL was added to Component B (SDS) and mixed by inversion or sonication until dissolved. Subsequently, the culture medium was removed from BMSCs, BMMs, and UVECs at different time points, the cells were washed with fresh medium, and 10 μL of the MTT stock solution was added to each well. The cells were then incubated at 37°C in a CO2 incubator for 4 h, the samples were homogenized using a pipette, and the absorbance at 570 nm was measured.
For the CCK-8 cell proliferation assay, BMSCs, BMMs, and UVECs were seeded at a density of 1 × 10⁴ cells per well in 48-well plates coated with different hydrogels. On days 1, 3, 5, and 7 of culture, fresh medium containing 10% CCK-8 (CA1210, Solarbio, Beijing, China) was added to the wells, followed by incubation under dark conditions for 1 h. Subsequently, 100 μL of the supernatant was transferred to a 96-well plate, and the absorbance at 450 nm was measured using a microplate spectrophotometer (Bio-Tek, UK).
Immunofluorescent staining was performed using iFluor™ 488-phalloidin (ab176753, Abcam, UK) and DAPI (ab285390, Abcam, UK). BMSCs, BMMs, and UVECs were seeded at a density of 1 × 10⁵ cells per well in 35 mm glass-bottom dishes coated with different hydrogels. The cells were fixed in 4% paraformaldehyde, permeabilized with PBS containing 1% Triton X-100, stained with phalloidin for 1 h at room temperature, followed by DAPI staining for 5 min. Finally, cells were imaged using a laser scanning confocal microscope (Olympus FV1000, BX61W1, Japan).
Induction and identification of osteoblast differentiation
BMSCs were 3D cultured in various hydrogels, and an osteogenic induction medium was prepared by adding 10 mM β-glycerophosphate, 100 nM dexamethasone, and 50 mg/mL ascorbic acid-2-phosphate to the BMSC culture medium. During the induction of BMSC osteogenic differentiation, the medium was changed every 3 days. The cells were obtained after the hydrogel was broken down using a GelMA dissolution kit (EFL-GM-LS-001, Suzhou) and trypsin (R001100, Thermo Fisher Scientific, USA).
Alkaline phosphatase (ALP) staining was performed using an ALP staining kit (40749ES60, Yeasen, China), following the manufacturer’s instructions. BMSCs induced for 7 days were fixed with 4% paraformaldehyde, washed with PBS, and stained for 30 min. Stained cells were imaged using a microscope (IX73, OLYMPUS, Japan). Furthermore, to evaluate ALP activity in BMSCs, we characterized cell lysates using an ALP activity assay kit (MAK411, Sigma-Aldrich). The ALP activity was determined by incubating with a p-nitrophenyl phosphate solution and measuring the absorbance at 520 nm using a microplate spectrophotometer (Bio-Tek, Thermo Fisher Scientific, USA).
ARS staining was performed to visualize the calcium deposits in BMSCs induced for 21 days. The BMSCs were fixed with 4% paraformaldehyde, stained with ARS solution (PH1354, PHYGENE) at room temperature for 30 min, and washed with PBS. Stained cells were imaged using an inverted microscope (IX73, OLYMPUS). The calcium deposits stained by ARS were dissolved using 10% cetylpyridinium chloride (CPC, C0732, Sigma-Aldrich), and the absorbance was measured at 562 nm using a microplate spectrophotometer to assess the mineralization process.
Osteoclast induction and identification
To induce osteoclast differentiation, BMMs were seeded in 6-well plates (1 × 10⁵ cells/well, 2 mL medium/well) and cultured normally. After 2 days of culture, osteoclast-specific induction medium (containing 10% FBS, 30 ng/mL M-CSF, and 50 ng/mL RANKL (78214.2, STEMCELL Technologies Inc.) in DMEM medium) was used for culturing with medium change every 3 days.
For TRAP staining, BMMs were seeded at 0.5 × 10⁴ cells/well in a 96-well plate with 50 ng/mL RANKL added. TRAP staining was performed using the tartrate-resistant acid phosphatase (TRAP) activity assay kit (CS0740, Sigma-Aldrich), with TRAP-positive cells defined as those containing three or more stained cells.
Immunofluorescent staining was carried out to detect multinucleation. Induced BMM cells were stirred in 3.7% paraformaldehyde/PBS solution for 3 min, followed by three washes with PBS. Cells were permeabilized with 0.1% Triton X/PBS, stained with DAPI for 10 min, rinsed with PBS, and treated with 400 μL of iFluor™ 488-phalloidin per well. The cells were observed using a laser scanning confocal microscope (Olympus, Japan).
Transwell, scratch assay, and tube formation experiments to assess UVEC migration and vascular formation
Migration of UVECs was evaluated through Transwell experiments. UVECs were trypsinized, suspended, and seeded at a density of 2×10⁵/insert in the upper chamber of 8.0 μm Transwell chambers (BDFalcon™, USA). Various hydrogels were placed in the lower chamber. After 24 h, cells were fixed with 4% paraformaldehyde for 30 min, followed by staining with 0.1% crystal violet. Migration of the cells was imaged using a microscope (IX73, OLYMPUS).
UVEC migration was assessed using a scratch assay. UVECs were seeded at a density of 2 × 10⁵ cells/well in 12-well plates and allowed to grow to confluence. After 3 h of serum starvation, a scratch was made in the monolayer (approximately 600 μm wide), and cells were incubated for 12 h at 37℃ and 5% CO2 with different extraction media (i.e. respective hydrogels soaked in serum-free culture medium for 72 h). Subsequently, cells were imaged using a microscope (IX73, OLYMPUS). ImageJ software was used to quantitatively measure the relative closure of the scratch.
The tube formation ability of UVECs was evaluated. After thawing overnight on ice, 250 μL of Matrigel (BD Biosciences, USA) was added to each well of a 48-well plate and incubated at 37℃ for 30 min to allow gelation. UVECs were seeded at a concentration of 2.5 × 10⁴ cells/well on Matrigel and treated with different extraction media. Cells were then incubated at 37℃, 5% CO2 for 6 h. Subsequently, cells were imaged using a microscope (IX73, OLYMPUS). Quantitative analysis was performed using ImageJ software.
Immunofluorescence co-staining
Cells were fixed with 4% paraformaldehyde at room temperature for 15 min, followed by two washes with PBS and permeabilization with 0.5% Triton X-100 (P0096, Beyotime) for 10 min. Subsequently, cells were incubated overnight at 4℃ with primary antibodies: sheep anti-osteopontin (OPN) (ab11503, 1:200, Abcam, UK) and rabbit anti-RUNX2 (#12556, 1:6400, CST). After washing three times with PBS, the sections were incubated for 1 h with secondary antibodies conjugated to Alexa Fluor 488 (ab150129/ab150077, 1:200, Abcam, UK). Following another three washes with PBS, cells were stained with DAPI (10 μg/mL, D3571, Thermo Fisher, USA) for 10 min at room temperature. The sections were stored at 4℃ and observed using a fluorescence microscope (IMT-2, Olympus).
RT-qPCR for relative gene expression in cells
Total RNA from cells was extracted using Trizol (Catalog: 16096020, Invitrogen, USA) and the purity and concentration of obtained RNA were assessed by measuring absorbance at 260 and 280 nm using a spectrophotometer. Samples with an A260/A280 ratio ⩾1.8 were considered suitable. cDNA was synthesized using a reverse transcription kit (Catalog: 11483188001, Roche, Switzerland) following reverse transcription conditions of 42℃ for 15 min (reverse transcription reaction) and 85℃ for 5 s (reverse transcriptase inactivation reaction). The reverse-transcribed cDNA was diluted to a 50 ng/μL concentration for subsequent quantitative PCR. PCR was performed using LightCycler 480 SYBR Green I Master under the following conditions: initial denaturation at 95℃ for 10 min, amplification at 95℃ for 15 s, 60℃ for 20 s, and 72℃ for 20 s for 40 cycles. GAPDH was used as the reference gene, and the experimental group’s fold change in target gene expression compared to the control group was calculated using the 2−ΔΔCt method. The primer sequences are listed in Supplemental Table S1. The 2−ΔΔCt method represents the fold change in target gene expression between the experimental and control groups. The formula is as follows: ΔΔCt = ΔCt experimental group - ΔCt control group, where ΔCt = Ct(target gene) − Ct(reference gene), with the experiment repeated three times.
Detection of protein expression in cells using western blot
Tissue or cellular total proteins were extracted using high-efficiency RIPA lysis buffer (C0481, Sigma-Aldrich, USA) containing 1% protease inhibitor and 1% phosphatase inhibitor (ST019-5mg, Beyotime, Shanghai, China) following the manufacturer’s instructions. After lysis at 4°C for 15 min and centrifugation at 15,000 rpm for 15 min, the supernatant was used to determine protein concentration with a BCA assay kit (23227, Thermo Fisher Scientific, USA) for each sample. Proteins were quantified by adding 5× loading buffer (P0015, Bi Yun Tian, China) at different concentrations, separated by polyacrylamide gel electrophoresis, and transferred onto a PVDF membrane (IPVH00010, Millipore, Billerica, MA, USA), and blocked with 5% BSA at room temperature for 1 h. Primary antibodies including mouse anti-HSP70 (ab2787, 78 kDa, 1:1000), rabbit anti-CD9 (ab307085, 23 kDa, 1:1000), rabbit anti-CD81 (ab109201, 26 kDa, 1:1000), rabbit anti-Calnexin (ab133615, 68 kDa, 1:1000), mouse anti-RUNX2 (ab76956, 57 kDa, 1:1000), rabbit anti-ALPL (ab65834, 57 kDa, 1:1000), and mouse anti-GAPDH (ab8245, 37 kDa, 1:1000) were added and incubated overnight at 4°C. The following day, the membrane was washed with TBST for 5 min × three times, followed by incubation with HRP-conjugated goat anti-rabbit IgG (1:2000, ab205718, Abcam, UK) or goat anti-mouse IgG (1:2000, ab6789, Abcam, UK) dilution at room temperature for 1.5 h. After incubation, the membrane was washed with TBST for 5 min × three times, and visualization was done by adding a chemiluminescent substrate (NCI4106, Pierce, Rockford, IL, USA). Protein quantification analysis was performed using ImageJ software by comparing the grayscale values of each protein to that of the internal control GAPDH. Each experiment was repeated three times.
Establishment of rat tibial bone defect model
Twenty-four male Sprague-Dawley rats aged 7 weeks weighing 250–300 g were purchased from Beijing Vital River Laboratory Animal Technology Co., Ltd. (strain code: 101, Beijing, China). The rats were individually housed in an SPF-grade animal facility with a humidity of 60%–65% and a temperature of 22°C–25°C, maintaining a 12-h light-dark cycle with ad libitum access to food and water. After an adaptation period of 1 week, the rats underwent a health assessment before the experiment. Our institution’s animal ethics committee approved all animal procedures, and all experiments complied with local regulations on the care and use of laboratory animals.
Surgical procedure for tibial bone defects
Rats were anesthetized, and under strict aseptic conditions, a 1.5 cm longitudinal incision was made on the lateral side of each leg’s femoral condyle. Subcutaneous tissues, fascia, muscles, and periosteum were meticulously dissected to expose the underlying bone. Dental micromotor parameters were adjusted to create a 4 mm deep hole in the subchondral bone using a 4 mm circular bone drill to induce bone defects. Subsequently, the corresponding hydrogel was injected into the defect area. After filling the defect site, the hydrogel was exposed to 405 nm light for 90 s (25 mW/cm2) to form a secondary network. Soft tissues and skin were then carefully sutured layer by layer. After 8 weeks, the rats were euthanized to obtain the tibiae. Tissues were fixed in 4% paraformaldehyde solution for 24 h and stored in 75% ethanol for further analysis.9–11
The rats were randomly divided into five groups, each consisting of six rats: (1) Control group (sham surgery); (2) GOG group (injection of GOG hydrogel); (3) GOG@EVs group (injection of GOG@EVs hydrogel); (4) GOG@WK group (injection of GOG@WK hydrogel); (5) GOG@WK-EVs group (injection of GOG@WK-EVs hydrogel). In each group, 100 μL of hydrogel was injected, with a final concentration of 500 μg/mL for WK and 0.2 μg/μL for EVs.
Observation of new bone tissue formation at rat tibial bone defects by micro-CT and X-ray imaging
Micro-computed tomography (Micro-CT; Bruker, Germany) was conducted using a 280 µA source current, a source voltage of 90 kV, and an exposure time of 550 ms. Scans were performed with the same calibration parameters, and NRecon software was utilized to reconstruct sagittal and axial views of each defect area for subsequent three-dimensional analysis. Bone mineral content (BMC), new bone volume (BV/TV%), and bone mineral density (BMD) were calculated to quantify new mineralized tissue formation. Following sample retrieval, X-ray images were captured.
Histological staining with H&E and Masson’s trichrome to assess pathological changes and collagen deposition in rat tibial tissue
Tibial tissues were decalcified in ethylenediaminetetraacetic acid (EDTA) for 6 weeks, dehydrated through a graded alcohol series, embedded in paraffin, and sectioned into 6 µm slices for staining. Subsequently, the sections were stained using hematoxylin and eosin (H&E; G1076-500ML, Servicebio) and Masson’s trichrome staining kit (G1340, Solarbio, Beijing, China) according to the instructions.
TRAP staining for osteoclastic formation in rat tibial tissue
The bone tissues were decalcified in EDTA for 6 weeks, dehydrated through a graded alcohol series, embedded in paraffin, and sectioned into 6 µm slices for staining. Subsequently, the sections were stained using the TRAP staining kit (G1492, Solarbio, Beijing, China) following the instructions.
Immunohistochemical (IHC) staining to detect protein expression in rat tibial tissue
Rat tibial tissue paraffin sections were deparaffinized to water, dehydrated in a gradient of alcohol, and subjected to antigen retrieval in a water bath, followed by cooling in tap water. Normal goat serum blocking solution (Catalog No: C-0005, Shanghai Haoran Biotechnology Co., Ltd., China) was added to the tissue sections and left at room temperature for 20 min, after which excess liquid was drained off the slides. Primary antibodies OPN (ab63856, 1:500, Abcam, UK), PECAM1 (ab182981, 1:2000, Abcam, UK), and TRAP (ab65854, 1:500, Abcam, UK) were applied to the tissue sections and left overnight at 4℃. The slides were washed three times for 5 min each in 0.1 M PBS, followed by adding a secondary antibody, goat anti-rabbit IgG (ab6721, 1:1000, Abcam, UK), for 20 min at 37℃. Then, the slides were incubated with a horseradish peroxidase-labeled streptavidin protein working solution (Catalog No: 0343-10000U, Yimo Biotechnology Co., Ltd., China) for 20 min at 37℃, followed by DAB (Catalog No: ST033, Guangzhou Weijia Technology Co., Ltd., China) staining. After the staining process, the slides were rinsed with water, counterstained with hematoxylin (Catalog No: PT001, Shanghai Bogu Biotechnology Co., Ltd., China) for 1 min, followed by a rinse with 1% ammonia water and dehydration in alcohol gradients of certain concentrations, clearing in xylene, mounting with neutral resin, and observation and photomicrography under a microscope.
Statistical analysis
Statistical analysis of the data in this study was conducted using SPSS 21.0 software (IBM, USA). Continuous data were expressed as mean ± standard deviation. Initially, normality and homogeneity of variance were assessed. For normally distributed data with homogenous variances, inter-group comparisons were performed using t-tests, and multiple-group comparisons utilized a one-way analysis of variance. Post hoc tests were conducted using Tukey’s method. For data comparisons among different time points, repeated measures analysis of variance was employed, followed by Tukey’s post hoc test. A significance level of p < 0.05 was considered statistically significant.
Results
Incorporation of EVs and BPs WK into self-healing hydrogel for enhanced osteogenic repair
Traditional injectable hydrogels that promote bone defect regeneration are typically based on the “sol-gel” transition strategy. This process involves the hydrogel transitioning from a liquid state as it is extruded from the syringe to a solid gel state at the injury site through factors such as injection time or external stimuli like heat and pH responsiveness. 4 However, the gelation process can be challenging, occasionally resulting in injection failure due to time constraints associated with injectable hydrogels, which are predominantly dependent on the gelation process. 5 Therefore, this study introduces a self-healing hydrogel with shear-thinning characteristics formed by dynamic covalent bonds, which maintains a gel state before injection and transitions to a liquid state during the injection. Post-injection, the hydrogel rapidly self-heals at the injury site. Furthermore, a secondary reinforcement network is formed via photopolymerization to prevent rapid degradation and ensure sufficient mechanical strength for bone regeneration.
Initially, GelMA and ODex solutions were mixed to form an S-GOG, which, after incubation at 37°C for 30 min, transitioned from a transparent liquid to a light yellow gel state. In contrast, the GelMA-only gel remained liquid before light treatment (Figure 1(a)). Subsequently, GelMA, ODex, S-GOG, and GOG (secondary network hydrogel) hydrogels were subjected to FTIR analysis. As shown in Figure 1(b), the 1730 cm−1 characteristic peak corresponding to ODex carbonyl (C=O) stretching vibration nearly disappeared in the spectra of S-GOG and GOG. Moreover, the intensity of the 1542 cm−1 GelMA amino group (-NH2) peak significantly decreased, with a new peak at 1644 cm−1, indicating the formation of the primary network due to the Schiff base reaction between aldehyde and amino groups. Furthermore, compared to S-GOG, a slight decline in the amide II peak at 1534 cm−1 in the GOG spectrum suggested a reaction between methyl methacrylate groups during photopolymerization, leading to the formation of the secondary network.

Characterization of GOG.
Further morphological analysis of GelMA, S-GOG, and GOG hydrogels via SEM revealed a porous microstructure, with pore size diminishing as the network strengthened incrementally (Figure 1(c)). Large hydrogel blocks stained with TAMRA (red) and FITC (yellow) were halved to assess the self-healing capability of S-GOG hydrogel. A gradual reduction in gaps was observed by exchanging and placing the halves together, culminating in complete fusion after 30 min of incubation at 37°C (Figure 1(d)). Compressive testing results indicated a relatively flat curve for S-GOG hydrogel, while GOG hydrogel displayed a characteristic “J-shaped” stress-strain curve, signifying a significant enhancement in mechanical strength through the introduction of covalent bonds via photopolymerization dynamics in S-GOG. Additionally, the compression modulus of GOG was notably higher than GelMA, demonstrating that the Schiff base reaction between aldehyde and amino groups could enhance its mechanical strength (Figure 1(e) and (f)). The gelation time of the materials was characterized using a rheometer. It was observed that GelMA and ODex formed S-GOG hydrogel through the Schiff base reaction (Figure 1(g)).
Furthermore, frequency scan results indicated that within the 1–100 Hz range, the G′ value consistently exceeded the corresponding G′ value, showcasing the formation of a stable structure through the initial network (Figure 1(h)). The swelling ratio of GelMA, S-GOG, and GOG hydrogels was also investigated. As depicted in Figure 1(i), compared to GelMA hydrogel (17.36 ± 2.45%) and S-GOG hydrogel (58.43 ± 6.12%), the GOG hydrogel exhibited the lowest swelling ratio (12.41 ± 2.63%). This implies that introducing dynamic covalent bonds could increase the network density and reduce the swelling ratio of the hydrogel. Decreasing the swelling ratio enhances the mechanical stability and morphological compatibility of GOG hydrogel, as the rapid absorption of surrounding water leading to a quick increase in volume may accelerate the hydrogel’s degradation. 9
Literature reports suggest that EVs derived from BMSCs and BPs WK can promote bone defect repair.7,8 However, direct injection of EVs and WK into bone defect sites can lead to their dispersion in the body due to liquid flow, significantly reducing their efficacy. Therefore, in this study, we aimed to simultaneously load EVs and WK into GOG hydrogel to immobilize EVs and WK at the bone defect sites while enhancing their reparative effects through sustained release.
Initially, we induced adipogenic, osteogenic, and chondrogenic differentiation of BMSCs, confirming their capabilities in these processes (Figure 2(a)). Flow cytometry analysis revealed positive expression of CD90 and CD44 and negative expression of IgG, CD45, and CD34 in BMSCs (Figure 2(b)). Subsequently, BMSC-derived EVs were isolated via differential centrifugation. Morphological assessment by TEM confirmed that BMSC-EVs exhibited circular or oval-shaped membrane vesicles (Figure 2(c)), with a particle size around 120 nm, as detected by NTA (Figure 2(d)). Western blot analysis of the EVs indicated significant upregulation of the specific surface markers CD9, HSP70, and CD81, while Calnexin was not expressed (Figure 2(e)), confirming the successful isolation of EVs.
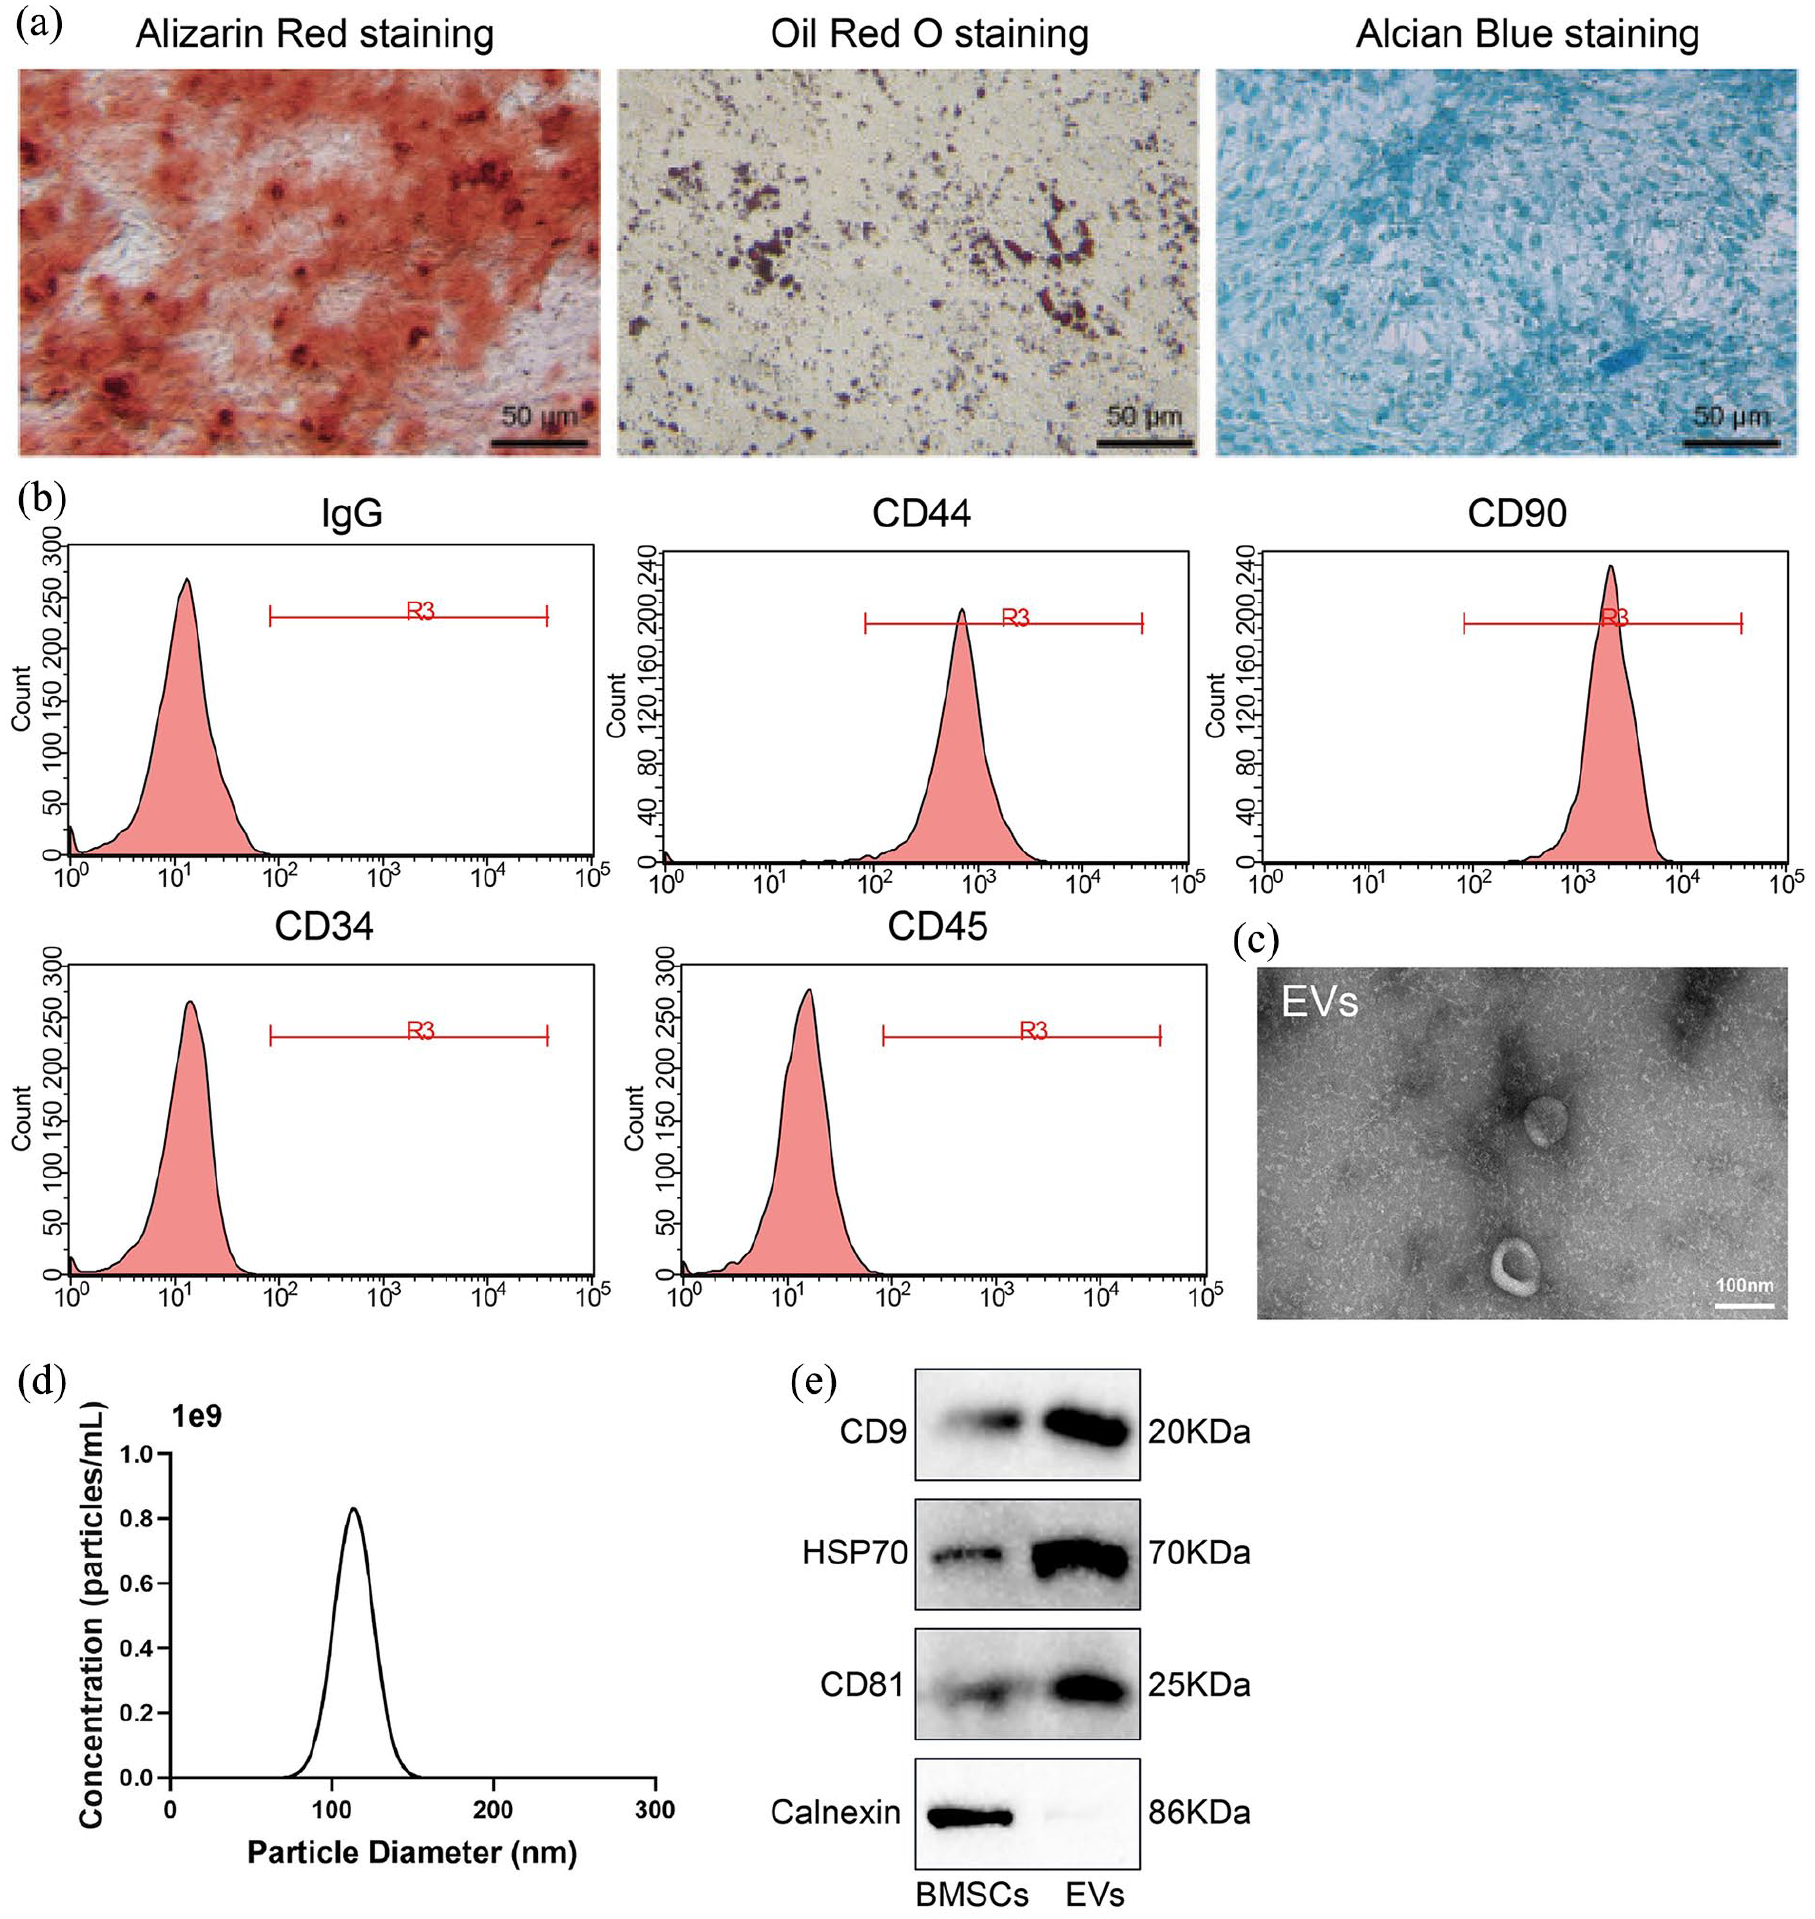
Characterization of BMSCs and EVs.
By reacting the amino groups of WK with the ODex carbonyl groups in GOG, we loaded WK into the GOG hydrogel, resulting in GOG@WK. SEM imaging revealed a further reduction in pore size compared to GOG in GOG@WK (Figure 3(a)). Subsequently, DiR-labeled EVs were mixed with the GOG@WK solution. SEM (Figure 3(a) and (b)) and inverted fluorescence microscopy (Figure 3(c)) confirmed the successful loading of EVs into GOG@WK, leading to GOG@WK-EVs, while GOG directly loaded with EVs was used as a control (Figure 3(c)). Subsequently, we conducted performance tests on GOG@EVs, GOG@WK, and GOG@WK-EVs. The results showed that there was no significant change in mechanical strength before and after the loading of WK, EVs, or WK-EVs onto the GOG hydrogel (Figure 3(d) and (e)). Further evaluation of the effective release of WK and EVs from GOG@WK-EVs was performed using FITC-labeled WK and DiR-labeled EVs. Dialysis-based release assessment showed a WK release rate of 81% and an EVs release rate of 95% within 21 days (Figure 3(f)–(g)). Additionally, activity testing of the dialyzed EVs indicated that GOG hydrogel effectively preserved the activity of EVs through TEM, NTA, and Western blot analyses (Figure 3(h)—(j)).
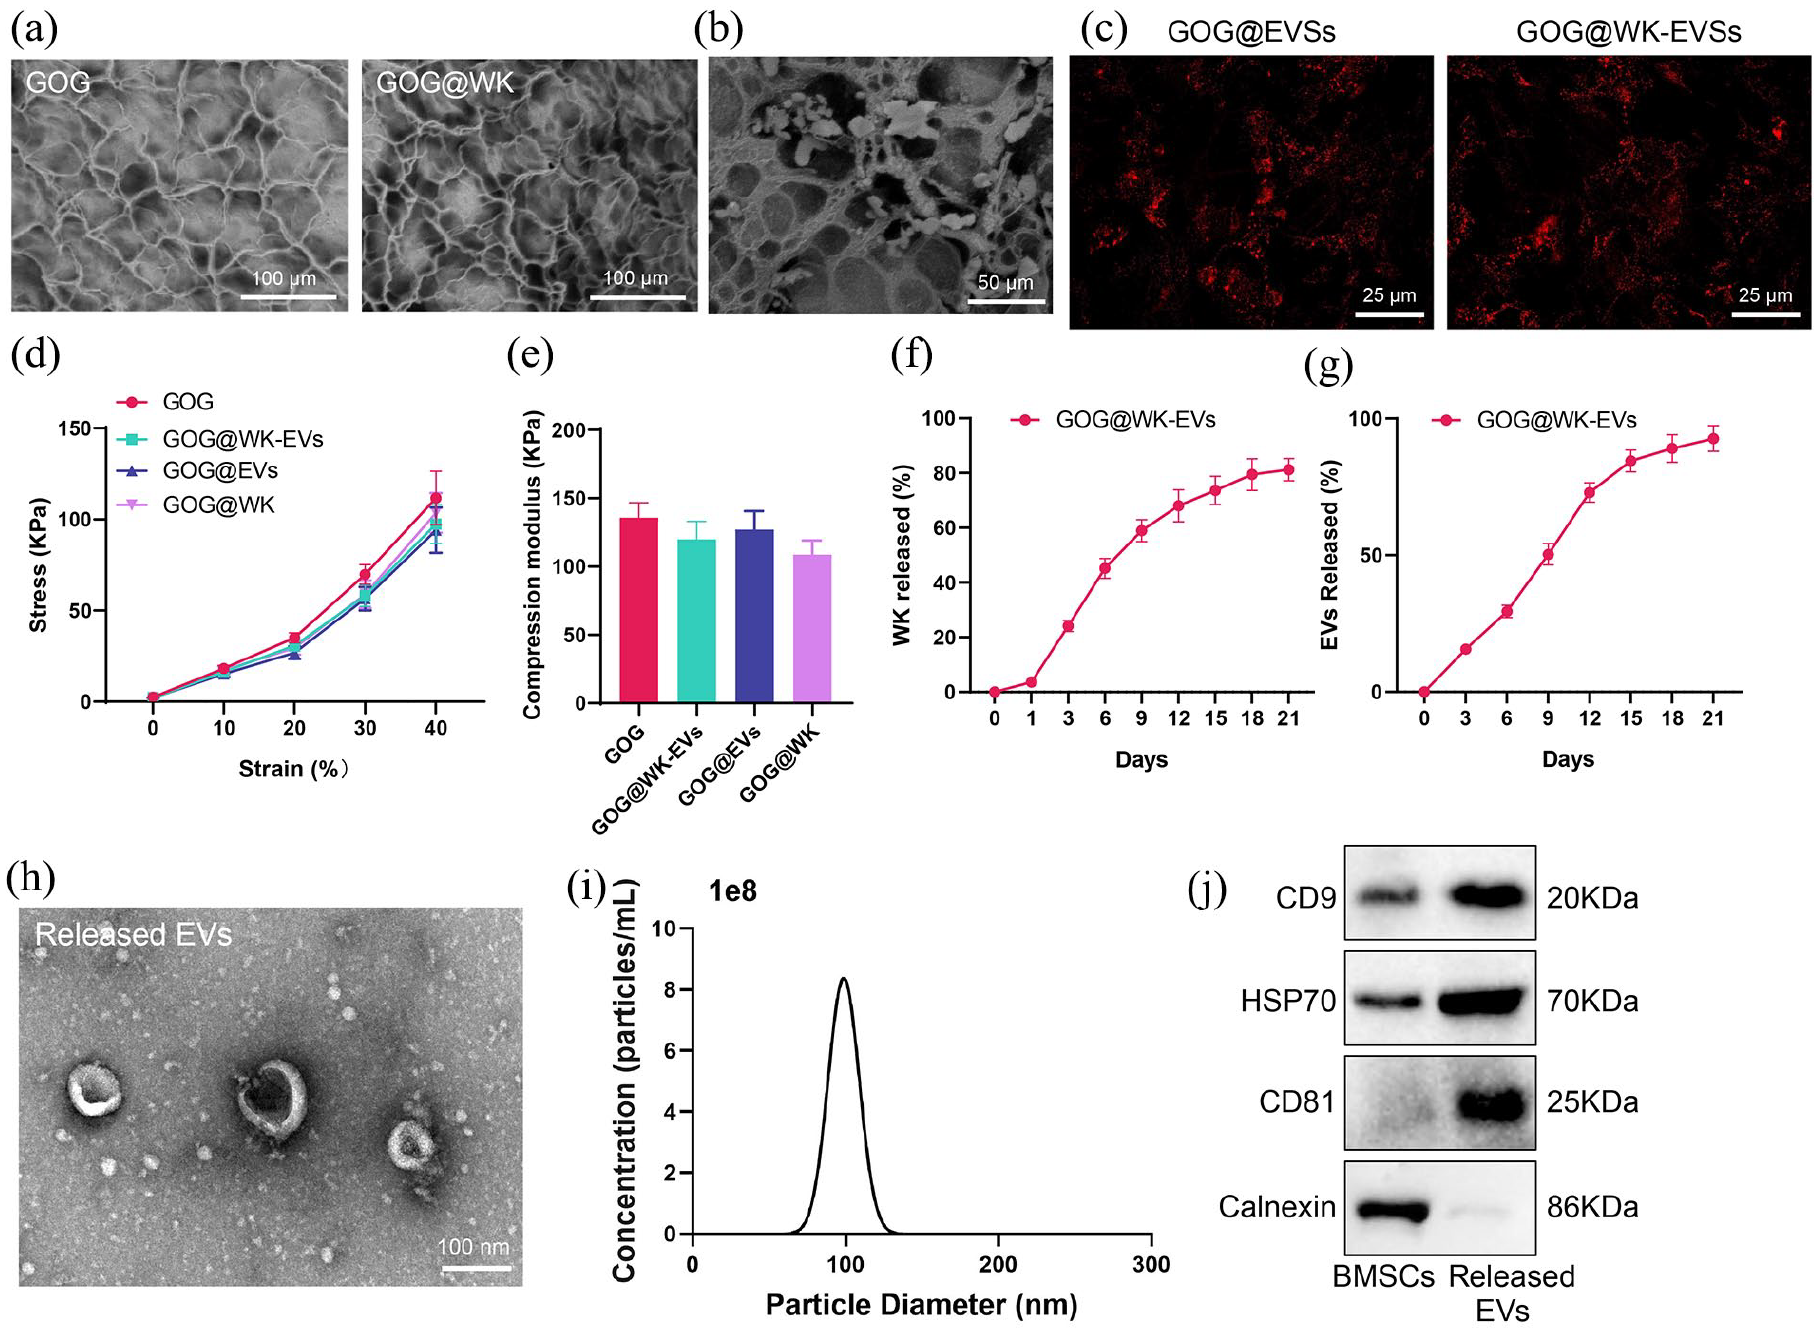
Characterization of GOG@WK-EVs.
Overall, these results demonstrate the successful preparation of the self-healing hydrogel GOG, the extraction of BMSC-derived EVs, and the loading of EVs and BPs WK into GOG hydrogel. The resulting GOG@WK-EVs exhibited sustained release of EVs and WK in vitro while maintaining EVs’ activity.
GOG@WK-EVs exhibits excellent cell compatibility
To investigate the biocompatibility of GOG@WK-EVs, we assessed the in vitro cytotoxicity of GOG@WK-EVs. Initially, to directly observe cell viability, we separately incubated BMSCs, UVECs, and BMMs cells with GOG, GOG@EVs, GOG@WK, and GOG@WK-EVs at different time points (6, 12, 24, and 48 h), using PBS as the control group. Subsequently, we performed live/dead staining and MTT assay on BMSCs, UVECs, and BMMs cells. The results consistently demonstrated that cells on all hydrogel types exhibited high vitality, with minimal detection of dead cells (Figure 4(a), Supplemental Figure S2).

Toxic effects of GOG@WK-EVs on cells.
The survival and proliferation of BMSCs, UVECs, and BMMs were further evaluated using the CCK-8 assay. After culturing, the three cell types separately in hydrogels were assessed at 1, 3, 5, and 7 days of culture. As shown in Figure 4(b), the OD values of cells in all groups increased with time. Furthermore, starting from day 3, the OD values of cells in the hydrogel groups were significantly higher compared to the Control group. Among them, the GOG@WK-EVs group exhibited the highest increase, followed by GOG@EVs and GOG@WK groups, and then the GOG group. This indicates that the GOG hydrogel is non-toxic to BMSCs, UVECs, and BMMs and promotes proliferation.
To further validate the impact of GOG@WK-EVs on cell adhesion and spreading, after 24 h of culture, cells were stained for cytoskeleton and nucleus, and fluorescence microscopy observations revealed that cells spread well on the surface of GOG@WK-EVs hydrogels (Figure 4(c)).
GOG@WK-EVs can inhibit osteoclast formation
Research has shown that EVs and WK can inhibit osteoclast formation.8,12 Therefore, we further investigated the impact of EVs and WK loaded in GOG hydrogels on osteoclast formation. Osteoclasts are specialized cells formed by the fusion of mononuclear/macrophage hematopoietic precursor cells. In this study, we cultured BMMs in various hydrogel groups and induced their differentiation into osteoclasts using RANKL, with the PBS-treated group serving as the control.
Subsequent TRAPstaining results showed a significant reduction in TRAP-positive cells in GOG@EVs and GOG@WK groups compared to the GOG group; furthermore, the GOG@WK-EVs group exhibited a further significant decrease in TRAP-positive cells compared to the GOG@EVs and GOG@WK groups (Figure 5(a)). Since osteoclasts are multinucleated fused cells, we assessed the cytoskeleton of these cells in hydrogels using immunofluorescence staining. The results revealed a significant decrease in multinucleated osteoclasts in the GOG@EVs and GOG@WK groups compared to the GOG group and an even further reduction in osteoclasts in the GOG@WK-EVs group compared to the GOG@EVs and GOG@WK groups (Figure 5(b)).

Effects of GOG@WK-EVs on osteoclast formation.
Furthermore, we conducted RT-qPCR to measure the expression of osteoclast markers Cathepsin, Nfatc1, Mmp9, and Acp5. The results indicated that compared to the control group, there was no significant change in osteoclast marker expression in the GOG group. However, the expression of osteoclast markers was significantly decreased in the GOG@EVs and GOG@WK groups compared to the GOG group, with an even further reduction in osteoclast marker expression in the GOG@WK-EVs group compared to the GOG@EVs and GOG@WK groups (Figure 5C).
These results demonstrate that loading WK or EVs alone in GOG can inhibit osteoclast formation, and their combined loading enhances this ability even further.
GOG@WK-EVs promote osteogenic differentiation of BMSCs
During the bone formation process, BMSCs gradually differentiate into osteoblasts. Osteoblasts secrete collagen fibers around themselves, which promote calcium deposition on the collagen fibers, leading to further transformation into bone cells. 13 Studies have also demonstrated that EVs and WK can directly or indirectly enhance the osteogenic differentiation of BMSCs.14,15
To further investigate the impact of GOG co-loaded with WK and EVs on the osteogenic differentiation of BMSCs, we cultured BMSCs in different hydrogel groups and observed the effects of each treatment on osteogenic differentiation, with the PBS-treated group serving as the control. Initially, by performing ALP and ARS staining on the 7th and 21st day of inducing BMSCs osteogenic differentiation, the results indicated that compared to the control group, there were no significant changes in ALP and ARS staining in the GOG group. In contrast, the GOG@EVs and GOG@WK groups exhibited significantly enhanced ALP and ARS staining compared to the GOG group, suggesting a substantial promotion of BMSCs osteogenic differentiation by GOG@EVs and GOG@WK. Furthermore, the GOG@WK-EVs group showed a significantly further improvement in BMSCs osteogenic differentiation compared to the GOG@EVs and GOG@WK groups (Figure 6A and B).

Impact of GOG@WK-EVs on the Osteogenic Differentiation of BMSCs.
Subsequently, the expression levels of osteogenic differentiation markers, including Runx2, Osterix, Alpl, Opn, and Ocn in BMSCs, were assessed by RT-qPCR and Western blot. The results indicated that compared to the control group, there were no significant changes in marker expression levels in the GOG group. Conversely, the GOG@EVs and GOG@WK groups showed a notable increase in the expression levels of osteogenic differentiation markers in BMSCs compared to the GOG group. Additionally, the GOG@WK-EVs group exhibited a further significant increase in the expression levels of osteogenic differentiation markers compared to the GOG@EVs and GOG@WK groups (Figure 6(c and d)).
Overall, these findings demonstrate that GOG significantly promotes the osteogenic differentiation of BMSCs after loading with WK and EVs.
Stimulation of vascular formation in UVECs by GOG@WK-EVs
Angiogenesis is closely associated with osteogenesis; an adequate vascular network is essential to promote the differentiation of BMSCs into osteoblasts. 16 Initially, the impact of GOG@WK-EVs on UVEC migration was assessed through Transwell and scratch assays, with the PBS-treated group serving as the control. The results revealed that compared to the control group, there was no significant change in the migration ability of UVECs in the GOG group. However, the migration ability of UVECs was significantly enhanced in the GOG@EVs and GOG@WK groups compared to the GOG group. Furthermore, the migration ability of UVECs was further enhanced in the GOG@WK-EVs group compared to the GOG@EVs and GOG@WK groups (Figure 7(a and b)).

Impact of GOG@WK-EVs on vascular formation in UVECs.
Subsequently, UVECs cultured in GOG@WK-EVs hydrogels underwent further assessment of their tube formation capacity. As shown in Figure 7(c) and (e), compared to the control group, there was no significant change in the branch points and total length of UVECs cultured in GOG hydrogels. In contrast, when cultured in GOG@WK and GOG@WK-EVs hydrogels, the branch points (Figure 7(d)) and total length (Figure 7(e)) of UVECs forming tubes on the gel surface significantly increased, with a complete tubular mesh structure observed (Figure 7(c)). Moreover, the tube formation capacity of UVECs was further enhanced when cultured in GOG@WK-EVs hydrogels.
RT-qPCR evaluated key factors (Ang, Pecam1, and Vcam1) involved in the vascular formation process. The results demonstrated that compared to the GOG group, these vascular formation key factors’ expression levels significantly increased in the GOG@EVs and GOG@WK groups. Furthermore, the expression levels of these key factors significantly increased in the GOG@WK-EVs group compared to the GOG@EVs and GOG@WK groups (Figure 7(f)).
The findings indicate that culturing UVECs in GOG@WK-EVs hydrogels significantly promotes vascular formation in UVECs.
GOG@WK-EVs promotion of bone regeneration in rat femoral bone defects through regulation of osteoclastic formation, osteogenic differentiation, and vascular formation
Subsequently, following the establishment of a femoral bone defect rat model, GOG@WK-EVs were implanted at the defect site and photoactivated to form a secondary network to observe the bone regeneration capability of GOG@WK-EVs, with the sham surgery group serving as the control. At the eighth week post-hydrogel implantation, the femurs were retrieved. Figure 8(a) demonstrates minimal difference between the Control group and the GOG group, whereas compared to the GOG group, a soft tissue layer covered the bone surface in the other groups. Likewise, X-ray results showed that in the Control and GOG groups, the bone defects remained large, while in the GOG@EVs and GOG@WK groups of rats, the bone porosity significantly decreased, with almost complete healing observed at the site of the bone defects in the GOG@WK-EVs group (Figure 8(b)). Micro-CT imaging of new bone tissue formation at the rat femoral bone defect sites revealed that the Control and GOG group rats only formed a small amount of new bone in the defect area, whereas in the GOG@EVs and GOG@WK group rats, there was a significant increase in new bone formation, particularly pronounced in the GOG@WK-EVs group (Figure 8(c)). The quantitative analysis of bone volume fraction (BV/TV), BMC, and BMD in Figures 8D–F were consistent with Figure 8C, clearly indicating a significant increase in new bone formation in the rats of the GOG@WK-EVs group.

The impact of GOG@WK-EVs on bone regeneration in rat bone defects.
Furthermore, each group’s new bone formation was confirmed through H&E and Masson’s trichrome staining. The results indicated that the bone defect area in the Control and GOG group rats contained a large amount of fibrous connective tissue, while in the GOG@EVs and GOG@WK group rats, the bone defect areas were almost filled, with new bone tissue tightly integrated, forming a honeycomb pattern. A substantial number of mature blood vessels and a small amount of new bone were observed. In contrast, in the rats of the GOG@WK-EVs group in the bone defect area, besides the presence of numerous osteoblasts and abundant ECM, there was evidence of thick and regular new bone tissue filled with numerous new blood vessels surrounded by a significant number of mature bone cells (Figure 8(g) and (h)).
To further validate the role of GOG@WK-EVs in vivo in regulating Osteoclastic formation, Osteogenic differentiation, and Vascular formation, IHC staining was conducted to assess the expression of respective markers. The results showed a significant increase in the expression of Osteogenic differentiation marker OPN and vascular formation marker PECAM1 in the GOG@EVs and GOG@WK groups compared to the Control and GOG groups, along with a notable decrease in the expression of the Osteoclastic formation marker TRAP. Moreover, the expression of these markers was more pronounced in the GOG@WK-EVs group compared to the GOG@EVs and GOG@WK groups (Figure 9(a)–(c)). The TRAP staining results were consistent with the IHC staining findings (Figure 9(d)).

Immunohistochemical staining for osteogenic differentiation markers at femoral defect sites in each group of rats.
These results suggest that GOG@WK-EVs may promote bone regeneration in rat femoral bone defects by inhibiting Osteoclastic formation, facilitating Osteogenic differentiation, and stimulating Vascular formation.
Discussion
This study presents a novel GOG@WK-EVs hydrogel system, co-loaded with bone marrow mesenchymal stem cell-derived EVs and the biomimetic peptide WK, demonstrating significant potential for bone regeneration. The GOG@WK-EVs hydrogel showed strong effects in promoting osteogenic differentiation, enhancing angiogenesis, and inhibiting osteoclast activity, providing a synergistic strategy to improve bone repair outcomes. This multifunctional approach supports bone regeneration by addressing multiple key processes involved in bone remodeling, positioning our study within the broader context of bone tissue engineering and regenerative medicine.
The rationale for co-loading EVs and WK into the GOG hydrogel lies in their complementary mechanisms of action. EVs, derived from BMSCs, are rich in bioactive molecules, such as proteins, mRNAs, and miRNAs, which play key roles in promoting osteogenic differentiation and angiogenesis.17,18 WK, a biomimetic peptide, activates signaling pathways that regulate osteogenesis and vascularization, enhancing the repair process.15,19 Co-delivery of EVs and WK within a hydrogel matrix ensures sustained, localized release at the bone defect site, providing prolonged bioactivity and reducing rapid dispersion seen with direct injections. This combination optimally supports osteogenesis, angiogenesis, and osteoclast inhibition, creating a microenvironment conducive to effective bone regeneration.
Compared to other advanced strategies in bone repair, such as growth factor delivery, gene therapy, and cell-based approaches, the GOG@WK-EVs hydrogel demonstrates several distinct advantages. Growth factor delivery often requires repeated administrations to maintain therapeutic levels, which can increase the risk of ectopic bone formation.20,21 In contrast, our hydrogel’s controlled, sustained release of EVs and WK reduces the need for repeated dosing and minimizes adverse effects. Gene therapy, although promising, encounters challenges related to delivery, safety, and long-term stability, which our hydrogel-based system circumvents by providing bioactive molecules in a stable scaffold. Additionally, cell-based therapies face risks like immune rejection and post-transplantation viability issues. By delivering cellular signaling molecules instead of live cells,22,23 our approach avoids these complications, making it more suitable for clinical applications.
Our in vitro and in vivo experiments further support the hydrogel’s regenerative capabilities. In vitro, the GOG@WK-EVs hydrogel significantly promoted osteogenic differentiation of BMSCs, as indicated by increased ALP activity, ARS staining, and upregulation of osteogenic markers. It also enhanced angiogenic potential, as shown by increased UVEC migration and tube formation and the upregulation of angiogenic markers. Furthermore, the hydrogel showed strong inhibitory effects on osteoclast activity, which is crucial for balanced bone remodeling.24,25
In vivo experiments using a rat femoral defect model demonstrated the hydrogel’s effectiveness in bone regeneration, significantly improving BV/TV, BMC, and BMD, as confirmed by Micro-CT and histological analyses. The presence of organized collagen fibers and ossified tissue in the defect site suggests effective bone remodeling and maturation facilitated by the GOG@WK-EVs hydrogel. These findings align with previous studies highlighting the therapeutic potential of EV-loaded hydrogels for bone defect repair.
The mechanical properties of the GOG hydrogel, enhanced through self-healing and secondary network characteristics, ensure sufficient structural integrity for load-bearing applications, making it a suitable scaffold for bone regeneration in clinical settings. 26
Despite the promising results, certain limitations of this study should be addressed in future research. Further evaluation of the hydrogel’s long-term stability, degradation rates, and potential inflammatory responses in vivo is necessary. Additionally, while our findings suggest a synergistic effect between EVs and WK, the precise signaling pathways and molecular mechanisms require further exploration. Optimizing the hydrogel’s controlled release profile may also enhance its therapeutic efficacy for complex bone defects that require extended healing periods.
In conclusion, the GOG@WK-EVs hydrogel presents a multifunctional, innovative approach for bone repair, achieving osteogenesis, angiogenesis, and osteoclast inhibition within a single scaffold. This study underscores the potential of self-healing hydrogels in bone tissue engineering and supports GOG@WK-EVs as a promising therapeutic material for clinical bone defect repair applications (Figure 10).
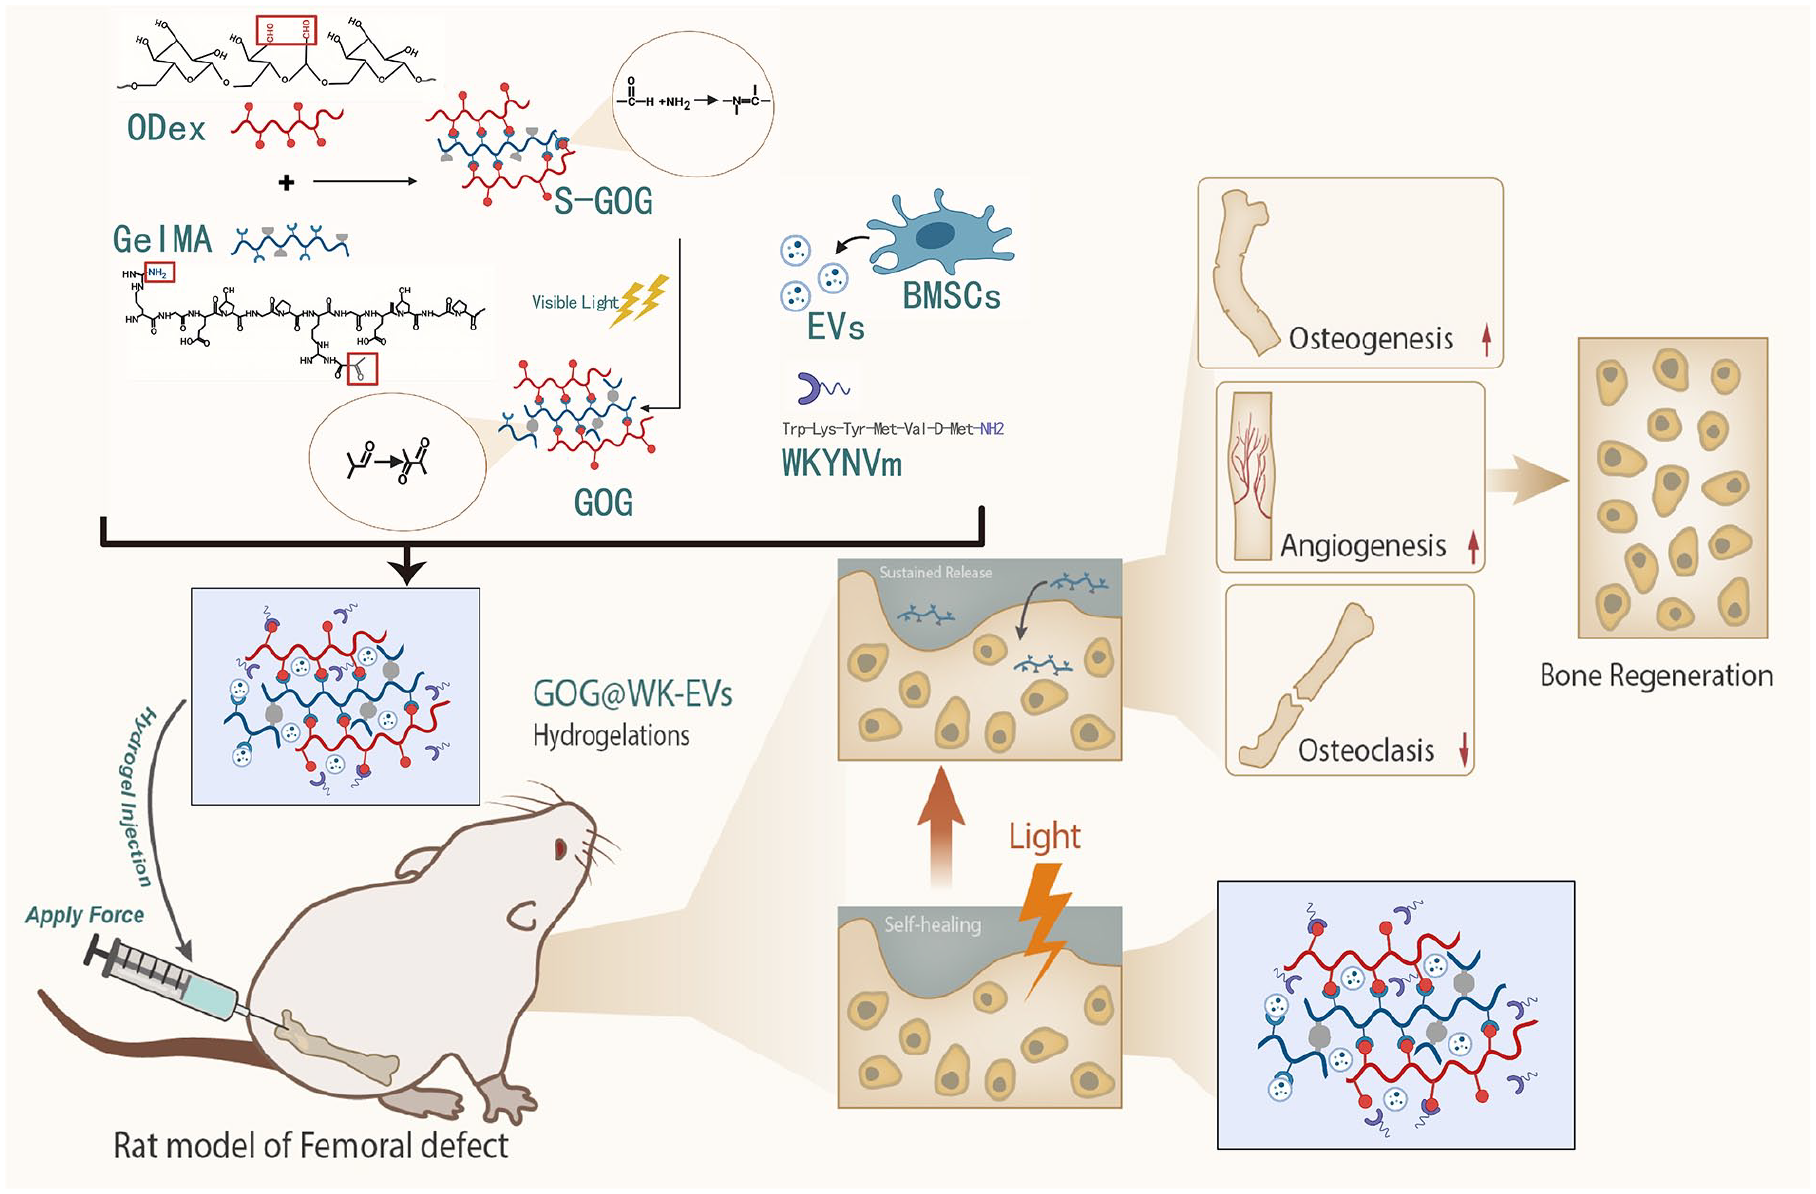
Mechanism diagram illustrating the effects of a novel self-healing hydrogel loaded with EVs and WK on the regulation of vascular formation and osteogenic differentiation in the repair of bone defects in rats.
Supplemental Material
sj-docx-1-tej-10.1177_20417314241306681 – Supplemental material for Harnessing bone marrow mesenchymal stem cell-derived extracellular vesicles and biomimetic peptide WKYMVm in self-healing hydrogel for enhanced bone repair in femoral defects
Supplemental material, sj-docx-1-tej-10.1177_20417314241306681 for Harnessing bone marrow mesenchymal stem cell-derived extracellular vesicles and biomimetic peptide WKYMVm in self-healing hydrogel for enhanced bone repair in femoral defects by Keyu Luo, Yufei Jin, Baiyi Liu, Yingbo Wang, Yaoyao Liu, Si Qiu, Jianhua Zhao and Xiang Yin in Journal of Tissue Engineering
Footnotes
Acknowledgements
None.
Author contributions
Keyu Luo, Yufei Jin, and Baiyi Liu conceived and designed the study. Yingbo Wang and Yaoyao Liu conducted the experiments, including hydrogel preparation and EVs and WK loading. Si Qiu and Jianhua Zhao performed in vitro and in vivo analyses. Xiang Yin supervised the project and contributed to data interpretation. Keyu Luo, Yufei Jin, and Xiang Yin drafted the manuscript. All authors reviewed and approved the final manuscript.
Data availability
All data can be provided as needed.
Declaration of conflicting interests
The author(s) declared no potential conflicts of interest with respect to the research, authorship, and/or publication of this article.
Funding
The author(s) disclosed receipt of the following financial support for the research, authorship, and/or publication of this article: This study was supported by National Natural Science foundation of China (82002308), the Talent Cultivation Project of Medical Scientific Innovation (ZXZYTSYS10), and the Talent Cultivation Project of Medical Scientific Innovation (2019CXJSC012).
Ethics approval and consent to participate
Laboratory Animal Welfare and Ethics Committee of the Army Medical University approved all animal experiments (AMUWEC20237046), and all animal experiments in this study were in accordance with local principles for the management and use of laboratory animals.
Supplemental material
Supplemental material for this article is available online.
References
Supplementary Material
Please find the following supplemental material available below.
For Open Access articles published under a Creative Commons License, all supplemental material carries the same license as the article it is associated with.
For non-Open Access articles published, all supplemental material carries a non-exclusive license, and permission requests for re-use of supplemental material or any part of supplemental material shall be sent directly to the copyright owner as specified in the copyright notice associated with the article.