
Abstract
The N-terminus of parathyroid hormone–related protein regulates bone marrow stromal cell differentiation. We hypothesized that the nuclear localization sequence and C-terminus are involved. MicroRNA and gene expression analyses were performed on bone marrow stromal cells from mice lacking the nuclear localization sequence and C-terminus (PthrpΔ/Δ) and age-matched controls. Differentiation assays with microRNA, cytochemical/histologic/morphologic, protein, and gene expression analyses were performed. PthrpΔ/Δ bone marrow stromal cells are anti-osteochondrogenic, pro-adipogenic, and pro-myogenic, expressing more Klf4, Gsk-3β, Lif, Ct-1, and microRNA-434 but less β-catenin, Igf-1, Taz, Osm, and microRNA-22 (p ⩽ 0.024). PthrpΔ/Δ osteoblasts had less mineralization, osteocalcin, Runx2, Osx, Igf-1, and leptin (p ⩽ 0.029). PthrpΔ/Δ produced more adipocytes, Pparγ, and aP2, but less Lpl (p ⩽ 0.042). PthrpΔ/Δ cartilage pellets were smaller with less Sox9 and Pth1r, but greater Col2a1 (p ⩽ 0.024). PthrpΔ/Δ produced more myocytes, Des, and Myog (p ⩽ 0.021). MicroRNA changes supported these findings. In conclusion, the nuclear localization sequence and C-terminus are pro-osteochondrogenic, anti-adipogenic, and anti-myogenic.
Keywords
Introduction
Parathyroid hormone–related protein (PTHrP) is a pleiotropic hormone that is widely expressed during embryonic development and post-natal life. PTHrP plays a vital role in many physiologic processes, including the regulation of skeletal morphogenesis and post-natal bone mass.1,2 The main effects of PTHrP are attributed to its amino-terminus (N-terminus; amino acids 1–36), where it is equipotent with parathyroid hormone (PTH) at the common PTH/PTHrP receptor (PTH1R). While PTH functions primarily as an endocrine hormone in the bone and kidney, PTHrP is not normally present in circulation, acting primarily as a local regulator of cellular proliferation, differentiation, and survival. 3 In addition, unlike PTH, PTHrP has multiple additional functional domains, including a mid-region (amino acids 37–66), a nuclear localization sequence (NLS; 67–106), and a carboxy-terminus (C-terminus; 107–139).3,4 Post-translational processing produces a family of peptides containing one or more of these regions, contributing to the protein’s ability to function in an autocrine, paracrine, and intracrine manner. 3
The role of skeletal-derived PTHrP was first observed in the PTHrP knockout mouse, which had abnormal endochondral ossification, increased and premature ossification, chondrodysplastic dwarfism, and neonatal lethality. 1 It was revealed that PTHrP is an endogenous skeletal anabolic agent and regulator of longitudinal bone growth by controlling growth plate chondrogenesis. The inability of PTH to complement or replace the skeletal role of PTHrP and the fact that overexpression of constitutively active PTH1R does not rescue all of the skeletal features of the PTHrP knockout mouse indicate that not all the functions of PTHrP are restricted to its N-terminal PTH-like domain. 5 To elucidate the functionality of additional domains of PTHrP in skeletal development, we created a mouse lacking the NLS and C-terminus, the PthrpΔ/Δ mouse. 4 Similar to the PTHrP knockout mouse, the PthrpΔ/Δ mouse is chondrodysplastic. However, unlike the PTHrP knockout mouse, which is characterized by abnormal endochondral ossification, increased and premature ossification, chondrodysplastic dwarfism, and neonatal lethality, the PthrpΔ/Δ mouse has reduced skeletal mineralization, decreased osteochondrogenesis, and survives longer into the perinatal period. This indicates that the NLS and C-terminus are required for skeletogenesis and survival. This also emphasizes (1) the skeletal importance of the intracrine function of PTHrP facilitated by its NLS, whereby the protein is not secreted and exerts intracellular effects completely independent of binding to cell surface PTH1R and/or (2) the ability of secreted PTHrP to function in a PTH1R-independent manner, potentially through yet-to-be-characterized receptor systems for the NLS and/or C-terminus.
Bone marrow stromal cells (BMSCs) are capable of differentiating into multiple mesenchymal lineages, including osteoblasts, adipocytes, chondrocytes, and myocytes. However, the mechanisms regulating lineage specification are not fully understood. Haploinsufficiency for PTHrP in mice results in decreased bone mass, decreased and abnormal growth plate chondrogenesis, and increased bone marrow adipogenesis by 3 months of age. 6 This indicates that PTHrP influences BMSC differentiation in a pro-osteogenic, pro-chondrogenic, and anti-adipogenic manner. It has since been demonstrated that the N-terminus of exogenous PTH and PTHrP promotes osteogenesis and chondrogenesis at the cost of adipogenesis.7,8 These effects contribute to the clinical bone-forming effects of N-terminal PTH and, to a lesser-investigated extent, PTHrP. On the other hand, the role of PTH and PTHrP in myogenic differentiation is unknown.
MicroRNAs (miRs) control gene and protein function by regulating existing messenger RNAs (mRNAs). Therefore, miRs can more rapidly affect gene and protein activity than traditional transcriptional regulation. Even though miRs regulate BMSC differentiation and their progeny, little information exists on the influence of PTHrP on miRs.9–15
Due to the fact that we have demonstrated (1) a decrease in the master transcriptional regulators of osteogenesis and chondrogenesis, Runx2 and Sox9, respectively, in the osteopenic and chondrodysplastic long bones of PthrpΔ/Δ mice in vivo and (2) pro-osteogenic effects of both the NLS and C-terminus of PTHrP that are distinct from those elicited by the N-terminus in pre-osteoblasts in vitro; we proposed that the skeletal phenotype of PthrpΔ/Δ mice may result, in part, by involvement of the NLS and C-terminus of PTHrP in regulating the multilineage differentiation of BMSCs.4,16 Based on (1) the pro-osteochondrogenic and anti-adipogenic effects of the N-terminus of PTHrP and (2) the pro-osteochondrogenic effects of the NLS and C-terminus, the purpose of this study was to investigate the role of the NLS and C-terminus of PTHrP in the multilineage differentiation of BMSCs.4,7,8,16 In addition, we defined the miR signatures in both unstimulated and differentiated BMSCs from PthrpΔ/Δ and control mice. We hypothesized that BMSCs from PthrpΔ/Δ mice would demonstrate decreased osteogenesis and chondrogenesis but enhanced adipogenesis and potentially increased myogenesis.
Materials and methods
Mice
PthrpΔ/Δ mice created by our laboratory by replacing exon 4 of PTHrP with an exon 4 lacking the sequence encoding PTHrP 67–137 (the NLS and C-terminus) were used. 4 Deletion of the NLS and C-terminus (PTHrP (67–137)) was confirmed by reverse transcription (RT)-polymerase chain reaction (PCR) demonstrating PTHrP 1–66 (PthrpΔ/Δ) mRNA in whole bone, skin, liver, kidney, lung, and placental extracts. The reading frame of PTHrP 1–66 was confirmed by sequencing. 4 Heterozygous and wild-type littermates served as controls. We have found no phenotypic or functional differences between neonatal heterozygous and wild-type mice (Toribio et al. 4 and unpublished results). All applicable institutional guidelines for the care and use of animals were followed and all experimentation was approved by the Institutional Animal Care and Use Committee (IACUC 2009A0162).
Isolation and propagation of BMSCs
At 3–5 days of age, PthrpΔ/Δ and control mice were euthanized in accordance with IACUC guidelines. Genomic DNA was isolated from tail tips and PCR genotyping performed using 5′-AGATCCACACAGCCGAAATCAGA-3′ (forward) and 5′-AGCCCTGCTGAACACAGTGAACA-3′ (reverse) primers. Long bone marrow cavities were flushed with standard growth medium (α-Minimum Essential Medium (MEM) with Glutamax™, 20% fetal bovine serum (FBS), 60 U/mL penicillin, and 60 µg/mL streptomycin (Invitrogen, Grand Island, NY, USA)) into T-25 flasks (BD Biosciences, San Jose, CA, USA). The medium was changed 5 days later and every 3–5 days until the adherent monolayer of BMSCs reached confluence. Cells were passaged with 0.25% trypsin (Invitrogen) into T-75 flasks. The medium was changed every 3 days until the adherent monolayer was confluent and passaged again prior to use. Fourth passage BMSCs were used for all experimentation. Previous studies have demonstrated that mouse and human third to fourth passage BMSCs have comparable purity as those obtained by flow cytometry or negative selection techniques.17–20
Osteo-, adipo-, chondro-, and myogenic differentiation
PthrpΔ/Δ and control BMSCs were plated at 400,000 cells/well in 12-well plates coated with 2.6 µg/cm2 fibronectin (BD Biosciences). Confluent cohorts were treated for 24 days with 2 mL of either (1) osteogenic media—standard growth medium (defined above), 10 nM dexamethasone (Sigma–Aldrich, Inc., St. Louis, MO, USA), 250 µM ascorbic acid (Thermo Fisher Scientific, Inc., Waltham, MA, USA), and 10 mM β-glycerophosphate (MP Biomedicals, Inc., Solon, OH, USA); (2) adipogenic media—standard growth medium, 1 µM dexamethasone, 0.01 mg/mL insulin, 0.5 mM 3-isobutyl-1-methylxanthine, and 0.2 mM indomethacin (Sigma–Aldrich); (3) chondrogenic media (StemXVivo™; R & D Systems, Inc., Minneapolis, MN) with 100 U/mL penicillin, and 100 µg/mL streptomycin (Invitrogen); or (4) myogenic media—Dulbecco’s Modified Eagle Medium (DMEM) with Glutamax™, 10% FBS, 1% glucose, 60 U/mL penicillin, and 60 µg/mL streptomycin (Invitrogen). Myogenic medium was supplemented with 5 µM of 5-azacytidine (Sigma–Aldrich) for 24 h once every 6 days. Culture medium was collected and frozen at −80°C every 3 days and fresh differentiation medium applied.
Cytochemical assessment of osteogenesis
Osteogenesis was assessed by von Kossa staining and quantifying the area of mineralization. After 24 days, four to five replicates from each genotype were fixed with 95% ethanol for 15 min. The wells were then treated sequentially with 5% silver nitrate (Sigma–Aldrich) for 20 min in the dark and 0.5% hydroquinone (Acros Organics, Geel, Belgium) for 5 min under ultraviolet light, rinsing with sterile water before and after each step. The wells were then treated with 5% sodium thiosulfate (Thermo Fisher Scientific). Stained wells were imaged with a 12.5-megapixel resolution 16-bit digital camera (Model D2X; Nikon Instruments Inc., Melville, NY, USA). The area of mineralization (mm2) was calculated from the automated tracings of the von Kossa–stained regions in the central 80% of each well (Image-Pro Plus v9.1; Media Cybernetics, Inc., Rockville, MD, USA).
Cytochemical assessment of adipogenesis
Adipogenesis was assessed by Oil Red O staining of adipocytes. After 24 days, four replicates from each genotype were fixed for 30 min with a 3.7% formaldehyde in phosphate-buffered saline (PBS) solution, pH = 7.4. The wells were then stained for 20 min with 1.3 mg/mL Oil Red O (Sigma–Aldrich) in 55% 2-propanol, rinsing with sterile water before and after each step. Adipocyte counts at 200× magnification in five random fields/well were averaged for an adipocyte count/high-powered field (hpf) for each well (Image-Pro Plus).
Morphometric, histologic, and immunohistochemical analyses of chondrogenesis
Chondrogenesis was assessed by the following:
Morphometric assessment of chondrogenesis—a cartilage pellet culture system was employed using BMSCs and the commercially available chondrogenesis differentiation media described above (StemXVivo™ R & D Systems), adhering to the manufacturer’s instructions. The exact components present in this chondrogenesis differentiation media are proprietary (personal communication with the manufacturer’s technical support). PthrpΔ/Δ and control BMSCs were seeded in quadruplicate at 250,000 cells/well in 15-mL conical tubes containing 500 µL of chondrogenic medium. Cells were pelleted at 500 rcf for 5 min and treated with chondrogenic medium for 24 days, changing the media every 3 days. Cartilage pellets were then imaged at 90° using a digital camera (Nikon) and volumes calculated from the average radius calculated from orthogonal views (Image-Pro Plus).
Histologic and immunohistochemical (IHC) evaluation of chondrogenesis—four cartilage pellets for each genotype were formalin-fixed, embedded in paraffin, sectioned, and stained with (1) hematoxylin and eosin (H & E), (2) alcian blue (for glycosaminoglycans), and (3) a commercially available type II collagen staining kit (Chondrex, Inc., Redmond, WA, USA) (to demonstrate type II collagen). Alcian blue staining was performed by treating the slides with a 1% alcian blue in 3% acetic acid solution, pH = 2.5, for 30 min. Slides were then rinsed with water and counterstained briefly with eosin. Type II collagen staining was performed as recommended by the manufacturer except for with the primary antibody we used (1) an overnight incubation and (2) a 1:50 antibody dilution based on our preliminary antibody optimization. Type II collagen IHC slides were then briefly counterstained with hematoxylin. Negative controls processed in parallel consisted of (1) cartilage pellets stained only with hematoxylin and (2) neonatal age-matched mouse skeletal muscle stained with both hematoxylin and anti-type II collagen antibody. The articular surfaces of neonatal age-matched mouse vertebral endplates served as positive controls for type II collagen IHC. Histologic descriptions for both PthrpΔ/Δ and control cartilage pellets were generated.
Cytochemical and flow cytometric analyses of myogenesis
Myogenesis was assessed by the following:
Cytochemical analysis of myogenesis—myogenesis was confirmed by cytochemical staining for the muscle-specific protein desmin. PthrpΔ/Δ and control BMSCs were plated in quadruplicate at 400,000 cells/well in two-well fibronectin-coated chamber slides (Nunc™ Lab-Tek™ Chamber Slide System; Thermo Fisher Scientific). After 24 days of myogenesis, cells were formalin-fixed and stained with a 1:100 dilution of a polyclonal goat anti-human/mouse desmin biotinylated antibody (R&D Systems). Desmin-positive myocytes were quantified at 400× magnification. Eight random fields per well were averaged within each well to give a myocyte count per hpf for each well (Image-Pro Plus). Antibody specificity was verified by a positive Western blot and IHC on mouse skeletal muscle and a negative Western blot and IHC on mouse calvarial MC3T3-E1 pre-osteoblasts (data not shown).
Intracellular anti-desmin flow cytometry—cells in four wells from each genotype from the 12-well plates were lifted with 0.25% trypsin (Invitrogen) at baseline and after 24 days of myogenic differentiation. Cells were (1) fixed and permeabilized using the Cytofix/Cytoperm Kit (BD Biosciences) and (2) labeled intracellularly with a 1:150 dilution of anti-desmin antibody and a 1:800 dilution of streptavidin–allophycocyanin. Desmin-positive cells were quantified at 40,000 events/s (Accuri™ C6 Flow Cytometer; BD Biosciences). At baseline, the percentage of cells that were desmin-positive was measured. After 24 days of myogenic differentiation, the fold change in the number of desmin-positive cells when compared to baseline and the overall number of desmin-positive cells were calculated.
Gene expression analyses by quantitative real-time PCR
Total RNA was extracted with TRIzol (Invitrogen) and purified using the RNeasy® Mini Kit’s RNA cleanup protocol (Qiagen, Germantown, MD, USA). Complementary DNA (cDNA) was made using Superscript II reverse transcriptase (Invitrogen). Quantitative real-time PCR was performed by (1) denaturing at 94°C for 15 min and (2) denaturing, annealing, and elongation for 60 cycles of 94°C for 15 s, 57°C for 20 s, and 72°C for 10 s using SYBR Green mastermix (Qiagen) and the Lightcycler 480 Real-Time PCR system (Roche, Indianapolis, IN, USA). The three most stably expressed genes out of Ppia, Ubc, β-actin, and Hprt between genotypes at baseline and for each specific differentiation assay were used for normalization by geometric averaging. Ppia, Ubc, and β-actin were used at baseline and for osteogenic, adipogenic, and myogenic differentiation. Ppia, Ubc, and Hprt were used for chondrogenic differentiation. Symbols and primers for all genes are defined in Table 1. The mouse primer pairs used in this study were chosen from two to four different primer pairs designed for each particular gene. All primer pairs were designed using Primer-BLAST software (http://www.ncbi.nlm.nih.gov/tools/primer-blast). Primers were compared side-by-side using historical control mouse bone, fat, cartilage, or muscle tissue and the primer pair for each gene that had the best amplification and real-time PCR product melting characteristics was chosen. In order to confirm primer specificity, Real-time PCR products were verified by electrophoresis on a 2% agarose gel and ethidium bromide staining to confirm (1) a single amplification product and (2) an amplification product of the expected size. Real-time PCR product melting characteristics for each primer pair were similar between experimental PthrpΔ/Δ and control samples and historical control tissues (mouse bone, fat, cartilage, or muscle) (Table 1):
Assessment of BMSC lineage commitment genes at baseline—PthrpΔ/Δ and control BMSCs were plated in sextuplet in standard growth media at 400,000 cells/well in 12-well plates coated with 2.6 µg/cm2 fibronectin (Sigma–Aldrich). At confluence, the following lineage commitment regulatory genes were analyzed: Pthrp, Pth1r, Klf4, Zfp521, Lrp6, Gsk-3β, β-catenin, Igf-1, Taz, Osm, Lif, Ct-1, Pka, and Pkc.
Evaluation of lineage-specific genes after differentiation—after 24 days of growth in monolayer under distinct differentiation conditions in 12-well plates, the expression of the following genes was measured in –four to six replicates for both genotypes: (a) Osteogenesis: Runx2, Osx, EphB4, Igf-1, Leptin, Col1a2, Pthrp, Pth1r; (b) Chondrogenesis: Sox9, Agg, Col2a1, Pthrp, Pth1r; (c) Adipogenesis: Pparγ, C/ebpα, C/ebpβ, Adipsin, aP2, Lpl, Pthrp, Pth1r; (d) Myogenesis: Des, Myog, Pthrp, Pth1r.
Mouse-specific primers for real-time PCR quantification of gene expression.

PCR: polymerase chain reaction; SD: standard deviation.
Gene names, gene symbols, and sequences for both the forward and reverse primers are listed. The predicted product size for each specific primer pair was verified by gel electrophoresis. Historical control PCR products were the same size as predicted for the specific primer pair. The PCR product melting temperatures for our experimental PthrpΔ/Δ and control samples were similar to the historical control PCR products for each specific primer pair.
miR sequencing
miRs were sequenced for both genotypes at baseline (confluence) and after cells underwent differentiation. This was done to determine differentially regulated miRs that may influence lineage commitment, differentiation, and function. Total RNA from three to four biological replicates within each genotype were pooled, contributing equally to a total of 5 µg of total RNA. One of these pooled total RNA preparations was prepared for each genotype (PthrpΔ/Δ and control) for each of the osteo-, chondro-, adipo-, and myogenesis assays. Two independent pooled total RNA preparations were prepared as described above for each genotype from different cohorts of PthrpΔ/Δ and control mice at baseline (confluence) prior to differentiation, which allowed for direct statistical comparison (n = 2 total RNA preparations sequenced for each genotype at baseline). MiR libraries were generated using the NEBNext® Small RNA Library Prep Set for SOLiD (New England Biolabs, Ipswich, MA). Templated sequencing beads were produced via emulsion PCR with the EZ Bead system and sequenced with the SOLiD™ 5500 system (Applied Biosystems, Grand Island, NY, USA). In each sample, the total number of reads for each miR was normalized to the total number of reads for all the miRs and expressed as a number per million reads. MiRs with less than 500 reads were excluded. In the differentiation assays, the number of reads for each miR in PthrpΔ/Δ samples was divided by the number of reads for that particular miR in controls and expressed as a fold change. Since a cut-off for what is a biologically relevant fold change in miRs has not been established, we arbitrarily selected and only reported fold changes exceeding 2.5-fold for the differentiation assays.
Osteocalcin assay
Osteocalcin (OCN) concentrations were measured in six wells at days 12 and 24 in the osteogenesis assays (Mouse Osteocalcin EIA kit; Biomedical Technologies Inc., Stoughton, MA, USA) according to the manufacturer’s instructions. The OCN concentration for each well was normalized to the total amount of protein present in the same collected culture media sample.
Statistical analyses
The values are represented as mean ± 1 standard deviation. Lineage-specific cytochemical, morphometric, and flow cytometric indices, protein secretion, and real-time PCR ΔCT values were compared between genotypes with an unpaired t-test if normally distributed and of equal variance. Normally distributed data with unequal variances were compared with an unpaired t-test with Welch’s correction. Non-normally distributed data were compared with a Mann–Whitney rank sum test. Baseline miR data were compared with an unpaired t-test. Analyses were performed with significance defined at p < 0.05 (Prism v6.00; GraphPad Software, Inc., San Diego, CA, USA). Assessment at baseline and individual multilineage differentiation assays were performed two independent times using separate cohorts of PthrpΔ/Δ and control mice to ensure the reproducibility of the differentiation phenotypes reported.
Results
PthrpΔ/Δ BMSCs have changes in gene and miR expression that indicate an anti-osteogenic, anti-chondrogenic, pro-adipogenic, and pro-myogenic phenotype
PthrpΔ/Δ BMSCs expressed a significantly greater amount of Klf4, Pth1r, Zfp521, and Lrp6 (p ⩽ 0.002) as determined by real-time PCR; however, the expression of Gsk-3β was increased with a concurrent decrease in β-catenin (p ⩽ 0.024) (Table 2). PthrpΔ/Δ BMSCs expressed significantly less Igf-1, Taz, and Osm and increased Lif, Ct-1, and Pkc (p ⩽ 0.026). No differences were observed between genotypes for Pka and Pthrp (Table 2).
Expression of lineage commitment regulatory genes.
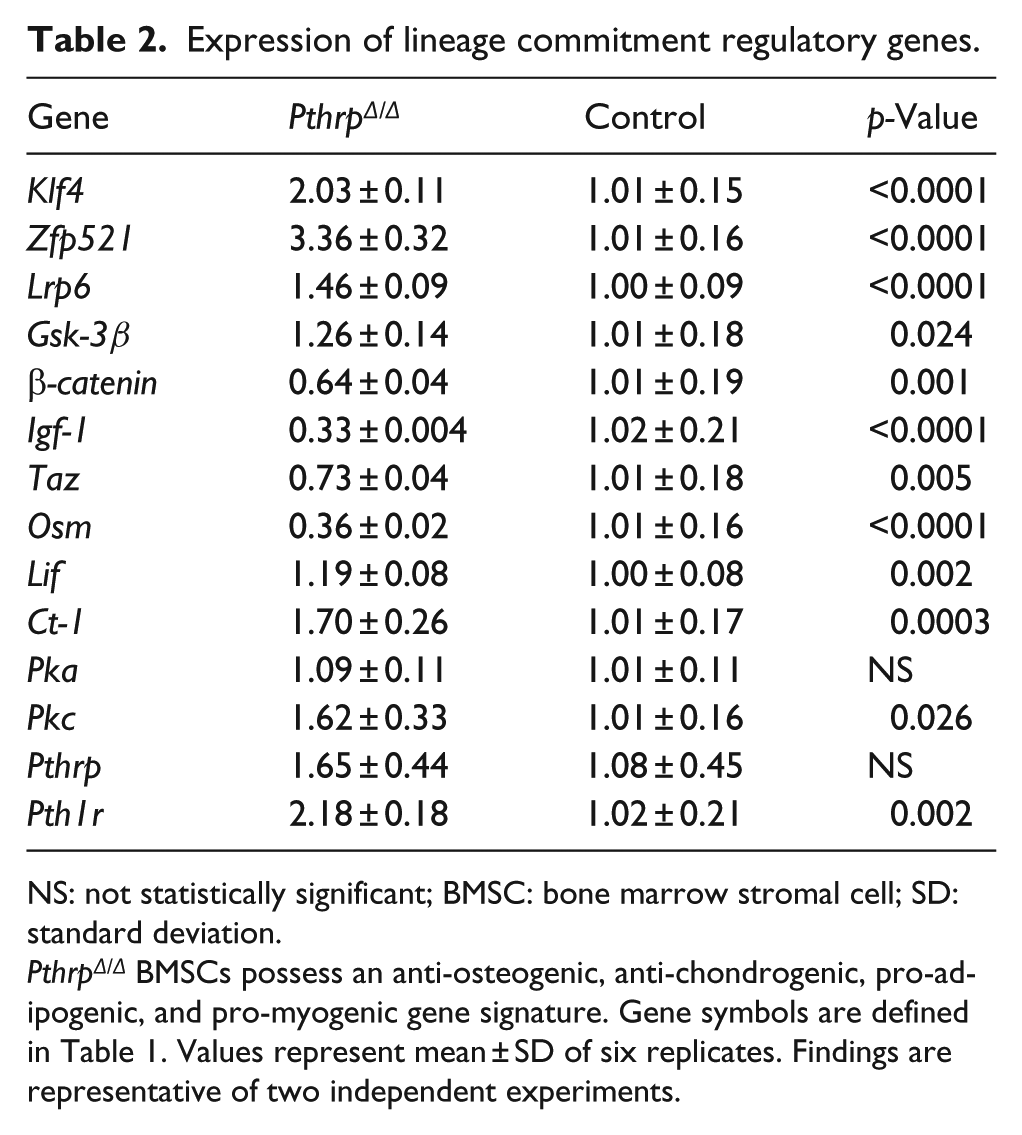
NS: not statistically significant; BMSC: bone marrow stromal cell; SD: standard deviation.
PthrpΔ/Δ BMSCs possess an anti-osteogenic, anti-chondrogenic, pro-adipogenic, and pro-myogenic gene signature. Gene symbols are defined in Table 1. Values represent mean ± SD of six replicates. Findings are representative of two independent experiments.
PthrpΔ/Δ BMSCs at baseline expressed significantly less miR-22 (p = 0.008) and greater miR-434 (p = 0.016) when compared to control BMSCs (Table 3). The effects of these miR differences in PthrpΔ/Δ BMSCs based on their known functions are decreased osteochondrogenesis and increased adipogenesis.21,22
Expression of lineage commitment regulatory miRs.

miR: microRNA; BMSC: bone marrow stromal cell; SD: standard deviation.
Similar to the gene expression analysis, PthrpΔ/Δ BMSCs possess an anti-osteogenic, anti-chondrogenic, pro-adipogenic, and pro-myogenic miR signature. Values represent mean ± SD of two replicates.
Osteoblasts derived from PthrpΔ/Δ BMSCs have decreased osteoblast maturation, function, and bone formation
PthrpΔ/Δ BMSC-derived osteoblasts secreted significantly less OCN (p ⩽ 0.029) and produced a significantly smaller area of mineralization at day 24 (p = 0.0004) when compared to osteoblasts differentiated from control BMSCs (Figure 1). The expressions of Runx2, Osx, Igf-1, and leptin were significantly decreased in PthrpΔ/Δ osteoblasts (p ⩽ 0.018). No differences in expression between genotypes were observed for Col1a2, EphB4, Pthrp, and Pth1r (Figure 1).
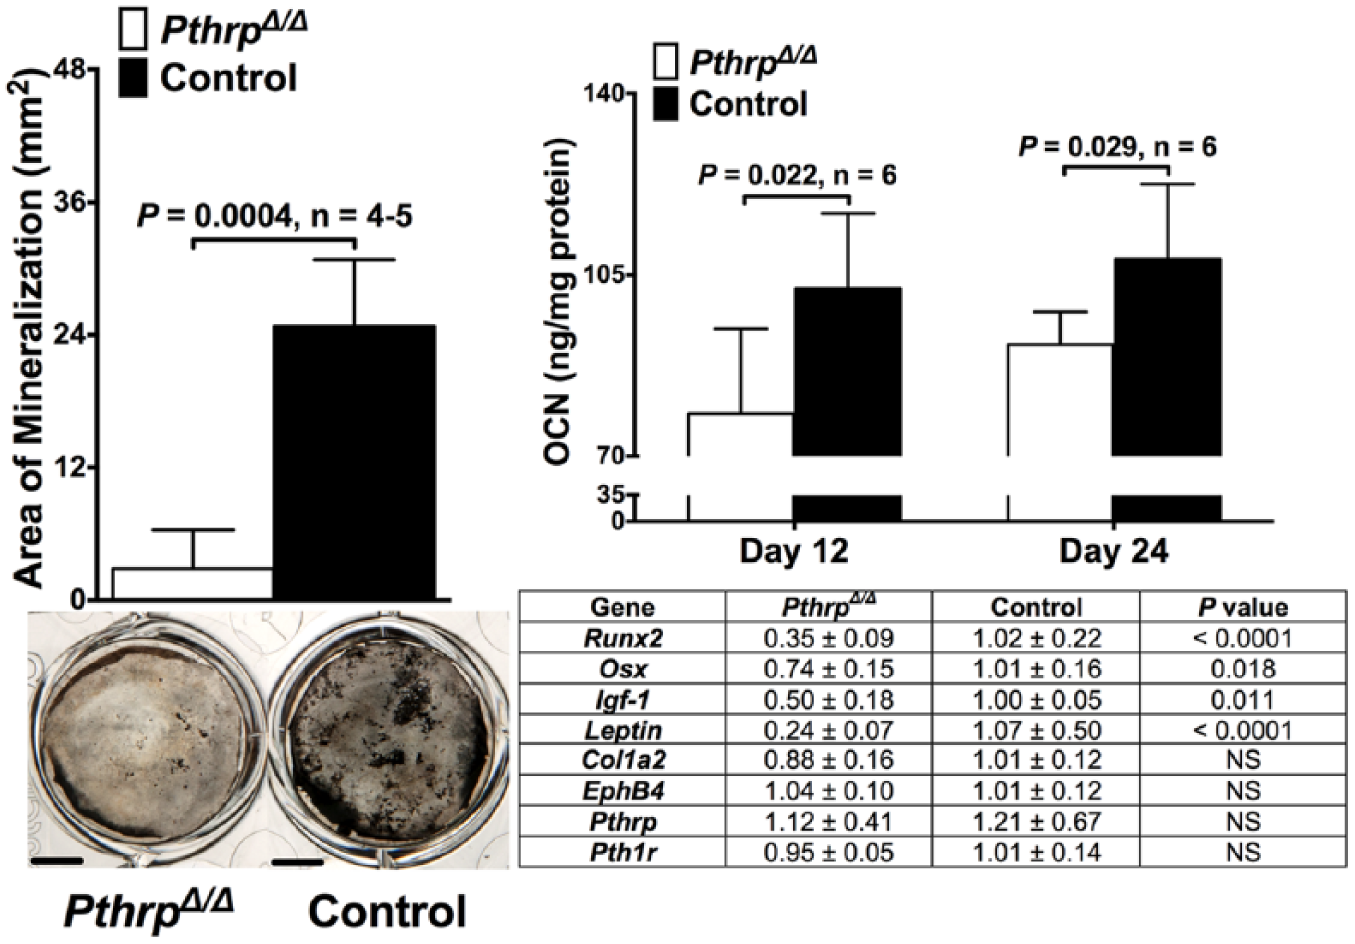
Area of mineralization, representative images of von Kossa–stained wells, OCN secretion, and the expression of osteogenesis genes in both PthrpΔ/Δ and control osteoblasts after BMSC differentiation. PthrpΔ/Δ osteoblasts have decreased osteoblast differentiation, maturation, function, and bone formation. Bars represent mean ± SD of four to five replicates for area of mineralization and six replicates for OCN secretion. Measurement bars equal 5 mm. Within the table, values represent mean ± SD of five to six replicates for gene expression analysis. For all figures, findings are representative of two independent experiments.
miR sequencing at day 24 revealed that PthrpΔ/Δ osteoblasts expressed a greater amount of miR-204 (+6.6-fold), 450a (+4.0-fold), 410 (+3.6 fold), 16-2 (+3.0-fold), 18a (+2.8-fold), 146b (+2.7-fold), 31 (+2.6-fold), and 19a (+2.5-fold) but a lesser amount of miR-223 (−2.5-fold) and 151 (−5.0-fold) when compared to control osteoblasts (Table 4). These miR findings are consistent with the inhibition of osteoblast differentiation, maturation, and function in PthrpΔ/Δ osteoblasts (Table 4).
miR sequencing of differentiation assays.

miR: microRNA.
The number of PthrpΔ/Δ and control reads per million miR reads for each miR are reported. Fold differences were calculated by dividing the number of PthrpΔ/Δ reads by the number of control reads for each miR. The predicted effect indicates what this fold difference for each miR should indicate in PthrpΔ/Δ osteoblasts, adipocytes, chondrocytes, and myocytes.
PthrpΔ/Δ BMSCs produced a greater number of adipocytes, but displayed abnormal lipid metabolism
PthrpΔ/Δ BMSCs produced a greater number of adipocytes that expressed more Pparγ and aP2, but less Lpl (p ⩽ 0.042) when compared to control BMSC-derived adipocytes (Figure 2). However, both genotypes expressed similarC/ebpα, C/ebpβ, adipsin, Pthrp, and Pth1r.

Adipocyte number, representative images of Oil Red O–stained adipocytes, and the expression of adipogenesis genes in both PthrpΔ/Δ and control adipocytes after BMSC differentiation. Despite a greater number of PthrpΔ/Δ adipocytes and increased expression of Pparγ and aP2, PthrpΔ/Δ adipocytes expressed less Lpl and similar levels of C/ebpα, C/ebpβ, and adipsin, suggesting dysregulated energy metabolism. Bars represent mean ± SD of four replicates for adipocyte number. Measurement bars represent 50 µm. Within the table, values represent mean ± SD of four replicates for gene expression analysis.
PthrpΔ/Δ adipocytes expressed greater amounts of miR-221 (+34-fold), 132 (+3.5-fold), 434 (+2.7-fold), and 222 (+2.5-fold) when compared to control adipocytes. Adipocytes derived from PthrpΔ/Δ BMSCs also expressed lower amounts of miR-210 (−2.5-fold), 30e (−2.5-fold), 19a (−2.5-fold), 17 (−3.3-fold), 20a (−3.3-fold), 101b (−3.3-fold), 106b (−3.3-fold), 27b (−5.0-fold), and 34c (−5.0-fold) when compared to those derived from control BMSCs (Table 4). This miR signature in PthrpΔ/Δ adipocytes is consistent with increased adipogenesis, but also reflects abnormalities in lipid metabolism (Table 4).
Chondrocytes differentiated from PthrpΔ/Δ BMSCs had decreased cartilage formation
Cartilage pellets grown from PthrpΔ/Δ BMSCs were significantly smaller than those grown from control BMSCs (p = 0.001) (Figure 3). Histologic and IHC analyses demonstrated chondrogenesis based on the pellets consisting of a population of round cells with both intra- and extracellular alcian blue and type II collagen staining. While PthrpΔ/Δ cartilage pellets had a smaller cross-sectional area and greater cell density, control pellets demonstrated a (1) lower cell density, (2) greater cross-sectional area, and (3) larger overall amount of extracellular matrix (ECM). PthrpΔ/Δ BMSC-derived chondrocytes expressed less Sox9 and Pth1r and a greater amount of Col2a1 (p ⩽ 0.024); however, they expressed similar levels of Pthrp and Agg as control chondrocytes (Figure 3).

Cartilage pellet volume, representative pellet, H&E, alcian blue, and anti-type II collagen-stained section images, and the expression of chondrogenesis genes in both PthrpΔ/Δ and control chondrocytes after BMSC differentiation. Despite a reduced (1) cartilage pellet volume, (2) cross-sectional area, and (3) amount of ECM in PthrpΔ/Δ cartilage pellets in the face of greater cell density, PthrpΔ/Δ chondrocytes expressed less Sox9 and Pth1r, similar levels of Pthrp and Agg, and a greater amount of Col2a1. These cumulative findings are indicative of decreased chondrogenic differentiation and defective cartilage formation. For the alcian blue–stained sections, blue staining indicates the presence of glycosaminoglycans. For the type II collagen–stained sections, brown staining indicates type II collagen. Bars represent mean ± SD of four replicates for pellet volumes. Measurement bars indicate 1 mm for photographed cartilage pellet images, 100 µm for the top row of the H&E-stained histologic images, and 25 µm for all other H&E-, alcian blue-, and type II collagen-stained histologic sections. Values represent mean ± SD of three to four replicates for gene expression analysis in the table.
Sequencing of the miR population in PthrpΔ/Δ chondrocytes demonstrated a marked increase in the anti-osteochondrogenic miR number 204 (+12-fold) and also an increase in 450a (+3.7-fold), 196a (+2.9-fold), 146b (+2.9-fold), 324 (+2.8-fold), 30e (+2.5-fold), and 140 (+2.5-fold) and decrease in miR-155, 221, let-7g, let-7f, and miR-15b (all −2.5-fold) when compared to control chondrocytes (Table 4). Differences in miRs in PthrpΔ/Δ chondrocytes indicate the inhibition of differentiation, similar to the morphometric and gene expression analyses (Table 4).
PthrpΔ/Δ BMSCs produced a greater number of myocytes, expressed higher levels of myogenic genes, and had an miR signature reflecting increased myogenesis
PthrpΔ/Δ BMSCs displayed significantly less desmin positivity at baseline when compared to control BMSCs by flow cytometric analysis (p = 0.001) (Figure 4). However, myogenic induction was significantly stronger in PthrpΔ/Δ BMSCs during myogenic differentiation for 24 days. This was evident in a significant increase in the fold change in desmin-positive cells over time in PthrpΔ/Δ cultures when compared to controls (16.8 vs 2.3-fold, p < 0.0001). This ultimately resulted in a greater number of desmin-positive PthrpΔ/Δ myocytes when compared to controls at day 24 when measured by flow cytometric analysis, a finding that was supported by anti-desmin cytochemistry (p < 0.0001) (Figure 4). PthrpΔ/Δ myocytes expressed a greater amount of both Des and Myog (p ⩽ 0.021), but similar levels of Pthrp and Pth1r when compared to controls (Figure 4).

Myocyte quantification by both anti-desmin cytochemistry and flow cytometry, representative images of desmin-positive cells and the expression of myogenic genes in both PthrpΔ/Δ and control myocytes after BMSC differentiation. Results showed increased myogenesis in the PthrpΔ/Δ group by cytochemistry, flow cytometry (both by the increase in fold change in the number of desmin-positive cells over time and ultimately the number of desmin-positive cells after 24 days of myogenic differentiation), and the expression of Des and Myog. Bars represent mean ± SD of four replicates for both myocyte cytochemistry and flow cytometry. Measurement bars denote 100 µm. Within the table, values represent mean ± SD of four replicates for gene expression analysis.
PthrpΔ/Δ myocytes expressed greater amounts of miR-155 (+3.7-fold), let-7e (+3.3-fold), and 99b (+3.1-fold), but a lower amount of miR-30a (−2.5-fold), 214-3 (−2.5-fold), 34b (−2.6-fold), 193b (−2.6-fold), 328 (−2.7-fold), and 34c (−4.0-fold) than control myocytes (Table 4). The miR signature in PthrpΔ/Δ myocytes indicates increased myocyte differentiation and survival (Table 4).
Discussion
BMSC differentiation requires the coordinated interaction of stage-specific regulatory and intrinsic genetic factors. However, the mechanisms controlling lineage specification are not fully understood. In this study, we demonstrated that BMSCs isolated from PthrpΔ/Δ mice have an anti-osteogenic, anti-chondrogenic, pro-adipogenic, and pro-myogenic phenotype. This same phenotype is also observed when PthrpΔ/Δ BMSCs were subjected to lineage-specific differentiation assays. These results indicate that the NLS and C-terminus of PTHrP are required for the proper multilineage differentiation of BMSCs.
PthrpΔ/Δ and control BMSCs and their differentiated osteoblasts, adipocytes, chondrocytes, and myocytes express similar levels of Pthrp. This is in accordance with our previously published observations that PthrpΔ/Δ and control mice have similar (1) plasma concentrations of PTHrP (<3 pM); (2) secretion of PTHrP from fibroblasts; (3) immunostaining for PTHrP in skin, fibroblasts, and respiratory epithelia; and (4) mRNA and protein levels of PTHrP in tibial metaphyses and calvaria. 4 We have also determined that the PTHrP concentration in the FBS used in all media in this study was <1 pM. This indicates that any differences between PthrpΔ/Δ and controls in this study resulted from PthrpΔ/Δ mice lacking the NLS and C-terminus of PTHrP and were not the result of (1) differences in PTHrP expression between genotypes or (2) exogenous PTHrP present within the FBS. PTH1R signaling activates two classic G-protein signaling cascades, the adenylate cyclase (AC) and phospholipase C (PLC) pathways. Stimulation of AC signaling leads to the activation of protein kinase A (PKA) and intracellular cyclic adenosine monophosphate (cAMP) accumulation. Increased PLC signaling leads to the activation of protein kinase C (PKC) and the increase in intracellular calcium. It has been previously demonstrated that PTHrP peptides of various length have indistinguishable biological effects on the activation of PTH1R, as long as there is an intact PTHrP 1-34 within the peptide. More specifically, the effects of N-terminal PTHrP 1-34, PTHrP 1-108, and full-length PTHrP 1-141 on AC and PLC signaling are equivalent, as noted in many studies by their equivalent biological effects in increasing (1) intracellular cAMP (AC/PKA pathway activation) and (2) intracellular calcium (PLC/PKC stimulation).23–28 However, administration of PTHrP analogs containing only the NLS or C-terminus has no effect on intracellular cAMP or calcium, indicating no effects on PTH1R signaling by the NLS or C-terminus of PTHrP.25,28 Considering this, the absence of a decrease in Pka and Pkc expression in PthrpΔ/Δ BMSCs, and historical data on the effects of different lengths of PTHrP on PTH1R signaling, we believe that our findings in PthrpΔ/Δ mice result from (1) the lack of the intracellular intracrine effects of the protein or (2) PTH1R-independent effects due to the absence of the NLS and C-terminus of PTHrP and are not due to differences in PTHrP expression, production, or decreased signaling through PTH1R.
PthrpΔ/Δ BMSCs have significantly higher Gsk-3β but lower β-catenin expression. Based on the known function of these genes in the regulation of BMSC differentiation by canonical Wnt/β-catenin signaling, this expression pattern of Gsk-3β and β-catenin could contribute to the decreased osteochondrogenesis and increased adipogenesis observed in PthrpΔ/Δ BMSCs. PthrpΔ/Δ BMSCs expressed less Taz than control BMSCs. TAZ activates Runx2 and inhibits Pparγ, increasing osteogenesis and decreasing adipogenesis. 29 Therefore, decreased Taz may contribute to the reduction in osteogenesis and increased adipogenesis observed in PthrpΔ/Δ BMSCs.
The expression of the gp130 cytokines OSM, CT-1, and LIF was also altered in PthrpΔ/Δ BMSCs. OSM is pro-osteogenic and anti-adipogenic through both its receptor and by indirectly increasing canonical Wnt/β-catenin signalling.30,31 We found decreased Osm in PthrpΔ/Δ BMSCs, supporting our phenotypic findings. CT-1 increases cardiomyocyte differentiation. 32 Therefore, increased Ct-1 expression supports PthrpΔ/Δ BMSCs’ pro-myogenic phenotype. We also found increased Lif expression in PthrpΔ/Δ BMSCs, consistent with its pro-adipogenic, pro-myogenic, and anti-osteogenic effects.33,34 Klf4 was also increased in PthrpΔ/Δ BMSCs, which increases adipogenesis and myogenesis.35,36
We found increased Pth1r and Lrp6 expression in PthrpΔ/Δ BMSCs. Increased Zfp521 in PthrpΔ/Δ BMSCs likely results from increased Pth1r and supports the decreased osteogenesis and increased chondrocyte proliferation with less maturation. This is due to Zfp521 acting downstream of PTH1R to antagonize Runx2, thereby sustaining chondrocyte proliferation. 37 Increased Pth1r and Lrp6 in PthrpΔ/Δ BMSCs may result from decreased Igf-1, an inhibitor of Pth1r. 38 Since IGF-1 is pro-osteochondrogenic and anti-adipogenic, decreased Igf-1 in PthrpΔ/Δ BMSCs may contribute to their abnormal differentiation phenotype. 39 Further work is needed based on these findings to determine whether the NLS and C-terminus of PTHrP may regulate PTH1R by influencing IGF-1.
MiR sequencing revealed an anti-osteogenic, anti-chondrogenic, pro-adipogenic, and pro-myogenic miR signature in PthrpΔ/Δ BMSCs, supporting our other findings. PthrpΔ/Δ BMSCs had significantly less miR-22 and greater miR-434 than control BMSCs. miR-22 overexpression increases osteogenesis and decreases adipogenesis in BMSCs. 21 Therefore, reduced miR-22 in PthrpΔ/Δ BMSCs is consistent with decreased osteogenesis and increased adipogenesis. miR-434 negatively regulates Stat3 in neural stem cells. 22 Stat3 is (1) activated by leptin, OSM, CT-1, and LIF and (2) essential for osteoblast and chondrocyte differentiation and function. Therefore, increased miR-434 supports our findings. We also showed increased expression of miR-30d and 199b with decreased miR-193b and 221 in PthrpΔ/Δ BMSCs, consistent with decreased osteochondrogenesis (miR-30d, 199b), increased adipogenesis (miR-30d, 199b, 221), and increased myogenesis (miR-193b).13,15,40,41
Osteoblasts derived from PthrpΔ/Δ BMSCs had significantly less mineralization area, Runx2, Osx, Igf-1, and leptin expression, and OCN secretion. Whereas Runx2 and Osx are transcriptional regulators essential for osteoblast differentiation, terminal maturation, and bone formation, OCN is highly expressed in mature osteoblasts, reflecting the degree of bone formation. Leptin, and as discussed previously with IGF-1, both enhance osteoblast differentiation at the expense of adipogenesis and regulate mature osteoblast function.39,42 These findings are consistent with the decreased differentiation, maturation, and function observed in PthrpΔ/Δ osteoblasts. These findings of decreased osteogenesis at the cytochemical and mRNA level in PthrpΔ/Δ BMSCs, which express PTHrP 1-66, are in accordance with a recent study that demonstrated decreased osteogenic differentiation in BMSCs isolated from mice with as not as severe truncation of the NLS and C-terminus of PTHrP (expresses PTHrP 1-84). 43
Myogenesis involves the induction of genes critical for differentiation, including myogenin, and muscle-specific genes, including desmin. PthrpΔ/Δ BMSCs also had increased expression of the pro-myogenic factors Klf4,Ct-1, and Lif and decreased canonical Wnt/β-catenin signaling, which increases myocyte differentiation.32,34,36,44 This pro-myogenic gene signature ultimately led to a greater number of PthrpΔ/Δ myocytes with increased Des and Myog. The pro-myogenic phenotype of PthrpΔ/Δ BMSCs is further supported by our flow cytometric data. This revealed that despite a significant decrease in the percentage of desmin-positive cells at baseline in PthrpΔ/Δ BMSCs when compared to control BMSCs, after 24 days of myogenic differentiation there was a robust increase in the number of desmin-positive cells in PthrpΔ/Δ cultures grown in parallel with control BMSCs (16.8 vs 2.3-fold, respectively). This resulted in a greater number of PthrpΔ/Δ myocytes than control myocytes after 24 days of differentiation, which was supported by anti-desmin cytochemical staining.
Chondrocytes derived from PthrpΔ/Δ BMSCs had less differentiation and formation, as observed in decreased Sox9 expression and cartilage pellet volume. Histologically, PthrpΔ/Δ cartilage pellets had a (1) greater cell number per area and (2) lesser amount of ECM per area when compared to control pellets. These findings demonstrate decreased ECM production by PthrpΔ/Δ chondrocytes. Despite both genotypes having similar levels of Agg expression, PthrpΔ/Δ chondrocytes expressed greater Col2a1. This increase in Col2a1 in PthrpΔ/Δ chondrocytes with a concurrent decrease in ECM production within PthrpΔ/Δ pellets indicates defective chondrogenesis. PthrpΔ/Δ chondrocytes also had decreased Pth1r expression. This finding is in contrast to PthrpΔ/Δ and control osteoblasts, adipocytes, and myocytes, which express similar levels of Pth1r. However, this reduction in Pth1r in PthrpΔ/Δ chondrocytes was similar to that observed in the largely cartilaginous embryonic skeletons of mice expressing a similar truncation of PTHrP, PTHrP 1-84, which also possess a chondrodysplastic phenotype. 45 These similarities of decreased Pth1r but similar Pthrp in cartilaginous tissues from both mouse models suggest that the absence of the NLS and C-terminus of PTHrP and decreased Pth1r in chondrocytes may both contribute to the decreased chondrogenesis in mice lacking the NLS and C-terminus of PTHrP. In summary, these cumulative findings are indicative of decreased chondrogenic differentiation in and defective cartilage formation by PthrpΔ/Δ BMSC-derived chondrocytes.
Measurement of miRs following differentiation revealed changes that paralleled the in vitro and in vivo phenotype of PthrpΔ/Δ cells and mice. Osteogenesis assays of PthrpΔ/Δ BMSCs yielded an miR signature predicting inhibited osteoblast differentiation, maturation, and function. Known targets of miR-204 and 18a, which were both upregulated in PthrpΔ/Δ osteoblasts, include Runx2 andIgf-1, respectively, which were both downregulated at the mRNA level in PthrpΔ/Δ osteoblasts.9,46,47 Osx negatively regulates miR-204. 9 Increased miR-204 with decreased Osx in PthrpΔ/Δ osteoblasts suggests that the NLS and C-terminus may regulate miR-204 through Osx. Therefore, the NLS and C-terminus of PTHrP regulate miRs important for osteoblast commitment, differentiation, and function. PthrpΔ/Δ adipocytes had an miR signature consistent with our findings of increased adipocyte differentiation due to upregulation of Pparγ (decreased miR-27b) and increased adipogenesis (decreased miR-34c).10,11 PthrpΔ/Δ adipocyte miR changes, most notably the increase in miR-221 and 132, were consistent with obesity, diabetes, and decreases in leptin.48,49 Similar to gene, morphometric, and histologic changes in PthrpΔ/Δ chondrogenesis assays, miR changes predicted inhibited differentiation and increased proliferation.9,14 Several identified miRs in PthrpΔ/Δ chondrocytes are linked to decreased osteoblast differentiation, maturation, and function. This is not surprising since many factors regulating chondrocyte differentiation also regulate osteoblast differentiation. The marked increase in miR-204 in PthrpΔ/Δ chondrocytes was consistent with findings in PthrpΔ/Δ osteoblasts and with miR-204 decreasing osteochondrogenesis. 9 Decreases in let-7 miRs are linked to reduced and abnormal growth plate chondrogenesis. 12 Further work is needed to determine whether the abnormal growth plate chondrogenesis and skeletal morphogenesis in PthrpΔ/Δ mice are due to a decrease in let-7 miRs resulting from the absence of the NLS and C-terminus of PTHrP. The changes in miRs in PthrpΔ/Δ myocytes predict increased myocyte differentiation and survival, consistent with our other findings.50,51
In addition to BMSC differentiation, a bone–fat connection exists. 52 Osteoblast-derived OCN stimulates insulin and adipokine production, fat reduction, and skeletal muscle to uptake glucose. 52 Adipocytes secrete adipokines such as leptin and adipsin. Pparγ transcriptionally controls adipogenesis, governing regulators of energy and lipid metabolism and insulin sensitivity such as Lpl and aP2. 53 Increased Pparγ, with no increase in adipsin and a decrease in Lpl in PthrpΔ/Δ adipocytes, suggests that the NLS and C-terminus of PTHrP are required for proper adipocyte function and regulate genes involved in metabolism. Consistent with our findings, an increase in Pparγ in the long bones of mice expressing only PTHrP 1-84, when compared to PTHrP 1-66, was recently reported. 43 Therefore, adipogenesis gene expression similarities, adipogenesis miR changes, and decreased leptin expression and OCN secretion in PthrpΔ/Δ osteoblasts, despite a greater number of PthrpΔ/Δ adipocytes, suggest dysregulated energy metabolism. This may contribute to the perinatal lethality in PthrpΔ/Δ mice. 4
In conclusion, the presence of an intact NLS and C-terminus of PTHrP is required for normal BMSC differentiation. Multiple genes, miRs, and signaling pathways central to the normal function of BMSCs and their progeny are altered following the deletion of the NLS and C-terminus of PTHrP. The creation of mice lacking each specific region of PTHrP, alone or in combination, and their comparison to the original PTHrP knockout mice, PTH1R knockout mice, and our PthrpΔ/Δ mice and age-matched controls would help to elucidate which region or regions of PTHrP have the greatest involvement in regulating BMSC differentiation. This is the first study to identify changes in miR expression following the modification of PTHrP, and more specifically, deletion of the NLS and C-terminus. Identification of factors regulating BMSC differentiation is of paramount importance for the development of treatment strategies for a variety of musculoskeletal and metabolic conditions. Targeting, overexpressing, or administration of the NLS and C-terminus of PTHrP in peptide form may be promising strategies to generate specific tissue types in the field of regenerative medicine.
Footnotes
Acknowledgements
The authors would like to thank Michael J. Fial for technical assistance with flow cytometry and Selen Yilmaz for technical assistance with microRNA sequencing. The conception and design of the work reported in this article was by B.E.H., T.J.R., and R.E.T. All authors were involved in data acquisition, analysis, and interpretation. B.E.H. wrote the article and it was then revised critically by all the authors. All authors approved the final version of the article to be published.
Declaration of conflicting interests
The author(s) declared no potential conflicts of interest with respect to the research, authorship, and/or publication of this article.
Funding
The author(s) disclosed receipt of the following financial support for the research, authorship, and/or publication of this article: This work was funded by the National Institutes of Health to Drs B.E.H. (F32 AR057597) and R.E.T. (K01 RR018924). B.E.H. was also supported by the Ohio State University College of Veterinary Medicine C. Glenn Barber Fund. The authors would like to thank Alan Flechtner in our Comparative Pathology and Mouse Phenotyping Core Facility (supported by NIH CCC Grant P30 CA016058) for histologic processing.