
Abstract
For bone marrow stromal cells (BMSC) to be useful in cartilage repair their propensity for hypertrophic differentiation must be overcome. A single day of TGF-β1 stimulation activates intrinsic signaling cascades in BMSCs which subsequently drives both chondrogenic and hypertrophic differentiation. TGF-β1 stimulation upregulates SP7, a transcription factor known to contribute to hypertrophic differentiation, and SP7 remains upregulated even if TGF-β1 is subsequently withdrawn from the chondrogenic induction medium. Herein, we stably transduced BMSCs to express an shRNA designed to silence SP7, and assess the capacity of SP7 silencing to mitigate hypertrophy. SP7 silencing dampened both hypertrophic and chondrogenic differentiation processes, resulting in diminished microtissue size, impaired glycosaminoglycan production and reduced chondrogenic and hypertrophic gene expression. Thus, while hypertrophic features were dampened by SP7 silencing, chondrogenic differentation was also compromised. We further investigated the role of SP7 in monolayer osteogenic and adipogenic cultures, finding that SP7 silencing dampened characteristic mineralization and lipid vacuole formation, respectively. Overall, SP7 silencing affects the trilineage differentiation of BMSCs, but is insufficient to decouple BMSC hypertrophy from chondrogenesis. These data highlight the challenge of promoting BMSC chondrogenesis whilst simultaneously reducing hypertrophy in cartilage tissue engineering strategies.
Keywords
Introduction
Bone marrow-derived stromal cells (BMSCs, sometimes referred to as mesenchymal stem cells) are an excellent cell source for cartilage tissue regeneration due to their abundant supply, ease of culture, and capacity to generate cartilage-like tissue. 1 However, BMSCs do not yield a stable chondrocyte-like cell, and instead these cells have a propensity to undergo hypertrophic differentiation, contributing to a mineralized tissue unsuitable for use in cartilage defect repair. Several strategies have been proposed to minimize or prevent BMSC hypertrophy, 2 but none have been widely replicated nor have these strategies yielded a viable clinical product. Recently, our group reported on the observation that BMSC respond to a single day of Transforming Growth Factor-β1 (TGF-β1) stimulation by engaging intrinsic signaling cascades which promote continued chondrogenic and hypertrophic differentiation even if TGF-β1 is subsequently removed from the medium. 3 Immediately following TGF-β1 stimulation, SP7 is upregulated, and it remains upregulated even if TGF-β1 is eliminated from the medium.
The SP7, also known as Osterix, gene codes for the zinc finger containing transcription factor SP7 (Osterix, Osx). In mesenchymal cells, SP7 plays a major role in bone formation. 4 When SP7 is knocked out in mice, skull bones formed by intramembranous ossification do not mineralize and some skeletal elements formed by endochondral ossification suffer delayed mineralization. 5 Postnatally, SP7 contributes to bone growth and homeostasis. 6 Knockout of SP7 resulted in interrupted osteocyte maturation, altered osteocyte morphology and function, and reduction of osteoclast size and density. 6
Our RNA-Seq data show that SP7 is not expressed in human adult chondrocytes. 3 Given that SP7 is a transcription factor that appears to play a critical role in bone development, and that SP7 expression is persistent in BMSCs following TGF-β1 stimulation, we reasoned that silencing SP7 may be an effective strategy to mitigate BMSC hypertrophy. Previous studies which suggest SP7 manipulation may enable control over hypertrophy include demonstration that siRNA SP7 knockdown in MLB13MYC clone 17 cells upregulated the chondrogenic markers Sox9, Col2, and downregulated osteogenic markers Col1, Alp and Bglap. 7 Silencing of SP7 in ATDC5 chondroprogenitor cells inhibited the Col10 expression, 8 while Sp7 over expression upregulated Col10, Mp13, Alp, and Ibsp. 9
The role of SP7 in the trilineage differentiation of BMSCs has not been previously demonstrated. The overall aim of this study was to determine if SP7 silencing was sufficient to prevent BMSC hypertrophy during chondrogenesis, as well as to determine how SP7 silencing influenced BMSC osteogenesis and adipogenesis. SP7 silencing was achieved by transducing BMSC to constitutively express a short hairpin RNA (shRNA) engineered to target the SP7 transcript. Transducing cells to express shRNA provides more stable control over the gene product than transfection with short interfering RNA (siRNA), 10 and this approach can minimize the deleterious effects often associated with complete gene knockout methods.11,12 BMSC osteogenesis and adipogenesis was assessed in monolayer cultures, using readouts that included staining for mineral accumulation or lipid vacuoles, respectively, as well as gene expression. BMSC chondrogenesis and hypertrophy was assessed using a microtissue model, and a high-throughput microtissue culture platform, the Microwell-mesh. 13 In previous work, 3 we demonstrated that microtissues, compared to larger diameter pellet cultures, yield more homogenous tissue and that microtissues are a better tool for hypothesis testing and bioprocess optimization. Cartilage-like microtissues were characterized using readouts including glycosaminoglycan (GAG) quantification, immunohistochemistry, and gene expression.
Materials and methods
BMSC isolation and expansion
BMSCs were isolated as described previously. 13 In brief, bone marrow aspirates were collected from consenting voluntary donors using protocols approved by the Mater Hospital Human Research Ethics Committee, and in accordance with the National Health and Medical Research Council of Australia guidelines (Ethics number: 1541A). Using Ficoll-Paque PLUS density gradient (GE Healthcare) centrifugation, mononuclear cells were enriched from 20 mL of bone marrow aspirate. The mononuclear cells were resuspended in low glucose Dulbecco’s Modified Eagle Medium (LG-DMEM), supplemented with 10% fetal bovine serum (FBS, ThermoFisher), 1% penicillin/streptomycin (PenStrep, Gibco), 10 ng/mL Fibroblast Growth Factor-1 (FGF-1, PeproTech), and 5 µg/mL Heparin (Sigma-Aldrich) as previously done in our laboratory. 13 The cells were distributed into five T175 flasks (Nunc) with 35 mL of growth medium in each flask, and placed into a humidified, normoxic incubator (20% O2, 5% CO2, and 37°C). On the following day, the medium was exchanged to enrich for adherent cells, and the cells were grown in a hypoxic incubator (2% O2, 5% CO2, and 37°C) for further expansion. Media exchange was performed every 2–3 days until 80% confluence, and then cells were sub-cultured at 2 × 10⁵ cells per new T175 flask. BMSC were used up to passage 3 in subsequent experiments. Three BMSC donor cell populations were used in this study: Donor 1 was a 44-year-old male, Donor 2 was a 21-year old female, Donor 3 was a 24-year old male.
Bacterial transformation and plasmid purification
A vial of One Shot® Stbl3™ chemically competent E. coli cells (Thermo Fisher Scientific) was used for each transformation. A shRNA construct containing the target sequence for the SP7 gene (AGGTGTATGGCAAGGCTTCGC ACCTGAAG) and a Scrambled Control were cloned in separate lentiviral GFP vectors with expression under the U6 promoter (pGFP-C-shLenti, Origene). Bacterial cells and plasmids were combined, incubated on ice, heat shocked at 42°C, and re-incubated on ice before inoculation in Luria Broth (LB) in a shaking incubator at 37°C. After the outgrowth step, transformants were screened by spread-plating 200 uL of suspension on Luria Agar plates with chloramphenicol (Sigma-Aldrich) (LA-C) and incubated at 37°C overnight. A single colony was streaked on LA-C plates and a purified colony was inoculated in 200 mL LB with chloramphenicol for overnight expansion in a shaking incubator at 37°C. Plasmids were isolated and purified using NucleoBond Xtra Midi Kit (Takara Bio) following the manufacturer’s protocol. Plasmid DNA concentration and purity were measured using a NanoDrop 1000 spectrophotometer (Thermo Fisher Scientific).
Lentiviral production
To generate second-generation lentiviral particles, the following plasmids were used: psPAX2 for packaging and PMD2.G for VSV-G envelope expression (both from Addgene) combined with the shRNA expression plasmid and transfected into HEK293 FT (Thermo Fisher) at a 1:6 ratio with polyethylenimine (PEI, 2 mg/mL) in Opti-MEM culture medium (Gibco). Medium was replaced after 18 h, and viral particles were harvested 48 h post-transfection. Viral particle containing supernatant was collected after centrifugation and concentrated using Lenti-X Concentrator (Takara Bio) following the manufacturer’s protocol. Viral titre was determined based on GFP expression using flow cytometry (BD LSR Fortessa X20).
BMSC transduction with lentivirus
BMSC transduction was performed following a protocol reported by Lin et al. with minor modifications. 14 In brief, BMSCs were seeded in 6-well plates (5 × 10⁴ cells/ well) and allowed to expand. Cell number was determined and transduced with an MOI of 10 with a final volume of 1 mL. Medium was replaced after 24 h, and cells were passaged upon confluence. Transduced cells were sorted based on GFP expression (BD Astrios Sorter) and then expanded in culture as described above. Only cells up to two passages post-sorting were used in the succeeding experiments. ScControl corresponds to BMSCs transduced with Scrambled Control-containing shRNA, while shRNA-SP7 corresponds to BMSCs transduced with shRNA specific for SP7 silencing. Wild-type (WT) corresponds to non-transduced BMSC controls.
Microwell-mesh fabrication and use
The Microwell-mesh is a high throughput microtissue culture platform, described previously. 13 Small diameter microtissues yield more homogenous tissue, relative to conventional pellet cultures,13,15 and the Microwell-mesh enables efficient culture of hundreds of uniform microtissues, in a manner ideal for studying BMSC chondrogenic differentiation.3,16 In brief, the Microwell-mesh base was fabricated from a sheet of polydimethylsiloxane (PDMS, SYLGARD™ 184 Silicone Elastomer Kit) which had been cast on a surface having features which were the negative of the microwell pattern. The microwell dimensions were 2 mm × 2 mm square, by 0.6 mm deep. The PDMS sheets were shaped into discs to fit into well plates using a wad punch (Amazon.com). Nylon (6/6) mesh having 36 × 36 µm openings was bonded over the microwell opening using silicone glue (Selley’s Aquarium Safe). The discs were then anchored into well plates with a dab of silicone glue. The Microwell-mesh, and the plate containing the inserts, was sterilized by first placing ~3 mL of 80% ethanol into each well, and centrifuging the plate at 3000 ×g for 5 min. This high-speed spin displaced air bubbles from the microwells and forced ethanol to contact all surfaces in and under the Microwell-mesh insert. The plates were then fully submerged in 80% ethanol for at least 1 h. Wells were then washed twice with Dulbecco’s phosphate-buffered saline (PBS) and once with water (Invitrogen UltraPure™ DNase/RNase-Free distilled water). Prior to use in cell culture, to make the PDMS surface non adhesive and promote cell aggregation,17,18 the Microwell-mesh inserts were coated with Pluronic. Each well was filled with 3 mL of Pluronic solution (5% Pluronic-F127 in DPBS w/v; Sigma-Aldrich) and the plate was centrifuged 3000×g for 5 min to force the solution into the microwells and displace bubbles from microwells. Wells were washed once with PBS before seeding with BMSC.
Differentiation assays
To assess the chondrogenic potential of transduced BMSCs, cells were seeded into 12-well Microwell-mesh plates at a density of 0.5 × 10⁶ BMSCs/well (~5000 BMSCs/microwell) in chondrogenic induction medium. Chondrogenic induction medium was formulated from high glucose (HG)-DMEM supplemented with GlutaMAX, 1% PenStrep, 1% Sodium Pyruvate, 1% Insulin-Transferrin-Selenium-Ethanolamine Solution (ITS-X), 40 µg/mL L-Proline (Sigma-Aldrich), 200 µM L-ascorbic acid-2-phosphate (Sigma-Aldrich), 100 nM Dexamethasone (Sigma-Aldrich) and 10 ng/mL TGF-β1 (PeproTech). To pellet cells and promote cell aggregation, the Microwell-mesh plates were centrifuged at 400× g for 3 min. Cultures were then incubated for 14 days at 2% O2, 5% CO2, and 37°C with medium exchanges performed every 2 days. To monitor the growth of chondrogenic microtissues, microscope images were captured at day 2, 4, 6, 8, 10, 12, and 14 of culture using an Olympus BX61/ IX73 microscope and size was determined using ImageJ. Stable transduction of chondrogenic microtissues was monitored and validated by capturing fluorescent images of the transduced cells which all carried a GFP reporter as well as the scrambled or SP7 shRNA.
To assess the osteogenic and adipogenic potential, BMSCs were seeded at 3 × 10⁴ cells/cm2 in 12-well plates for RNA collection (Nunc) and 48-well plates (Nunc) for staining assays and calcium content quantification. Cultures were maintained in osteogenic induction medium, formulated from HG-DMEM supplemented with 10% FBS, 1% PenStrep, 10 mM β-glycerol phosphate (BGP, Sigma-Aldrich), 100 nM Dexamethasone, and 50 µM L-ascorbic acid-2-phosphate, 100 ng/mL BMP-2 (Medtronic)) and adipogenic induction medium (HG-DMEM, 10% FBS, 1% PenStrep, 1 µg/ mL Insulin (Gibco), 100 nM Dexamethasone, 200 µM Indomethacin (Sigma-Aldrich), 500 µM 3-isobutyl-1-methylxanthine (IBMX; Sigma-Aldrich)). Cultures were maintained for 14 days, and medium was exchanged every 3 days.
Characterization of chondrogenic cultures
GAG and DNA were quantified as described previously. 13 Briefly, microtissues were digested in 125 µg/mL of papain and 10 mM L-cysteine (Sigma-Aldrich) in 100 mM of PBE buffer at pH 6.5, overnight at 60 ºC. DNA in the digest was quantified using a Quant-iT PicoGreen dsDNA assay Kit (Thermo Fisher Scientific), read in a fluorescent microplate reader (FLUOstar Omega) at 485 nm excitation and 520 nm emission. 19 Quantification of GAG in the papain-digested samples was performed using the dimethylmethylene blue (DMMB; Sigma-Aldrich) assay. The plate was read using a microplate reader at 540 nm (Multiskan Go; Thermoscientific) and GAG was estimated using a standard curve of serial dilutions of chondroitin sulfate derived from shark cartilage (Sigma-Aldrich). For both DNA and GAG assays, the reported values were the average of four biological replicate well (12-well) cultures.
At harvest, microtissues were washed with PBS and fixed overnight in 4% paraformaldehyde (PFA, Sigma -Aldrich). Fixed samples were embedded in Tissue-Tek optimal cutting temperature compound (OCT, Sakura Finetek) and stored at −20°C. Cryosectioning was performed using a Leica Cryostat CM 1950, and 7 µm sections were collected on poly-lysine coated slides (ThermoFisher). Tissue sections were gently washed with PBS to remove OCT, slides fixed in 4% paraformaldehyde (PFA) for 30 min, and then stained with Alcian Blue (Sigma-Aldrich).
For immunohistological staining of specific collagens, tissue sections were treated with 2 mg/mL hyaluronidase (Sigma-Aldrich), permeabilized with 0.1% Triton X-100 (Sigma-Aldrich) and blocked with 10% normal goat serum (Thermo Fisher Scientific). Sections were stained with the following primary antibodies (Abcam): anti-collagen type II (ab34712) and anti-collagen type X (ab58632). Primary antibodies were suspended in 1% bovine serum albumin (BSA, Sigma-Aldrich) and incubated on tissue sections overnight at 4°C. The secondary antibody (goat anti-rabbit IgG-HRP; ab6721, Abcam) was applied the following day at room temperature for 1 h, and the DAB chromogen kit (Abcam) was used to stain the sections following the manufacturer’s protocol. Tissue sections were counterstained with nuclear fast red (Sigma-Aldrich) for 5 min and washed repeatedly. Slides were dehydrated and coverslipped using Eukitt mounting medium, and sections were imaged with an Olympus IX73 microscope.
Characterization of osteogenic and adipogenic cultures
After 14 days of osteogenic and adipogenic induction culture, the relative metabolic activity was measured using the alamarBlue assay (Thermo Fisher Scientific). Cultures were incubated for 3 h at 37°C and read using a fluorescence spectrophotometer (FLUOstar Omega) using a spectral excitation/emission of 544 and 590 nm.
Following the specified days of culture, monolayers were fixed with 4% PFA for 30 min and then stained with Alizarin Red S (Sigma-Aldrich) for 30 min at room temperature. Excess stain was repeatedly washed out with distilled water. Brightfield images were captured using an Olympus IX73 microscope. Calcium was quantified using the O-Cresophthalein (OCPC) assay.
Osteogenic and adipogenic cultures were washed with PBS, fixed with 4% PFA for 30 min, and stained with Oil Red O (ORO) stain (Sigma-Aldrich) for 15 min. Excess stain was washed out with distilled water. Estimation of area occupied by lipid vacuoles in culture wells was performed using image analysis (ImageJ) of multiple regions in each replicate well, from each BMSC donor (n = 20). Brightfield mages were captured with Olympus IX73 microscope. Osteogenic and adipogenic cultures stained with ORO were also counterstained with DAPI nuclear stain and imaged with an Olympus IX73 microscope. Appropriate fluorescent filters were used for DAPI to view the nucleus, GFP to monitor stable transduction after 14 days, and ORO to view lipid vacuoles in GFP-expressing cells. Merged images were generated using CellSens imaging software (Olympus).
Gene expression quantification using qRT-PCR
Total RNA was isolated using the ISOLATE II RNA Mini Kit (Bioline), following the manufacturer’s instructions. Cell lysis was performed using the accompanying RLY lysis buffer. Chondrogenic microtissues were crushed, to liberate RNA, in microcentrifuge tubes using micropestles (Sigma-Aldrich). Samples were treated on-column with the DNase-I included in the kit in accordance with the manufacturer’s protocol. RNA concentration and purity were measured using a NanoDrop 1000 spectrophotometer (Thermoscientific).
Extracted RNA was reverse-transcribed using SensiFAST cDNA Synthesis Kit (Bioline) to produce cDNA. Synthesized cDNA was combined with forward and reverse primers (200 nM), and SYBR Green PCR Master Mix (Applied Biosystems) and analyzed on a Viia7 Real Time (RT)PCR System (Applied Biosystems). Primer sequences are detailed in Supplementary Table 1. GAPDH all was used as housekeeping gene for samples. The run parameters were as follows: a single initial cycle of 50°C for 2 min and 95°C for 10 min, followed by 40 cycles of 95°C for 15 s and 60°C for 1 min. Target gene expression relative to housekeeping gene expression was calculated using the formula, 2^(Ct(Gene of interest) – Ct(GAPDH)).
Initial characterization of SP7 was performed with quantitative (q) RT-PCR for all non-transduced BMSC donor cultures (WT) and the following conditions included compared: (1) For chondrogenic induction, Day 0 samples included expanded BMSCs prior to induction, Non-induced monolayer samples were grown in DMEM-HG supplemented with 10% FBS and 1% PenStrep for 14 days. No TGF-β1 and plus TGF-β1 controls were cultured in the Microwell-mesh in chondrogenic medium without or with TGF-β1, respectively; (2) For osteogenic induction, Day 0 samples, Non-induced samples and induced samples. Non-induced monolayer samples were cultured in DMEM-HG supplemented with 10% FBS and 1% PenStrep for 14 days, no BMP-2 samples were maintained in osteogenic medium without BMP-2 for 14 days, and BMP-2 samples were cultured in osteogenic medium supplemented with BMP-2; (3) For adipogenic induction, Day 0, Non-induced samples were compared with BMSC monolayer cultures maintained in adipogenic medium for 14 days.
Statistical analysis
Samples were analyzed for normal distribution using the Shapiro-Wilk test (α = 0.05). For samples that were normally distributed, one-way analysis of variance (ANOVA) and Dunnett’s multiple comparison test were performed for comparison of three or more groups, and unpaired t-test for two groups. For samples that were not normally distributed, analysis was done using the Kruskal Wallis test and Dunn’s multiple comparison test for three or more groups, and Mann-Whitney test for comparison of two data sets. All statistical analyses were done in Graph Pad Version 9.2.0. A p-value of less than 0.05 was considered significant. Values represent the mean of four replicate well cultures for each BMSC donor unless otherwise stated ± the standard deviation (SD). For image analysis of lipid vacuoles in osteogenic and adipogenic cultures, 20 frames were analyzed for each condition for all three BMSC donors.
Results
SP7/ Osx is highly expressed in BMSC chondrogenic cultures with TGF-β1 and osteogenic cultures with BMP-2
SP7 expression was initially quantified in non-transduced BMSCs (WT) to determine the conditions when SP7 is upregulated. BMSCs were induced using chondrogenic, osteogenic, and adipogenic conditions for 14 days and compared to Day 0 and 14-day BMSC non-induced cultures. SP7 gene expression significantly increased when chondrogenic medium was supplemented with TGF-β1 (10 ng/mL), relative to Day 0 and non-induced monolayer cultures, or chondrogenic microtissues without TGF-β1 for all BMSC donors (Supplemental Figure S1a).
BMSC osteogenic cultures supplemented with BMP-2 (100 ng/mL) showed significant upregulation of SP7 gene expression compared to Day 0 and non-induced monolayer cultures, as well as osteogenic cultures without BMP-2 (Supplemental Figure S1b). There was no significant increase in SP7 gene expression in BMSC adipogenic induction cultures relative to Day 0 and non-induced monolayer cultures for all three BMSC donors after 14 days of culture (Supplemental Figure S1c).
Effect of SP7/Osx gene silencing on the growth of BMSC chondrogenic microtissues
Silencing of the SP7 gene in transduced BMSC microtissues was validated using qRT-PCR after 14 days of chondrogenic induction with TGF-β1 (Figure 1(a)). Similar to the behavior exhibited by WT BMSCs (Supplemental Figure S1a), Day 0 monolayer cultures of ScControl and shRNA-SP7 showed insignificant to undetectable SP7 gene expression (Figure 1(a)). SP7 gene expression was upregulated when BMSCs were chondrogenically induced with TGF-β1 (ScControl), but downregulated when this was performed using cells with SP7 silenced (shRNA-SP7) for all BMSC donors (Figure 1(a)).
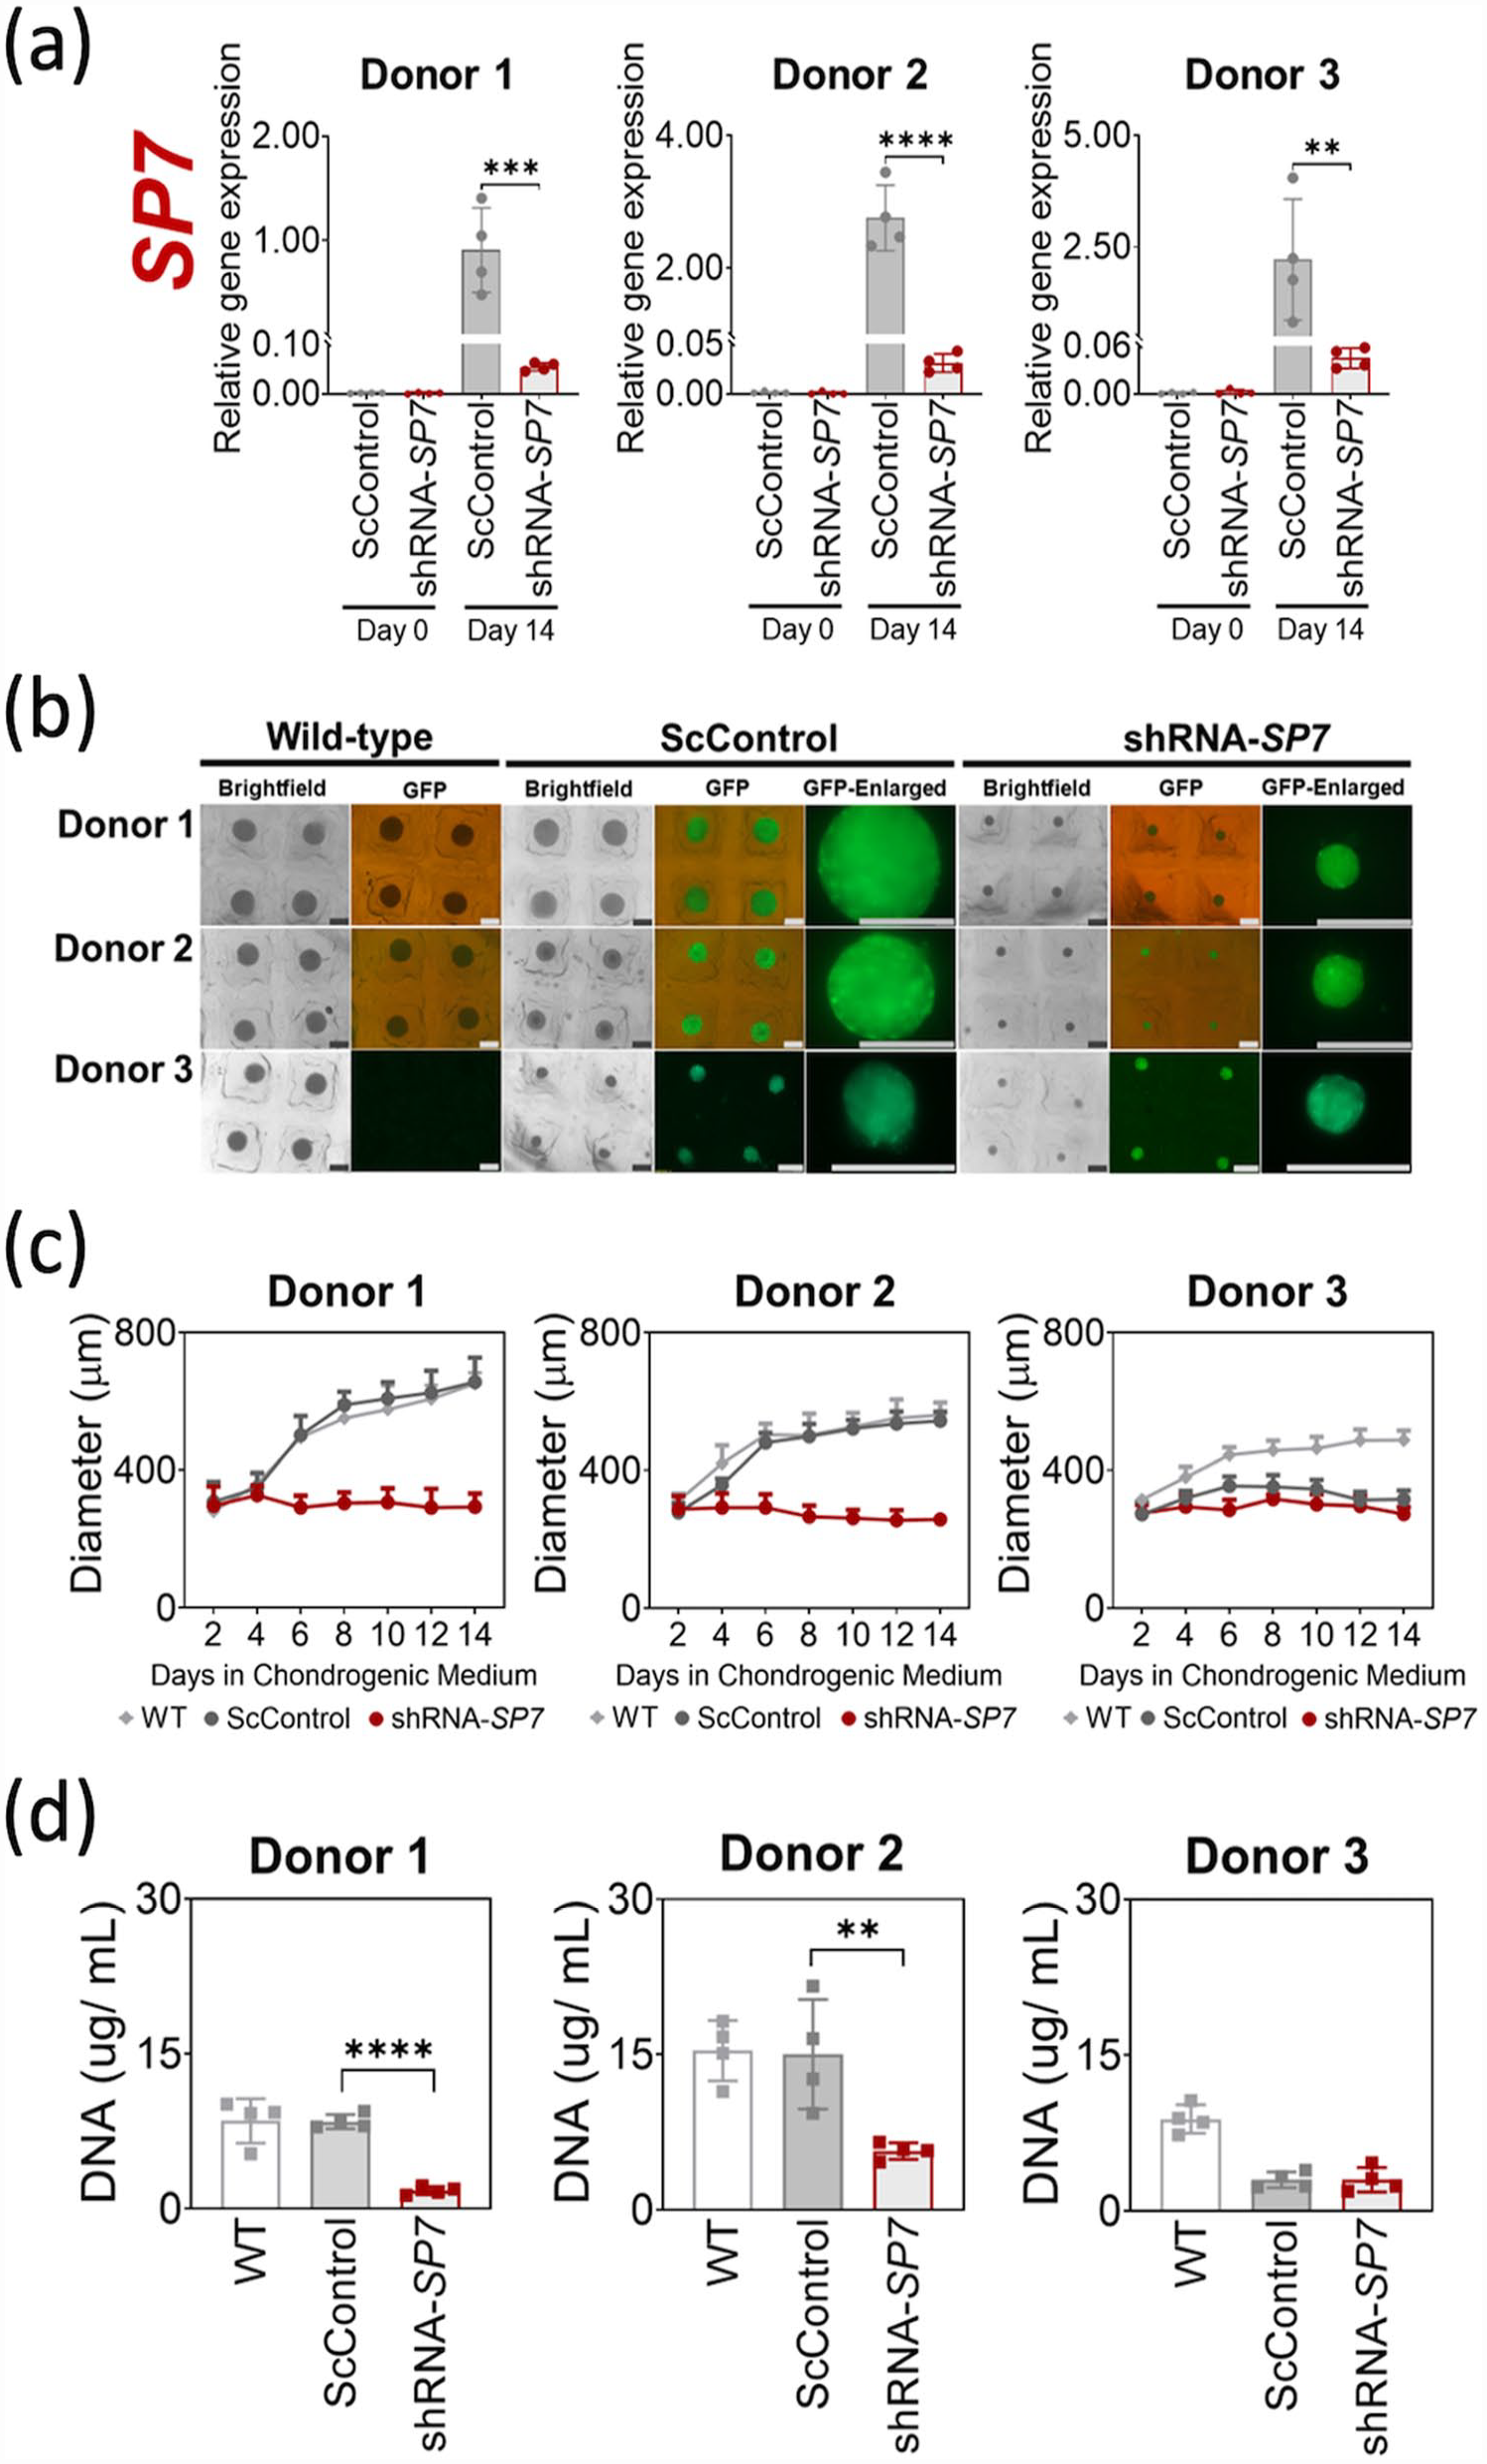
SP7 silencing reduced microtissue growth during BMSC chondrogenic induction. (a) Silencing of SP7 was verified by qRT-PCR after 14 days of chondrogenic induction with TGF-β1 (10 ng/mL). Significant reduction of SP7 gene expression was observed in shRNA-SP7 microtissues compared to ScControl for all three BMSC donors. Day 0 corresponds to expanded monolayer cultures of transduced BMSCs prior to chondrogenic induction. (b) Microscopic images of BMSC chondrogenic microtissues after 14 days of culture showing reduced size of shRNA-SP7 microtissues for all donors. GFP was monitored using fluorescence microscopy to validate stable transduction after chondrogenic induction for both ScControl and shRNA-SP7 microtissues and absence in WT microtissues. (c) Measurement of microtissue diameter through image analysis (n = 16) every 2 days during 14 days of chondrogenic culture. (d) DNA content measured through PicoGreen assay after 14 days of culture. Donor 1 and Donor 2 showed significant reduction of DNA in SP7-silenced cultures compared to WT and ScControl (n = 16). Shapiro-Wilk test was done to test for normal distribution (α = 0.05). One-way ANOVA and Dunnett’s multiple comparison test were done for normally distributed samples. Kruskal Wallis test and Dunn’s multiple comparisons test were done on samples that were not normally distributed. Statistical significance was indicated only in transduced cultures (ScControl and shRNA-SP7). Data plots represent the means of 4 replicate wells unless otherwise stated. *p < 0.05, **p < 0.01, ***p < 0.001, and ****p < 0.0001.
GFP fluorescence was monitored in BMSC chondrogenic microtissues throughout the 14-day culture period as an indicator of stable transduction. GFP fluorescence was observed in ScControl and shRNA-SP7 microtissue cultures for all donors over the 14-day cultures (Figure 1(b)). Non-transduced control microtissues (WT) did not exhibit fluorescence under the same microscope settings, demonstrating that fluorescent signal in other cultures was not due to autofluorescence (Figure 1(b)). shRNA-SP7 microtissues were noticeably smaller in size compared to WT and ScControl microtissues for two out of three BMSC donors (Figure 1(b)).
The average diameters of WT and ScControl microtissues increased from day 2 to day 14 for all BMSC donors, with similar growth patterns observed for Donor 1 and 2 microtissues (Figure 1(c)). In all BMSC donors, the shRNA-SP7 microtissues did not significantly increase in size from day 2 to day 14 (Figure 1(c)). At endpoint, the average microtissue diameters were as follows: Donor 1 (WT = 650.9 µm, ScControl = 655.9 µm, shRNA-SP7 = 293.4 µm); Donor 2 (WT = 559.7 µm, ScControl = 543.2 µm, shRNA-SP7 = 257.6 µm); and Donor 3 (WT = 487.1 µm, ScControl = 315.4 µm, shRNA-SP7 = 273.0 µm).
The DNA content of the microtissues per well was quantified at day 14. When the size of microtissues was compared to the DNA content, the size reduction correlated with the quantity of DNA recovered. The DNA content was significantly lower in shRNA-SP7 microtissues compared to WT and ScControl for Donors 1 and 2, while there was no significant difference observed between ScControl and shRNA-SP7 for Donor 3 (Figure 1(d)).
Chondrogenesis was abrogated with SP7/ Osx gene silencing
To determine the impact of SP7 silencing on BMSC chondrogenesis, Alcian blue staining was performed to detect the GAG matrix content following 14 days of chondrogenic induction with TGF-β1. GAG staining was visibly reduced in shRNA-SP7 microtissues for all BMSC donors, as was the formation of lacunae for Donor 2 BMSC (Figure 2(a)). For Donor 3, GAG staining and lacunae morphology were similar between ScControl and shRNA-SP7 (Figure 2(a)). When GAG was quantified, shRNA-SP7 microtissues showed significantly reduced production relative to WT and ScControls for two out of three donors (Figure 2(b)). The pattern of reduced GAG production was found to be similar for all BMSC donors when GAG was normalized to DNA content (Figure 2(b)).

Chondrogenesis was abrogated with SP7 silencing. (a) Alcian Blue staining of chondrogenic microtissues after 14 days of culture where GAG in Donor 1 and 2 is reduced with SP7 silencing. Scale bar = 100 µm. (b) GAG and DNA content was measured after 14 days of culture. GAG and GAG/ DNA were significantly reduced with SP7-silencing in 2/3 donors, compared with shRNA-SP7. (c) The presence of collagen type II was detected in WT, ScControl and SP7-silenced chondrogenic microtissues after 14 days of culture. Scale bar = 100 µm. (d) Gene expression of chondrogenic markers were quantified using qRT-PCR. ACAN and COL2A1 were reduced in all three donors. Shapiro-Wilk test was done to test for normal distribution (α = 0.05). One-way ANOVA and Dunnett’s multiple comparison test were done for normally distributed samples. Kruskal Wallis test and Dunn’s multiple comparisons test were done on samples that were not normally distributed. Statistical significance was indicated only in transduced cultures (ScControl and shRNA-SP7). Data plots represent the means of 4 replicate wells unless otherwise stated. *p < 0.05, **p < 0.01, ***p < 0.001, and ****p < 0.0001.
Collagen type II is one of the primary matrix molecules in cartilage and is commonly used as a marker of BMSC chondrogenesis. Collagen type II was detected in all BMSC microtissue samples, including the shRNA-SP7 microtissues (Figure 2(c)). However, the morphology of shRNA-SP7 microtissues for two out of three BMSC donors was considered inferior to WT and ScControl microtissues where lacunae, characteristic of mature cartilage, were more prevalent (Figure 2(c)).
Chondrogenic gene markers, ACAN and COL2A1, were upregulated after 14-day chondrogenic induction in WT and ScControl microtissues, but were significantly downregulated in shRNA-SP7 microtissues for all BMSC donors (Figure 2(d)). In contrast, the gene silencing did not generally affect SOX9 gene expression (Figure 2(d)).
Hypertrophy persists after SP7/ Osx gene silencing in BMSC chondrogenic microtissues
Silencing of SP7 did not visibly reduce the production of collagen type X in shRNA-SP7 chondrogenic microtissues (Figure 3(a)). The presence of this protein suggested that SP7 silencing did not prevent the hypertrophy in chondrogenic microtissues for all BMSC donors. Nevertheless, while there was visible collagen type X staining in all tissues, COL10A1 gene expression was consistently reduced in all shRNA-SP7 microtissues relative to ScControls (Figure 3(b)). In a similar manner, downregulation of IHH was also evident when SP7 was silenced in microtissues from all BMSC donors compared to ScControl (Figure 3(b)). Downregulation of COL1A1 in SP7-silenced microtissues was only observed for Donors 1 and 2; while RUNX3 gene expression was unaffected in these two donors (Figure 3(b)). When COL10A1 was normalized to COL2A1, shRNA-SP7 microtissues were not significantly different from ScControl for all BMSC donors (Figure 3(c)). This indicates that COL10A1 was downregulated with COL2A1 expression during SP7 gene silencing.

SP7 silencing reduced expression of hypertrophic gene markers in BMSC chondrogenic cultures. (a) Collagen type X staining of BMSC chondrogenic microtissues after 14 days of culture. (b) Gene expression of hypertrophic markers using qRT-PCR. Silencing of SP7 showed reduction of COL10A1 after 14 days of chondrogenic induction in all three donors. COL1A1 gene expression was reduced in 2/3 donors, while RUNX3 was not affected by SP7 gene silencing. (c) SP7 gene silencing did not significantly reduce the pro-hypertrophic properties indicated by the COL10A1/COL2A1 ratio in all three BMSC donors. Shapiro-Wilk test was done to test for normal distribution (α = 0.05). One-way ANOVA and Dunnett’s multiple comparison test were done for normally distributed samples. Kruskal Wallis test and Dunn’s multiple comparisons test were done on samples that were not normally distributed. Statistical significance was indicated only in transduced cultures (ScControl and shRNA-SP7). Data plots represent the means of 4 replicate wells. *p < 0.05, **p < 0.01, ***p < 0.001, and ****p < 0.0001.
Effect of SP7/Osx gene silencing on BMSC osteogenic cultures
Day 0 monolayer ScControl and shRNA-SP7 cultures had minimal SP7 gene expression prior to osteogenic induction for all BMSC donors (Figure 4(a)). Validation of SP7 gene silencing in transduced BMSC osteogenic cultures was performed using qRT-PCR following 14 days of culture with BMP-2 (100 ng/mL). A significant reduction in SP7 gene expression was consistently observed in osteogenically induced shRNA-SP7 cultures for all BMSC donors, relative to ScControl under the same culture conditions (Figure 4(a)).

Effects of SP7 gene silencing on mineralization of BMSC osteogenic cultures with BMP-2 (100 ng/ mL). (a) Silencing of SP7 gene was verified by qRT-PCR after 14 days of osteogenic induction with BMP-2 (100 ng/mL). A significant reduction in SP7 gene expression was observed in shRNA-SP7 samples for all three BMSC donors. (b) Calcium quantification showed a significant reduction in calcium deposition in shRNA-SP7 samples compared to ScControl for Donor 1 and Donor 2. Relative cell viability measured using the alamarBlue assay showed significantly reduced cell number at culture endpoint in shRNA-SP7 samples compared to ScControl in Donor 1 and Donor 2. Microscopic images of osteogenic cultures stained with Alizarin Red S (ARS) showing bright red color, indicative of mineralization (See Supplemental Figure S2 for ARS staining of whole plates). Scale bar = 100 µm. (c) Osteogenic gene expression markers, ALPL and BSP, were significantly downregulated by SP7 silencing, while RUNX2 and BGLAP were unaffected. Shapiro-Wilk test was done to test for normal distribution (α = 0.05). One-way ANOVA and Dunnett’s multiple comparison test were done for normally distributed samples. Kruskal Wallis test and Dunn’s multiple comparisons test were done on samples that were not normally distributed. Statistical significance was indicated only in transduced cultures (ScControl and shRNA-SP7). Data plots represent the means of 4 replicate wells unless otherwise stated. *p < 0.05, **p < 0.01, ***p < 0.001, and ****p < 0.0001.
Metabolic activity, measured using the alamarBlue assay, indicated that shRNA-SP7 cells were significantly less metabolically active than ScControl cells generated from Donors 1 and 2 (Figure 4(b)). Consistent with reduced metabolic activity, there was a reduction in the calcium content of shRNA-SP7 cultures relative to ScControls for two out of three donors (Figure 4(b)). BMSC osteogenic cultures were stained with Alizarin Red S to highlight mineral deposits. There was little Alizarin Red S staining for monolayer cultures generated from Donors 1 and 2 shRNA-SP7 cells, consistent with the levels of calcium measured by the OCPC assay (Figure 4(b) and Supplemental Figure S2). Donor 3 shRNA-SP7 samples showed positive Alizarin Red S staining, comparable to WT and ScControl samples (Figure 4(b) and Supplemental Figure S2).
BMSC osteogenic cultures were assessed on day 0 and day 14 to determine the effect of SP7 gene silencing on osteogenic gene expression markers. Insignificant ALPL and BSP gene expression was observed in day 0 cultures for all BMSC donors and while these were upregulated in 14-day osteogenic culture, silencing of SP7 gene was observed to reduce this expression, even in the presence of BMP-2 (Figure 4(c)). No significant changes were seen in the gene expression, of RUNX2 and BGLAP in osteogenic cultures, except a downregulation of BGLAP in Donor 2 (Figure 4(c)).
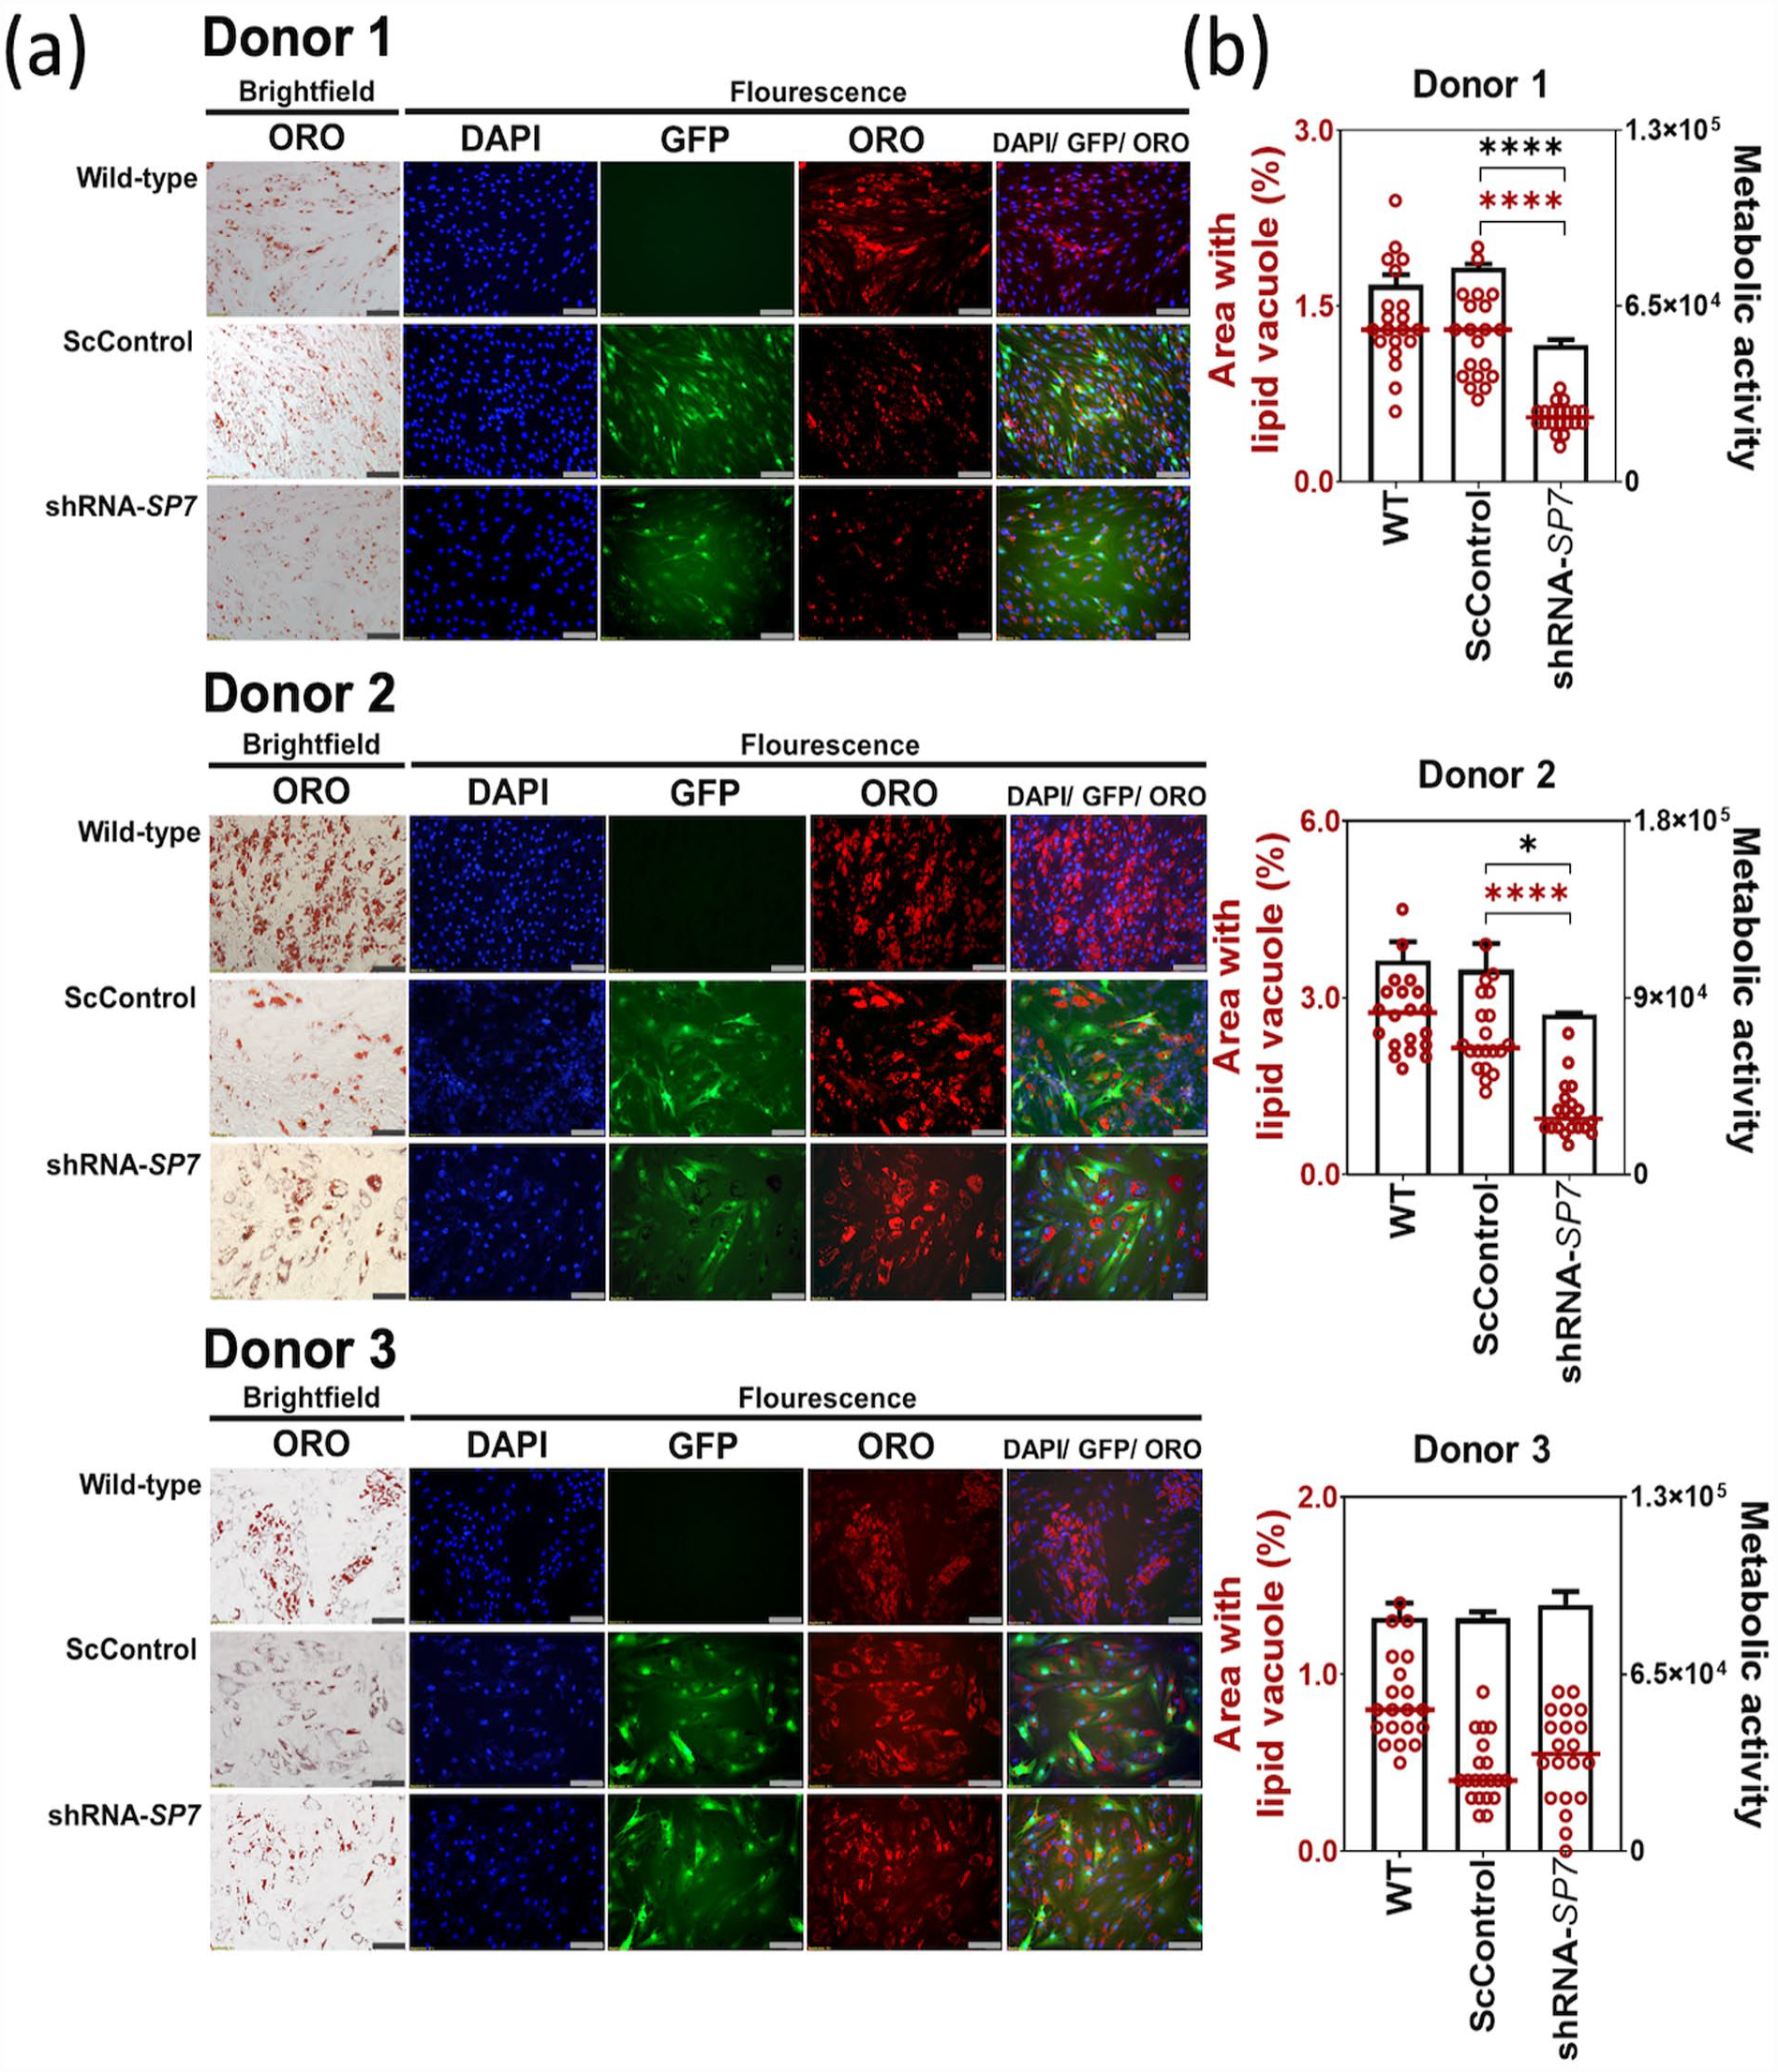
Addition of BMP-2 to BMSC osteogenic cultures not only hastens mineralization, but also induces adipogenesis.18,20 The presence of lipid vacuoles in osteogenic cultures was detected in all BMSC osteogenic cultures in this study and was visualized by staining with ORO (Figure 5(a)). The lipid vacuoles in osteogenic cultures were typically spheroidal, and formed in clusters, retaining the red color of the lipophilic ORO. In addition to a clustered arrangement of lipid vacuoles, individually scattered spheroid units stained with ORO were numerous in Donor 2 ScControl cultures (Figure 5(a)). DAPI staining showed a visible reduction of nuclei in shRNA-SP7 cultures compared to WT and ScControl cultures for Donors 1 and 2 (Figure 5(a)). 21 When adipogenesis proceeded in osteogenic cultures, image analysis showed reduced lipid vacuole production in shRNA-SP7 cultures compared to ScControl for all BMSC donors (Figure 5(b)). In two out of three BMSC donors, the production of lipid vacuoles was proportional to their metabolic activity (Figure 5(b)).

Effects of SP7 gene silencing on adipogenesis of BMSC osteogenic cultures with BMP-2 (100 ng/ mL). (a) Lipid vacuoles stained with Oil Red O (ORO, red) were visibly reduced in shRNA-SP7 cultures in all BMSC donors. Fluorescence imaging shows the presence of DAPI-stained nucleui (blue) and GFP (green) (in ScControl and shRNA-SP7 samples), indicating stable transduction after 14 days of culture. Scale bar = 100 µm. (b) Quantification of ORO-stained lipid vacuoles was measured using ImageJ (n = 20). A significant reduction of lipid vacuole formation was observed in shRNA-SP7 cultures in all three BMSC donors. (c) Adipogenic gene markers were quantified using qRT-PCR with no significant changes with SP7 gene silencing after 14 days of culture. FABP4 gene expression was reduced only in Donor 3 with SP7 silencing. Shapiro-Wilk test was done to test for normal distribution (α = 0.05). One-way ANOVA and Dunnett’s multiple comparison test were done for normally distributed samples. Kruskal Wallis test and Dunn’s multiple comparisons test were done on samples that were not normally distributed. Statistical significance was indicated only in transduced cultures (ScControl and shRNA-SP7). Data plots represent the means of 4 replicate wells unless otherwise stated. *p < 0.05, **p < 0.01, ***p < 0.001, and ****p < 0.0001.
The expression of adipogenic gene markers (PPARG and FABP4) were also quantified in osteogenic induction cultures to determine if they were affected by SP7 gene silencing. There were no significant changes in PPARG gene expression when SP7 was silenced in adipogenic cultures, relative to controls (Figure 5(c)). FABP4 was downregulated only for Donor 3 shRNA-SP7 cells (Figure 5(c)).
Effect of SP7 gene silencing on BMSC adipogenic cultures
Lipid vacuoles, and lipophilic staining with ORO, were consistently observed in the non-transduced WT, transduced ScControl, as well as the shRNA-SP7 samples for all BMSC donors. This indicated that SP7 gene silencing did not inhibit lipid formation during BMSC adipogenesis (Figure 6(a)). However, quantification of the ORO-stained areas by image analysis showed reduced lipid vacuole formation in both Donor 1 and Donor 2 shRNA-SP7 adipogenic cultures (Figure 6(b)). In all BMSC donors, the pattern of quantified lipid vacuole formation follows that of the metabolic activity (Figure 6(b)).
SP7 silencing did not affect lipogenesis in BMSC adipogenic cultures. (a) Microscopic images of 14-day BMSC adipogenic cultures showed lipid vacuole formation stained with Oil Red O (ORO) viewed with brightfield microscopy, and with DAPI (blue) and ORO (red) viewed using fluorescence microscopy. GFP (green) is indicative of transduced cells in Scrambled Control and shRNA-SP7. Combined images were constructed using Cellsens software. (Scale bar = 100 µm). (b) Quantification of OR O-stained lipid vacuole area formed after 14 days of adipogenic culture, measured using ImageJ (n = 20 frames). A significant reduction in lipid vacuole formation was observed in Donor 1 and Donor 2 with SP7 gene silencing, which can be related with metabolic activity, measured by the alamarBlue assay. Shapiro-Wilk test was done to test for normal distribution (α = 0.05). One-way ANOVA and Dunnett’s multiple comparison test were done for normally distributed samples. Kruskal Wallis test and Dunn’s multiple comparisons test were done on samples that were not normally distributed. Statistical significance was indicated only in transduced cultures (ScControl and shRNA-SP7). Data plots represent the means of 4 replicate wells. *p < 0.05, **p < 0.01, ***p < 0.001, and ****p < 0.0001.
Discussion
To maximize the potential utility of BMSCs as a cell source for cartilage repair, hypertrophy must be prevented or at least, minimized. Several strategies to counter hypertrophic differentiation have been attempted,2,22 but none have thus far been widely reproduced or translated clinically. We recently reported that SP7 is upregulated in BMSC chondrogenic induction cultures following a single day of TGF-β1 stimulation, and that SP7 remains upregulated even if TGF-β1 is subsequently removed from the medium. 3 Based on this observation, and on the known role that SP7 plays in bone development,4 –6 we explored the impact of SP7 silencing with shRNA on BMSC differentiation.
Initially, we determined the conditions when SP7 is upregulated. Monolayer expanded cultures of BMSCs from three different BMSC donors in this study showed undetectable or very low SP7 expression. SP7 is upregulated when BMSCs are induced with an appropriate signaling molecule,8,23 and in this study SP7 was significantly upregulated when cultures were chondrogenically induced with TGFβ-1 and or osteogenically induced with BMP-2. SP7 encodes a transcription factor that acts downstream of the osteogenic master regulator, RUNX2. 5 The growth factor, BMP-2, upregulates RUNX2 expression, and RUNX2 binds directly to the SP7 promoter to drive its expression in addition to other target genes. 24 In the case of TGF-β1, upregulation of the SP7 gene is prominent even after a single day of exposure during the chondrogenic induction of BMSCs. 3 The mechanism of TGF-β1 influence on the upregulation of SP7 in BMSCs is not yet fully understood. But like BMP-2, TGF-β1 signals through the Smad 1/5/8 signaling pathway 25 to regulate the expression of hypertrophic markers and requires TGF-β-induced early gene 1 (Tieg1) for SP7 gene expression. 26 Upregulation of SP7 with growth factors may be cell type dependent. For instance, in mouse rib-derived chondrocytes cultures, BMP-2 enhances SP7 (Osterix) gene expression, but TGF-β1 does not. 23
SP7-silenced BMSC microtissues responded to TGF-β1 with a promising reduction in expression of COL10A1, an early marker of chondrogenic hypertrophy, IHH, which coordinates key events for endochondral ossification, and COL1A1 (2/3 donors), an early marker for osteoblast differentiation. 27 However, there was a parallel reduction in the expression of important chondrogenic markers, including COL2A1 and ACAN. 28 Silencing SP7 had a visually appreciable impact on chondrogenesis; microtissues generated from shRNA-SP7 BMSC did not increase in size like WT and ScControl microtissues, and these tissues produced significantly less GAG. While lacunae structures were evident in cartilage-like tissue generated from WT and ScControl cells, they were less evident, even appearing to have collapsed in tissues generate from shRNA-SP7 BMSCs. In totality, silencing SP7 did dampen hypertrophy, but in parallel, it also significantly compromised BMSC chondrogenesis.
The role of SP7 in embryonic and postnatal bone formation is well-documented,5,6 but has not been characterized for adult human BMSC osteogenesis. Osteogenic differentiation cultures in this study were supplemented with BMP-2, which upregulated SP7 expression, and SP7 silencing was evaluated to determine if this strategy could counter the effects of the BMP-2. Silencing of SP7 reduced the expression of osteogenic markers, ALPL and BSP, for all BMSC donors, but only dampened mineralization for two out of three donors. The influence of SP7 on the regulation of ALPL and BSP was reported previously using knockout mouse models or murine cell lines which behavie similarly to the human BMSCs used in this study,6,7,9,29 and the reduction in mineralization we observed may be attributed to the downregulation of osteogenic gene marker expression. The presence of mineralization in SP7-silenced Donor 3 osteogenic cultures may be due to donor variability, but it is more likely a reflection of other signaling cascades that remain intact despite SP7 silencing. In a similar study, Zhu et al. treated BMSC, having SP7 knockdown, with BMP-6, and observed mineralization despite downregulation of osteogenic markers (BSP, OPN, OMD, and ASPN). 30 RUNX2 acts upstream of SP7 5 and its expression was not affected by SP7 silencing for all three BMSC donors in our study, suggesting that other RUNX2-target genes may be active despite SP7 silencing. Nevertheless, SP7 likely plays a significant role in the manifestation of BMP-2 driven osteogenesis, as BMP-2 potency is significantly blunted by SP7 silencing. This is consistent with findings reported by Zhu et al. where SP7 had insignificant influence on BMSC osteogenic differentiation when exogenous BMP was not added to the osteogenic medium. 30 In totality, SP7 has a significant influence on BMSC osteogenesis, but it does not act alone, and thus other factors can support modest osteogenesis even when SP7 is impaired. 31
Lipid formation increases with BMP-2 addition in BMSC osteogenic cultures.18,20 We also tested the capability of SP7 silencing to affect lipogenesis as a consequence of BMP-2 induced osteogenic differentiation. In all BMSC donors, SP7 gene silencing had minimal influence on the downregulation of PPARG (in all donors) and FABP4 (2/3 donors) with the formation of lipid vacuoles still detected despite the gene silencing. The impact of SP7 on adipogenesis is not definitive and varies depending on the cell type. In adipogenically differentiated 3T3-L1 mouse fibroblast cells, knockdown of Sp7 enhanced Pparg gene expression with a consequent increase in lipid formation, and the effect was reversed with Sp7 overexpression. 32 In murine embryonic stem cells and murine BMSCs, Sp7 expression did not affect Parg expression 33 and lipoprotein lipase production, 29 respectively. Lipogenesis during adipogenic differentiation of BMSCs showed similar results wherein the lipid formation proceeded even with SP7 gene silencing. When the area stained with ORO was quantified, to estimate lipid vacuole area, lipid vacuoles were seen to be reduced for 3/3 donors in osteogenic assays and for 2/3 donors in adipogenic assays, but the reduced relative vacuole area may have been an artifact of the reduced cell numbers in these same cultures. Overall, SP7 silencing did not appear to significantly impact BMSC adipogenesis.
In summary, the primary goal of this study was to determine if SP7 silencing could prevent BMSC hypertrophy. The precise role of SP7 in cartilage formation is not well understood, but reports of SP7 gene expression detection in differentiating chondrocytes in mouse embryos,4,5 in adult human articular chondrocytes, 34 and multipotential stromal cells from osteoarthritic knees 35 suggest that it may play some role in cartilage development. 4 If SP7 does play a role in cartilage development, then this could provide insight into why SP7 silencing had the negative impacted on chondrogenesis observed here. However, we reason that the significant impact SP7 silencing has on both chondrogenic and hypertrophic differentiation cascades likely indicated that these are parallel and intertwined processes for BMSCs. This parallel process would be in contrast to fetal mesenchymal cells which are capable of sequential chondrogenic, followed by hypertrophic differentiation processes. 36 In our earlier cited study which tracked BMSC response to TGF-β1 stimulation, we observed that chondrogenic and hypertrophic differentiation cascades appeared to played out in parallel. 3 We also previously attempted to counter BMSC hypertrophy using a small molecule that inhibits BMP signaling. 20 Like SP7, BMP2 signaling is upregulated in BMSC following a single day of TGF-β1 stimulation, and BMP2 signaling remains elevated even if TGF-β1 is subsequently removed from the medium. In the previous BMP-inhibition study, similar to SP7 silencing, we observed that inhibiting BMP signaling did dampen hypertrophic differentiation, but that this resulted in a parallel dampening of chondrogenic differentiation. Previous studies which used dorsomorphin to dampen BMSC hypertrophy also observed that this resulted in a parallel obstruction in the initiation of chondrogenesis. 37 Cumulatively, these data suggest that BMSC chondrogenic and hypertrophic differentiation are intertwined and highlight the challenge of maintaining chondrogenesis whilst simultaneously obstructing hypertrophy.
A limitation of this study is that only three BMSC donor populations were utilized, and in some cases, there was variation in outcomes between donors. For all three donors, the major hypertrophy marker, COL10A1 gene expression, was also significantly dampened by SP7 silencing. However, major markers of chondrogenic differentiation including GAG content, ACAN gene expression, and COL2A1 gene expression were also significantly dampened by SP7 silencing for all BMSC donors. Cumulatively, these data demonstrated that SP7 silencing consistently resulted in dampening of both chondrogenic and hypertrophic differentiation. While these major signals were consistent, there was variation between BMSC donors with respect to secondary signals, such as COL1A1 and RUNX3 gene expression during chondrogenesis, and in osteogenic differentiation assays. In osteogenic assays, ALPL and BSP were significantly reduced by SP7 silencing for all three BMSC donors, but despite a significant reduction in these major osteogenic gene pathways, one SP7 silenced BMSC donor cell population mineralized. It may be that osteogenic pathways that are independent of SP7 may still be activated and allow BMSCs to eventually mineralize in osteogenic induction cultures. Future studies might consider using additional BMSC donors, or studies might use high-resolution tools such as RNA-Seq to better deconvolute the role SP7 silencing has on BMSC differentiation. Additionally, especially for osteogenic differentiation cultures, it may be useful to collect more timepoints, including longer timepoints to understand if all BMSC populations eventually mineralize despite SP7 silencing and dampened ALPL and BSP gene expression.
Supplemental Material
sj-docx-1-tej-10.1177_20417314231177136 – Supplemental material for SP7 gene silencing dampens bone marrow stromal cell hypertrophy, but it also dampens chondrogenesis
Supplemental material, sj-docx-1-tej-10.1177_20417314231177136 for SP7 gene silencing dampens bone marrow stromal cell hypertrophy, but it also dampens chondrogenesis by Rose Ann G Franco, Eamonn McKenna, Pamela G Robey, Ross W Crawford, Michael R Doran and Kathryn Futrega in Journal of Tissue Engineering
Footnotes
Acknowledgements
The authors would like to thank Dr. David Sester and the TRI Flow Cytometry Facility staff (Ms. Dalia Khalil, Ms. Yitian Ding, and Dr. Andy C. Wu) for their assistance in cell-sorting experiments.
Author contribution
R.G.F., E.M., P.G.R., R.W.C., M.R.D., and K.F. designed research, analyzed data, and wrote the paper; R.G.F., and K.F. performed research. All authors reviewed and approved the manuscript.
Declaration of conflicting interests
The author(s) declared the following potential conflicts of interest with respect to the research, authorship, and/or publication of this article: K.F. and M.R.D. co-founded a company, Microwell-mesh.com, to share the culture device described in this paper.
Funding
The author(s) disclosed receipt of the following financial support for the research, authorship, and/or publication of this article: M.R.D. and R.W.C. gratefully acknowledge project support from the National Health and Medicine Research Council (NHMRC) of Australia (Project Grant APP1083857) and NHMRC Fellowship support of M.R.D. (APP1130013). K.F. and P.G.R. are supported by the Division of Intramural Research (DIR) of the National Institute of Dental and Craniofacial Research (NIDCR), a part of the Intramural Research Program (IRP) of the National Institutes of Health (NIH), Department of Health and Human Services (DHHS) (1 ZIA DE000380 35). The Translational Research Institute (TRI) is supported by Therapeutic Innovation Australia (TIA). TIA is supported by the Australian Government through the National Collaborative Research Infrastructure Strategy (NCRIS) program.
Supplemental material
Supplemental material for this article is available online.
References
Supplementary Material
Please find the following supplemental material available below.
For Open Access articles published under a Creative Commons License, all supplemental material carries the same license as the article it is associated with.
For non-Open Access articles published, all supplemental material carries a non-exclusive license, and permission requests for re-use of supplemental material or any part of supplemental material shall be sent directly to the copyright owner as specified in the copyright notice associated with the article.