
Abstract
This study investigates the low-velocity response of composite-layered concrete with viscoelastic interlayers as an alternative to conventional reinforced concrete, aiming to improve energy absorption and reduce peak impact forces in structures such as railway catch walls. Cubic specimens were fabricated using Normal Concrete (NC) and Rubberised Concrete (RC) to evaluate mechanical properties. For impact testing, cylindrical samples were manufactured using the same mix design of NC and RC but with the inclusion of intermediate viscoelastic layers of Polyurethane (PU) or Silicone (SI). A total of 54 specimens were subjected to low-velocity impact testing (2.5 m/s, 5.0 m/s, and 7.5 m/s). Testing evaluated the strain-rate-dependent behaviour, including the peak force, the impulse, and the energy absorbed, enabling direct comparisons between investigated layering configurations. The study indicated that the integration of energy-absorbing interlayers enhanced the impact performance, with the best performing system reducing peak force by up to 85.7% under lower test velocities and increasing measured impulse by upwards of 75% at higher test velocities. SI-based systems achieved 26% greater impulse efficiency than their PU counterparts, while also maintaining structural integrity at higher impact energies. SI-based systems demonstrated consistent mechanical responses under increasing impact velocity, highlighting their potential for application in energy-absorbing structural protective systems. A predictive equation was developed through non-linear regression, enabling the design of layered concrete composites for civil damage-resistant protective structures.
Introduction
Infrastructure assets, such as catch walls or crash barriers, is increasingly exposed to impact-related hazards (Byers et al., 2025). Thus, it becomes important to consider the impact loading and influence of parameters to improve the damage resistance of structures, particularly composite (Kaware and Kotambkar, 2022). Reinforced concrete, despite its widespread use and high compressive strength, has limited energy dissipation capacity and tends to fail in a brittle manner. As a result, design approaches often rely on conservative overdesign, treating structures as rigid bodies and neglecting dynamic energy absorption (Liu et al., 2012). This highlights the need for ductile, energy-efficient materials or composite systems capable of dissipating energy through controlled deformation (Restrepo and Martinez, 2023). Innovative layered polymer concrete composites designed to enhance impact resistance, are an alternative to conventional mass concrete structures for catch walls or crash barriers.
Concrete is a quasi-brittle, composite material whose mechanical properties are governed by its constituents and their proportions (Chen et al., 2013). The aggregates primarily bear axial loads, while the cement matrix controls fracture behaviour, energy dissipation, and crack propagation (Guinea et al., 2002). This internal structure makes concrete highly sensitive to strain rate, meaning that its mechanical behaviour depends on the speed of loading (Muthuraja et al., 2024; Najaf and Abbasi, 2023; Zhang et al., 2024). Sun et al. (2012) showed that compressive strength increased by up to 16.2% with rising strain rates in 35 MPa concrete, and that both strength and modulus were strain-rate dependent. Zhang et al. (2025) further supported these findings, reporting increased compressive and flexural strength in wet-screened concrete under high strain rates.
Experimental studies on reinforced and prestressed concrete members under low-velocity impact also confirm this rate sensitivity, showing peak-force amplification and damage localisation governed by shear capacity and reinforcement ratio (Adhikary et al., 2015; Johansson et al., 2025; Kumar et al., 2023). As indicated, concrete has limited energy-dissipation capacity and tends to fail in a brittle manner (Banthia, 1987; Lyu et al., 2024). Panel- and plate-impact studies demonstrate that modifying layer composition or introducing fibre or polymer components enhances energy absorption and residual capacity (Islam et al., 2023; Jacobsen et al., 2025). As a result, under extreme loading, structural design is often over-conservative, treating structures as rigid bodies and neglecting dynamic energy absorption (Liu et al., 2025). This highlights the need for ductile, energy-efficient materials or composite systems capable of dissipating energy through controlled deformation (Boddy, 2001; Hosan et al., 2025; Restrepo and Martinez, 2023).
Rubber is widely incorporated in cementitious and geopolymer systems to enhance ductility and energy dissipation (Abdelmonim and Bompa, 2021). Liu et al. (2012) showed that increasing rubber content reduced dynamic compressive strength but enhanced the Dynamic Increase Factor (DIF), with optimal performance below 10% rubber content and larger particle sizes improving energy absorption. Xu et al. (2020) reported increased energy accumulation rates under repeated loading with higher rubber content. Mujdeci et al. (2022) observed that higher rubber ratios, particularly under confinement, improved lateral strain response and energy dissipation. In one-part alkali-activated rubberised concretes, higher rubber content increased impact duration but reduced both compressive and splitting tensile strengths (Elzeadani, Bompa and Elghazouli, 2023a; 2023b). Eltayeb et al. (2021) indicated that DIF increased with rubber content, with reductions in performance typically occurring beyond 30% replacement. Drop-weight testing showed up to 250% improvement in impact energy absorption for mixes with rubber content up to 50%. Ahamed et al. (2023) examined nacre-inspired composite beams using engineered cementitious concrete layered with polyurethane (PU) interlayers serving as effective energy dissipation zones.
Viscoelastic polymers such as polyurethane (PU) and silicone have shown significant promise as energy-absorbing materials due to their high damping capacity and internal structure, making them suitable for integration in composite systems within civil engineering (Somarathna et al., 2018). The selection of energy-absorbing materials for structural applications requires a careful balance between energy absorption and transmitted stress. Fuss et al. (2015) proposed that optimal materials exhibit a high energy-density-to-stress ratio, allowing them to absorb large amounts of energy while imparting minimal force to protected structures. PU and silicone demonstrated favourable properties in this regard (Asad et al., 2023). Lampinen and Jeryan (1982), studying crash structures in the automotive sector, found that medium-density PU foams significantly improved energy absorption without necessitating geometric redesigns. Goods et al. (1997) further confirmed that dynamic energy absorption increased with foam density up to an optimum of 0.35 g/cm3, beyond which it declined.
Silicone, while often studied in conjunction with additives like polyborosiloxane gel (Zhao et al., 2020), also performs well as a standalone material due to its viscoelastic properties (Kruszewski et al., 2023). Zhao et al. (2020) indicated that damping efficiency of silicone arises from its molecular behaviour, where the stress leads the strain, demonstrating both elastic and viscous responses. This dynamic lag between stress and strain enables effective dissipation of mechanical energy. Shit and Shah (2013) also highlighted the role of the helical molecular structure and low intermolecular forces in silicone in providing high elasticity and compressibility. These characteristics contribute to its frequent use in aerospace systems for vibration damping, as silicone can rapidly distribute localised energy throughout its matrix, enhancing its ability to mitigate impact loads (Zhao et al. 2020). Other materials such as Ethylene Vinyl Acetate (EVA) showed notable energy absorption properties (Shimazaki et al., 2016).
Rubberised concrete and viscoelastic materials such as polyurethane, silicone, and ethylene vinyl acetate (EVA) are suitable as energy dissipating materials and have shown promise in enhancing the impact resistance of structural components (Goods et al., 1997; Zhao et al., 2020; Shimazaki et al., 2016). Most studies have considered rubberised concrete and viscoelastic polymers as isolated systems; however, they could be integrated in layered systems to synergistically combine the benefits of multiple materials. The behaviour and performance of layered concrete composites integrating these materials remain largely unexplored. There is a distinct lack of research into how layering of viscoelastic polymers with rubberised and normal concrete could improve energy absorption under impact loading. Direct performance comparisons between different layered configurations under controlled dynamic conditions are scarce. This presents a clear and significant research gap, particularly for applications in civil infrastructure subjected to accidental or extreme impact events.
Impact velocities below 10 m/s, classified as low-velocity impacts (Kaware et al., 2023; Kaware and Kotambkar 2024), were selected for this study, while medium-velocity impacts are typically defined within the range of 10–50 m/s (Banhart et al., 2024). Such low-velocity impacts are representative of loading scenarios relevant to civil engineering catch wall systems subjected to rockfall or adjacent slope failure. Rock blocks typically undergo repeated bouncing, sliding, and rolling interactions along the slope before reaching protective infrastructure, during which a significant portion of the kinetic energy is dissipated. Consequently, the impact velocities experienced by roadside protection systems are often reduced to the lower velocity range, making low-velocity testing an appropriate representation of the dynamic loading conditions associated with these structures (Volkwein et al., 2011).
This study addresses that gap by developing and testing innovative layered polymer concrete composites designed to enhance impact resistance, with potential application in crash barriers or catch walls. The work includes the design and testing of constituent materials and layered composites under quasi-static and low-velocity impact conditions, quantification of peak force reduction, impulse efficiency, and energy absorption characteristics, as well as the development of an equation to describe the energy-absorbing behaviour of the selected composite system.
Materials and methods
In this section, the overall methodology implemented in this research is presented. The section includes the sample preparation details, which are followed by the description of the testing procedures, including the testing apparatus adopted to perform both the reference quasi-static compressive strength tests, and the impact loading at different velocities on cylindrical samples.
Material and specimen preparation
This section presents the materials, specimen fabrication, and testing procedures used to evaluate the impact performance of layered concrete composites with viscoelastic interlayers. Normal Concrete (NC) and Rubberised Concrete (RC) mixes were prepared using standardised constituents, with RC incorporating 15% rubber aggregate replacement. A rubber aggregate replacement level of 15% was selected to mitigate the inherent brittleness of concrete and enhance its energy absorption capacity while maintaining a compressive strength comparable to that of the standard C25/30 mix commonly used in catch wall infrastructure. Previous studies have shown that rubber replacement levels in the range of 10-15% provide effective energy dissipation while maintaining acceptable reductions in mechanical strength. Higher replacement ratios tend to significantly degrade mechanical properties while offering diminishing improvements in energy absorption and dissipation (Elzeadani et al., 2023a; Xu et al., 2020). Polyurethane (PU) and silicone (SI) were selected as intermediate energy-absorbing layers based on their workability and mechanical properties. After describing the manufacturing procedures, the testing ranges, instrumentation and data processing are presented.
Constituents
The constituents used for the Normal Concrete (NC) mix included standardised materials, sand, cement, aggregates, and water (Figure 1). The cement, CEM II/A-L 42.5 N, produced by Blue Circle, complied with BS EN 197-1. Its specific gravity (SG) was taken as 3.15, as per manufacturer datasheets. The fine (0–5 mm) and coarse (5–10 mm) aggregates (Travis Perkins, 2025) conformed to BS EN 12620 and were dried at ambient temperature for at least 1 week. The water absorption of the fine and coarse aggregates was 2 % and 1 %, respectively. The aggregates were sieved and assessed against the grading limits specified in the standard (Figure 1), with an assumed SG of 2.6 (CEN, 2004). The Rubberised Concrete (RC) mix used the same constituents as the NC mix, except that part of the aggregate was replaced by rubber particles derived from waste tyres (Figure 1), limited to 10 mm to match the mineral aggregate grading. (a) Gradation curve (b) Concrete constituents.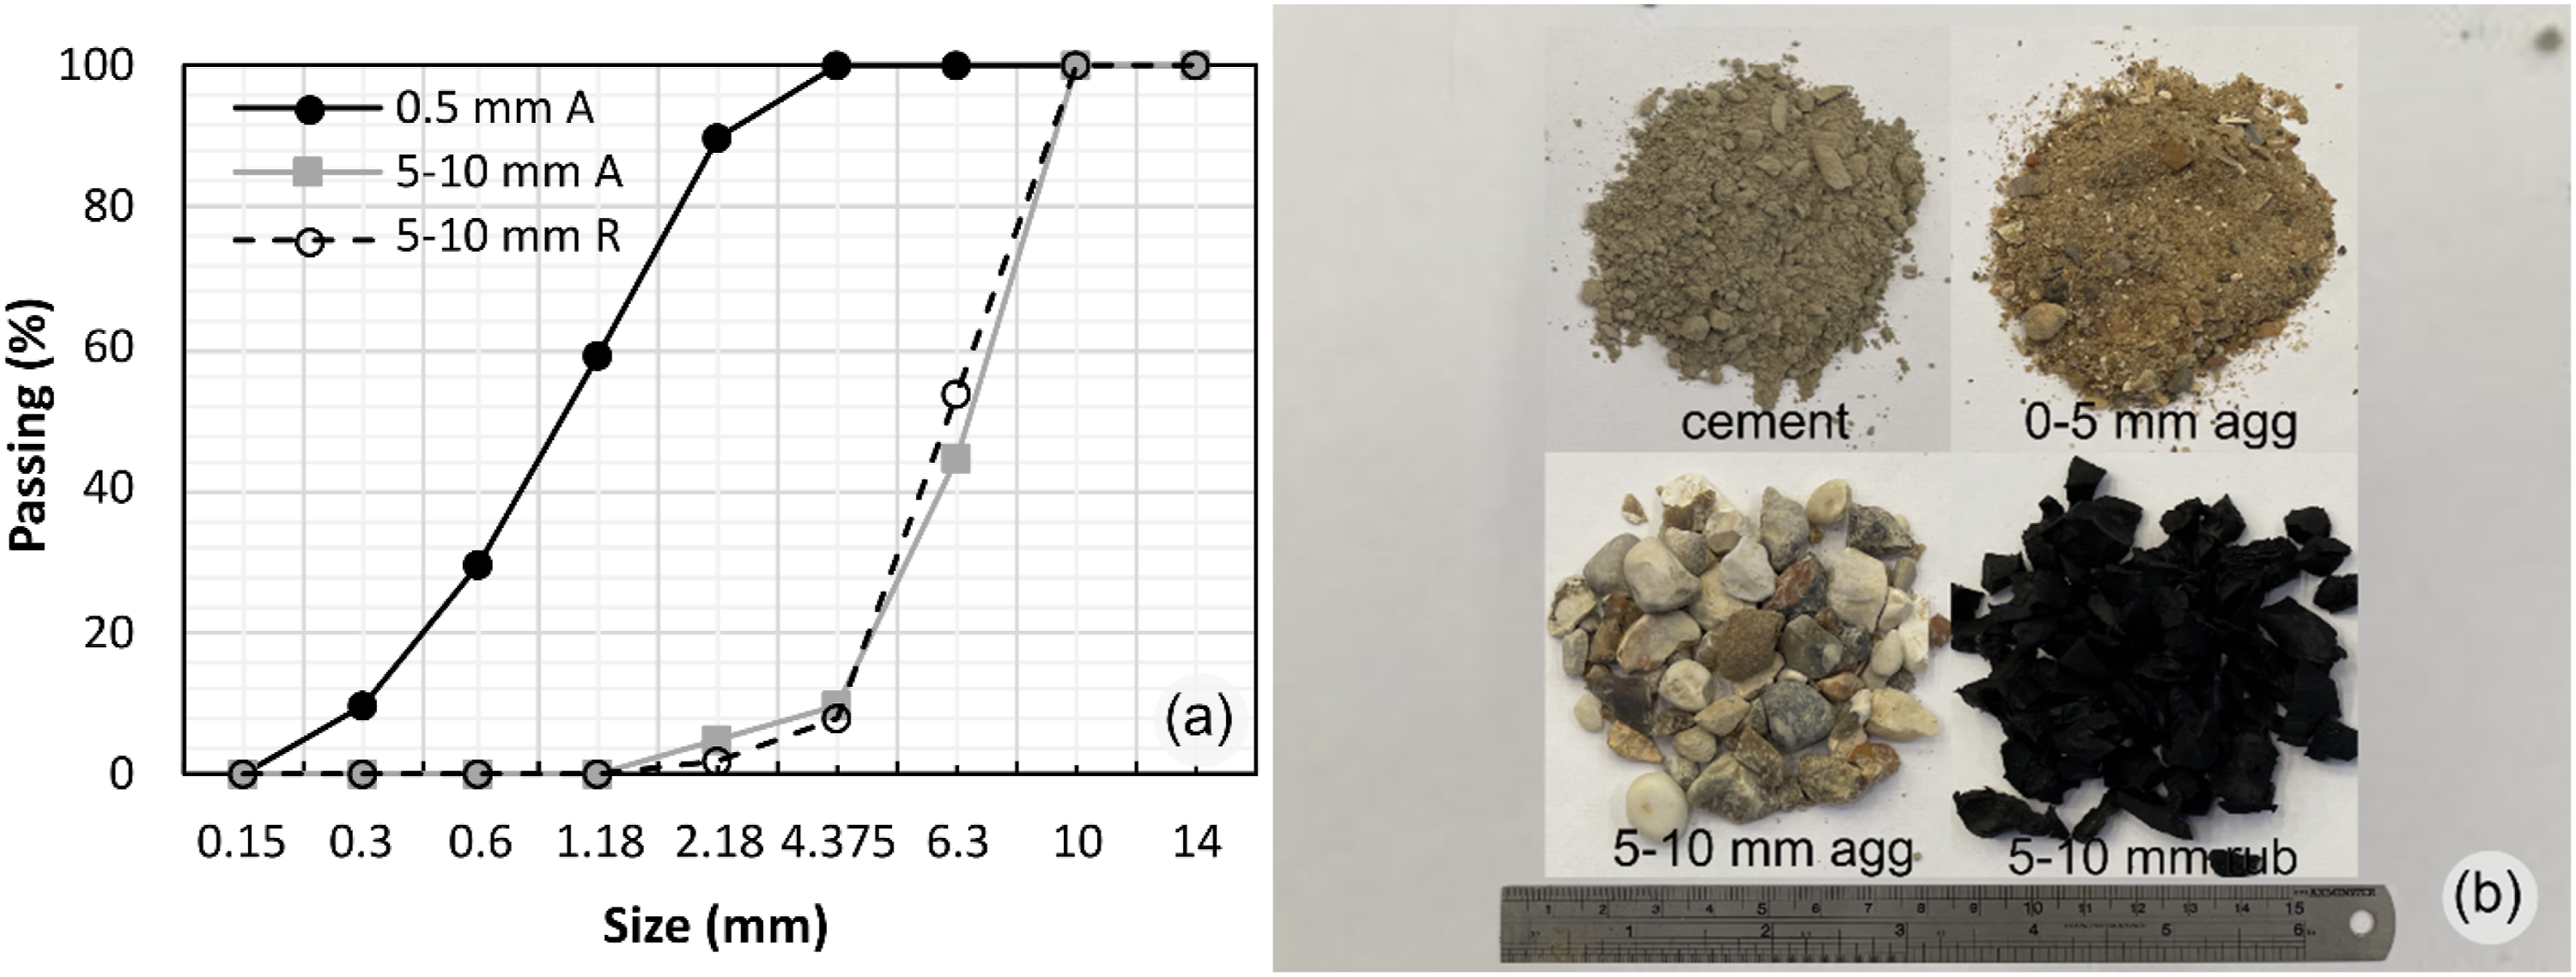
Mix design details.
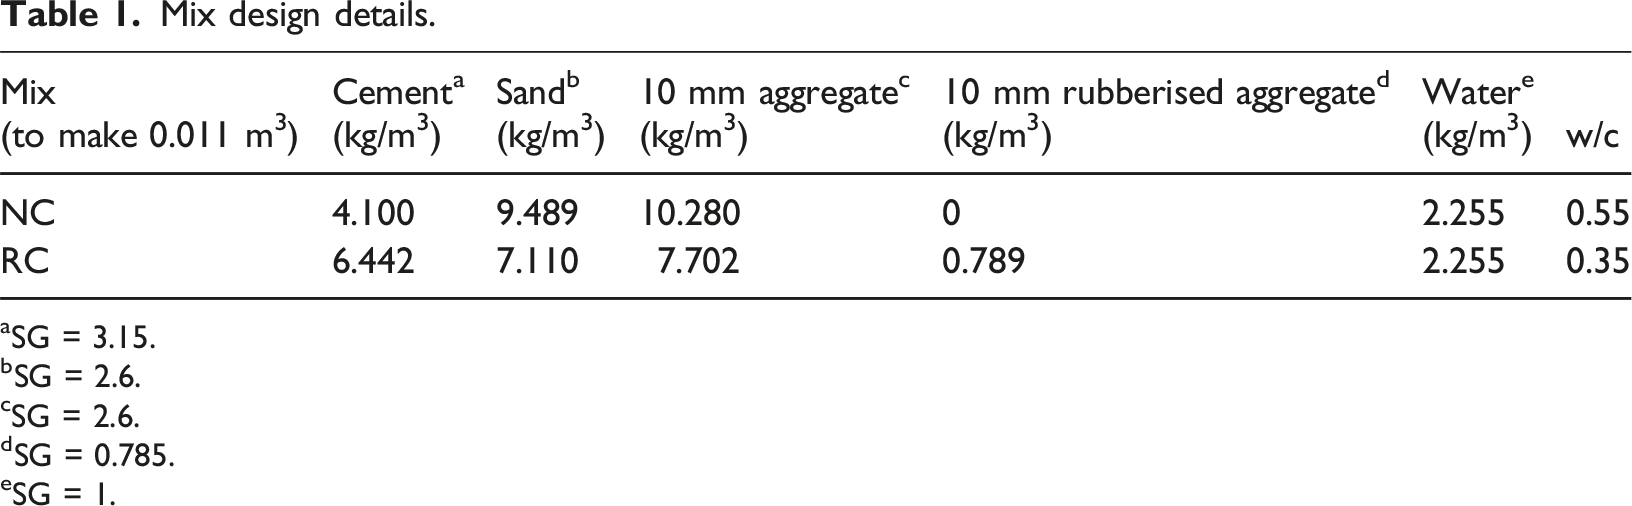
aSG = 3.15.
bSG = 2.6.
cSG = 2.6.
dSG = 0.785.
eSG = 1.
To achieve a layering configuration with enhanced energy absorption capacity, this study involved the systematic selection of energy-absorbing materials suitable for layered composite systems in catch wall applications. Based on initial evaluations, polyurethane (PU) foam and silicone (SI) rubber were chosen due to their favourable workability and ease of manufacturing. The PU foam used was an expanding insulation product, with data sourced from Soudal (2020). In its uncured state, the foam is thixotropic, becoming less viscous under stress and reverting to its original state when undisturbed. The foam cured through a moisture-activated mechanism, similar to concrete, with a full cure time of 55 minutes. The cured foam exhibited a free density of 0.38 g/cm3, within 8.5% of the optimum 0.35 g/cm3 (Goods et al., 1997). Manufacturer mechanical properties included a compressive strength of 0.022 MPa, shear strength of 0.028 MPa, and tensile strength of 0.07 MPa. The product was supplied as a single component, requiring no additional mixing, though agitation prior to use was recommended to ensure even distribution of the binder and catalyst.
The silicone rubber (PR 410/20), as specified by Primasil Silicones Ltd (2022), was a platinum-catalysed formulation, promoting rapid cross-linking and reduced shrinkage. The recommended cure time was approximately 4 hours. The cured product had a shore A hardness of 20, which ASTM International (2023) associates with an approximate compressive strength of 1.0 MPa. Manufacturer-reported properties include a density of 1.09 g/cm3, tensile strength of 6 MPa, and tear strength of 15 kN/m. Supplied as a binary system with a 1:1 mix ratio, the product required thorough mixing to achieve a uniform colour and the removal of entrapped air via vibration.
Specimen details and manufacturing
Specimen details.
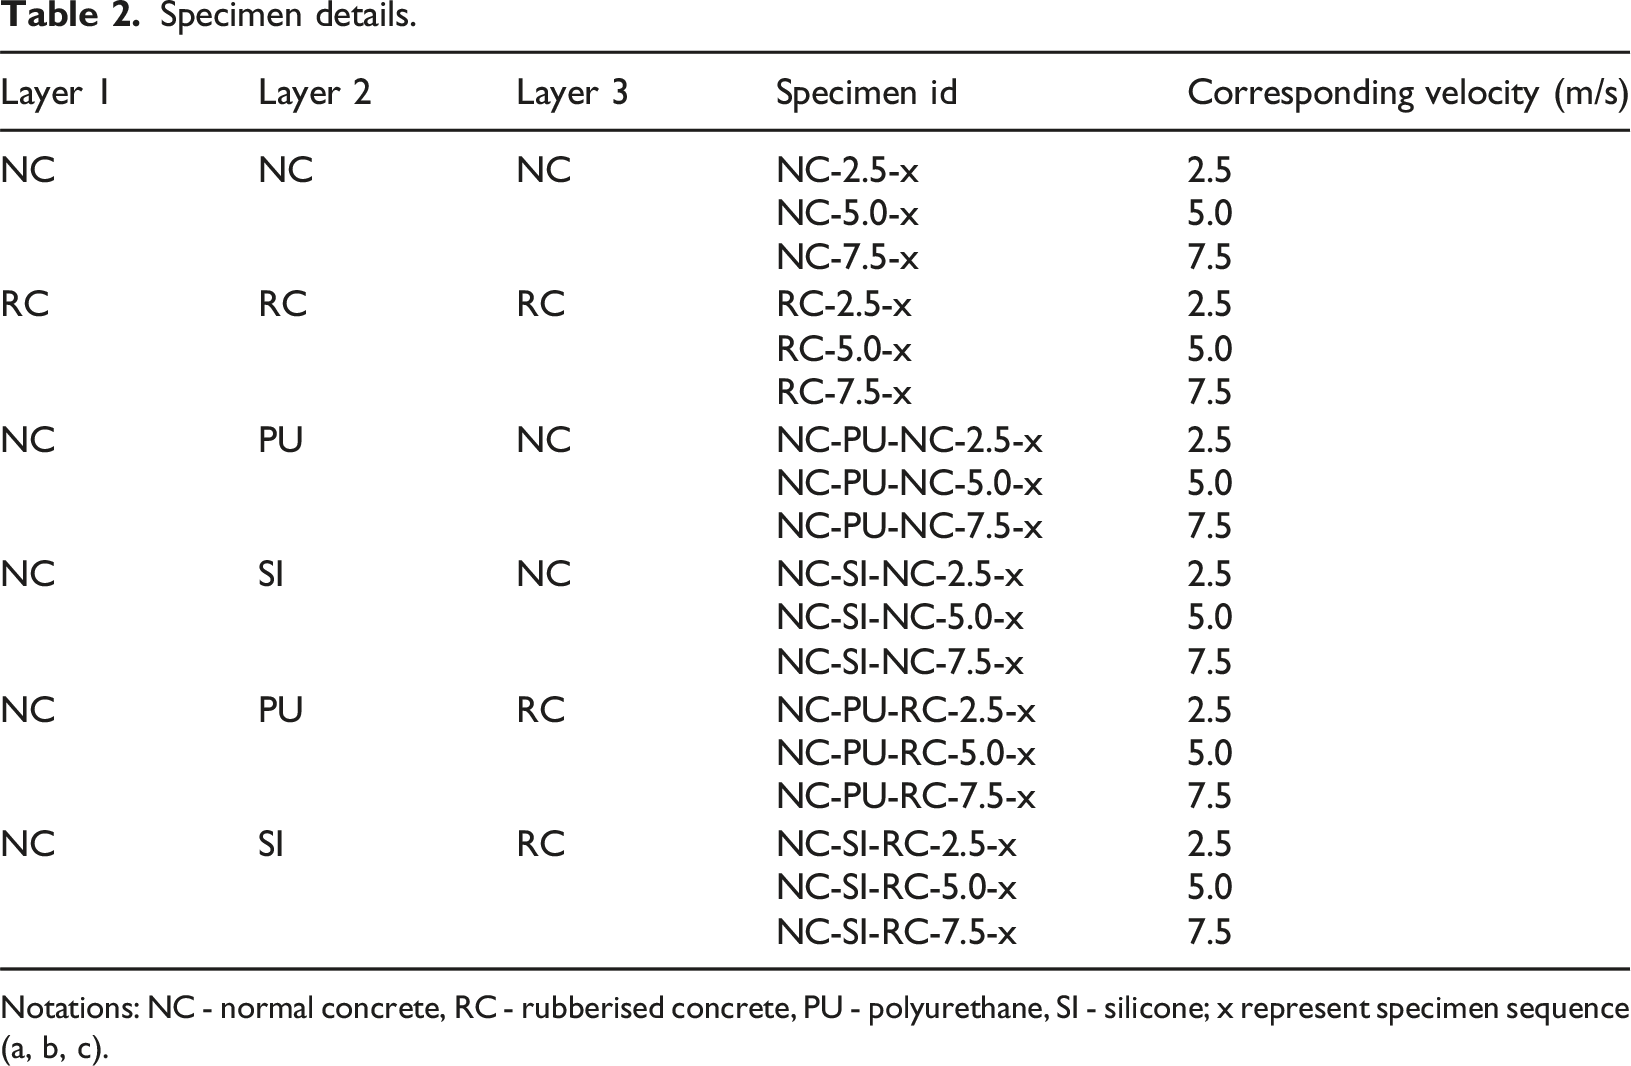
Notations: NC - normal concrete, RC - rubberised concrete, PU - polyurethane, SI - silicone; x represent specimen sequence (a, b, c).
For the concrete materials, all constituents were weighed and batched as shown in Table 1 and mixed using an 56L concrete mixer. To ensure consistency, a single cement batch was used, and the mixing drum was wiped dry between pours to maintain precise water-cement ratios. Aggregate size was limited to 10 mm to mitigate uneven stress distributions and size effects. The drum was pre-wetted to minimise potential influence on the water/cement (w/c) ratio. All mineral aggregates (sand and 10 mm gravel) and half of the mixing water were first blended in the mixer for 1 minute. For RC, rubber particles were then introduced and mixed with the aggregates and water for a further 1 minute. Subsequently, the cement and the remaining water were added, and the entire mixture was blended for at least an additional 5 minutes (Bompa et al., 2017).
In accordance with BS EN 12390-2:2019, mixing continued until a uniform consistency was achieved. The mixer was thoroughly cleaned between batches using water, a wire brush, and damp cloths, and excess moisture was removed with paper towels. A minimum of four 100 mm cubes were cast for both NC and RC to evaluate 28-day compressive strength in accordance with BS EN 12390-2:2019.
The mixes were cast into 100 mm3 compressive strength cube moulds, which were greased beforehand to facilitate de-moulding. Casting was conducted in two stages: initially, each mould was filled to two-thirds of its height and placed on a vibration table, where it was compacted for the minimum duration necessary until large air bubbles ceased to appear, in accordance with BS EN 12390-3:2019 (BSI, 2025). Following compaction, the mould content settled to approximately half its height. The remaining volume was then filled with concrete from the same batch and subjected to a second round of vibration until no visible air bubbles remained. Moulds were subsequently covered with a polyethylene (PE) sheet to minimise moisture loss and placed in a controlled environment at 60% relative humidity and 16.5°C. After 7 days, specimens were de-moulded and transferred to a water tank, where they remained undisturbed for continued curing until the 28-day testing period.
Although BS EN 12390-2:2019 does not specify dimensions for impact testing, specimens were prepared in accordance with it. Specifically, the standard requires cylinder specimens to maintain an aspect ratio within the range of 2 ≤ L/d ≤ 4. Since the impactor head of the Instron 9450 drop-weight machine was limited to 50 mm in diameter, specimens were designed with a diameter of 50 mm and a length of 100 mm to ensure uniform load distribution. For each specimen type (i.e. NC-SI-NC and RC), nine samples were prepared to permit three tests at three defined velocities, resulting in 54 impact specimens. An additional nine silicone cylinders were produced to characterise their mechanical properties. A view of the sample configurations evaluated is shown in Figure 2. View of sample configurations: (a) normal concrete (NC), rubberised concrete (RC), normal concrete - polyurethane - normal concrete (NC-PU-NC), normal concrete - polyurethane - rubberised concrete (NC-PU-RC), normal concrete - silicone - normal concrete (NC-SI-NC), normal concrete - silicone - rubberised concrete (NC-SI-RC).
Mould fabrication was required prior to casting. Polyvinyl chloride (PVC) pipes with an internal diameter of 50 mm were cut into lengths of 34 mm and 101 mm using a fixed circular saw and backstop. A total of 162 × 34 mm and 18 × 101 mm lengths were cut and sanded to final dimensions of 33 mm and 100 mm, respectively. The 100 mm lengths were fixed to plywood boards using caulk, which were cleaned to remove surface contaminants. Similarly, 108 of the 162 × 33 mm lengths were secured to plywood using the same method.
Casting was conducted in two stages, with vibration applied before and after the second stage in accordance with manufacturing standards BS EN 12350-3:2022 (BSI, 2022). Specimens are covered with polyethylene (PE) sheets and cured for 7 days. The impact specimens remained in the moulds beyond this period. The 33 mm mould sections were later removed from the plywood using a scalpel to detach the caulking. Two 33 mm segments were joined at their flat ends using a third 33 mm segment as a central cavity. A small hole was drilled into the centre piece, into which the energy-absorbing material (silicone or PU) was poured. Air bubbles were eliminated by tapping, and curing was conducted under the same conditions as the concrete cubes.
Testing procedures
Cube tests were carried out in a Controls Automax machine using the guidance from BS EN 12390-4:2025. The impact tests were conducted using the Instron 9450 drop tower (Figure 3), which has an energy capacity of 0.59-1800 J and a velocity range of 0.77–24 m/s. Test velocities of 2.5 m/s, 5.0 m/s, and 7.5 m/s were selected based on the relationship between concrete compressive strength and impact energy. These ranges provide insight into the energy-absorbing capacity of layered composites relative to cement-based materials for practical applications. The selected velocities fall within the low-velocity regime defined by Banhart et al. (2024). These velocity ranges replicate typical impact velocities of rockfall loading on catch walls (Volkwein et al., 2011). These parameters were specifically calculated to span the expected failure range of the specimens, allowing for a comprehensive evaluation of peak force reduction and momentum transfer efficiency across different composite configurations. Specimen IDs and testing parameters are summarised in Table 2. Testing configuration: (a) general view of the drop weight impact machine, (b) close up of the tup, striker and impact head, (c) close up of sample, support and impactor.
Prior to testing, a full inspection of the Instron 9450 system was carried out to ensure the mechanical integrity and functionality of components, including sensors, bolts, and safety interlocks. The system was operated via Bluehill Impact software v4.22 (Instron, 2024), where test parameters, drop height, impact velocity, striker geometry, and mass, were configured using internal presets. The impactor and mass were mounted securely and re-checked every three tests. Force and displacement sensors were calibrated using built-in software routines and reference data to ensure measurement accuracy.
Specimens were mounted using an adjustable-height support. Alignment beneath the impactor was ensured through three-sided visual inspection and cross-validated by measurements. Once the drop weight was elevated to the specified height and safety checks were completed, the impact tests were initiated through the software interface. Real-time force, displacement, and energy data were recorded during each test. Measurements were acquired via the integrated instrumentation system of the drop tower. Force was measured using a strain-gauge load cell; acceleration was derived from the force and known mass, with velocity and displacement obtained through numerical integration using the procedures given in the machine manual (Instron, 2024). Strain gauges were not employed in the present study because they provide measurements at discrete, localised points, which may not adequately capture the heterogeneous strain distribution and complex cracking behaviour typically observed in concrete (Li and Wu, 2023). For selected tests, specimen shortening was estimated from high-speed camera recordings by measuring the vertical pixel distance between specimen boundaries in sequential frames and converting the change to displacement using spatial calibration (Pan et al., 2009).
Experimental uncertainty arose primarily from five sources: (i) specimen preparation, including batching, compaction, curing, and dimensional tolerances; (ii) material heterogeneity, particularly in rubberised concrete and polyurethane foam; (iii) test set-up, including specimen positioning and striker alignment; (iv) instrumentation, notably load-cell and displacement measurement accuracy; and (v) data reduction, including sampling rate and selection of representative average curves. To mitigate these effects, all concrete specimens were prepared and cured in accordance with BS EN 12390-2, using consistent batching, mould filling, vibration, curing, and handling procedures (BSI, 2019). Prior to impact testing, the drop-weight tower, impactor, sensors, and safety systems were inspected and verified, and specimen alignment was checked visually from multiple sides before each test. Repeated tests were performed for each configuration, and the resulting scatter was quantified using standard deviation and coefficient of variation, consistent with established approaches to test precision and repeatability. It is further noted that, at 7.5 m/s, some homogeneous concrete specimens reached the load-cell capacity, which may have truncated the true peak force and should therefore be considered when interpreting comparative results at the highest impact level.
Results and discussion
This section examines the mechanical response of normal concrete (NC), rubberised concrete (RC), and layered composite specimens under quasi-static and low-velocity impact conditions. It presents compressive strength results for NC and RC cubes, followed by detailed impact testing results of cylindrical specimens for the six configurations described previously and depicted in Table 2. Parameters evaluated include peak force, time to peak, peak displacement, measured and effective impulse, absorbed energy, and momentum transfer efficiency. The results quantify the influence of rubber aggregates and viscoelastic interlayers (PU and SI) on impact performance, with particular focus on energy dissipation, structural integrity, and strain-rate sensitivity for the tested ranges. In this paper, the energy dissipation corresponds with the area under the force-displacement curve, which serves as a response measure of the configuration’s capacity to dissipate energy. This approach provides a direct and physically meaningful assessment of the energy absorption potential of the tested systems.
Concrete strength properties
Cconcrete compressive test results.
Rubberised Concrete (RC) specimens were prepared and tested using the same procedure as the NC specimens. The average density was 2271 kg/m3, representing a 2.3% reduction compared to the NC specimens, consistent with the 15% aggregate replacement with rubber. The average compressive strength was 32.9 MPa. The standard deviation for the RC specimens was 3.93 MPa, leading to a CoV of 11.96%, which indicates greater variability relative to the NC specimens. The average compressive strengths for both NC and RC exceeded the minimum requirement of 30 MPa meeting the design strengths described in the section describing the methods. The main data is available in Table 3.
Ovearll impact tests results
Force-time data were collected and processed using a custom script. The script calculated the average peak force and the corresponding time to peak, then determined the time steps at which the force reached 1% of the peak value on either side of the curve. For example, with peak forces of 150 N, 300 N, and 200 N, the script located the corresponding time steps for 1.5 N, 3 N, and 2 N, and averaged them to construct a representative curve. The processed results were synthesised to interpret the behaviour of each sample type. All specimens, including NC, RC, NC-PU-NC, NC-PU-RC, NC-SI-NC, and NC-SI-RC, were weighed prior to testing and subjected to their designated impact velocities.
Test results.
Concrete samples
Impact testing of the NC specimens, NC-2.5-(a, b, c), NC-5.0-(a, b, c), and NC-7.5-(a, b, c), showed a clear correlation between increased impact velocity and peak force (Figure 4(a)–(c)). The failure characteristics are shown in Figure 4(d). At 2.5 m/s, NC specimens exhibited no naked eyer visible damage (Figure 4(d)), with an average peak force of 20.11 kN and an impulse of 19.29 kNms (Figure 4(a)). At 5.0 m/s, localised failure was observed in all NC specimens (Figure 4(d)), and the load cell reached its capacity limit of 47.15 kN during the second test (Figure 4(b)). Although the actual peak force likely exceeded this value, 47.15 kN was adopted as the maximum measurable force. A 90.1% increase in impulse was recorded between 2.5 m/s and 5.0 m/s. However, at 7.5 m/s, impulse decreased by 44%, corresponding with total specimen failure and loss of energy absorption capacity (Figure 4(c)). The time to peak force was also approximately four times shorter than at lower velocities, indicating brittle failure behaviour. Force - time curves for: (a) NC-2.5, (b) NC-5.0, (c) NC-7.5, (d) representative NC samples after testing.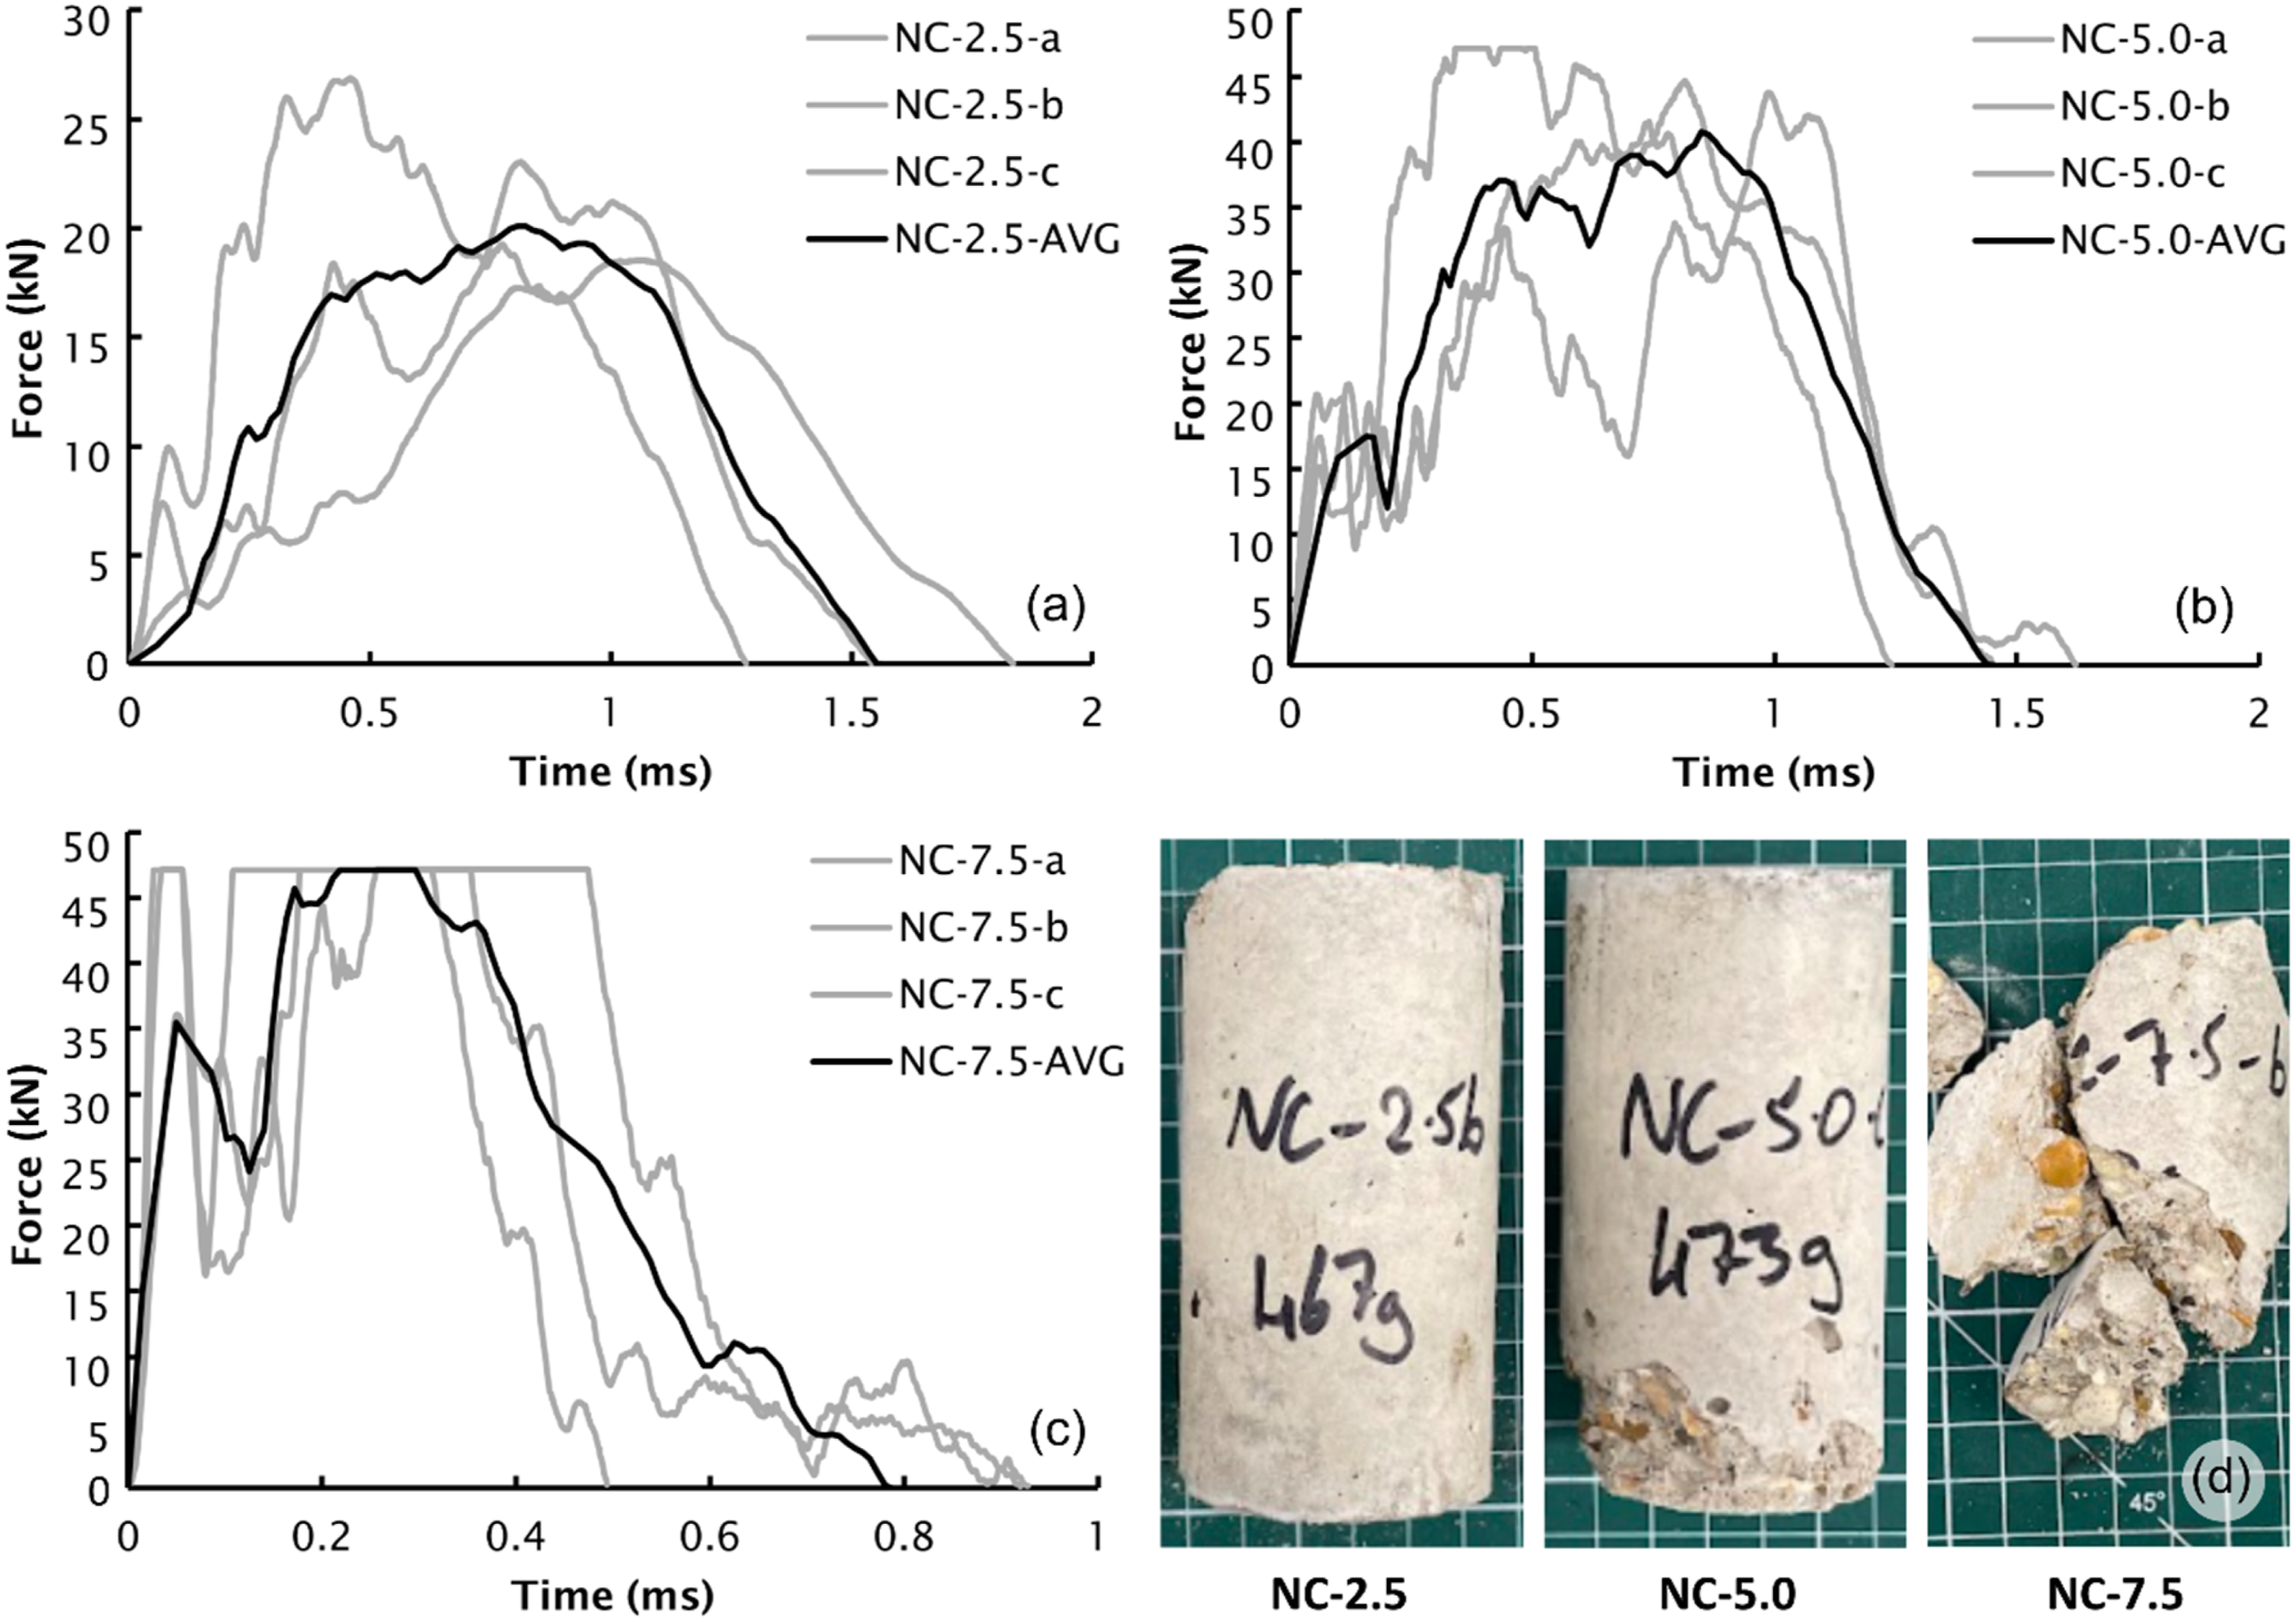
RC specimens exhibited a similar response pattern. At 2.5 m/s, they reached an average peak force of 21.09 kN and an impulse of 18.03 kNms (Figure 5(a)). At 5.0 m/s, the average peak force was 47.13 kN, and the impulse was 38.61 kNms (Figure 5(b)). At 7.5 m/s, the load cell again reached its maximum limit (Figure 5(c)), and the specimens failed completely (Figure 5dc). Compared to NC, RC specimens showed slightly better consistency in force-time curves and a 5.7% higher impulse at 5.0 m/s. Additionally, RC samples demonstrated marginally reduced local damage. Given that all specimens failed at 7.5 m/s, the 5.0 m/s condition serves as the most meaningful for assessing the energy absorption benefits of rubber aggregate incorporation. Force - time curves for: (a) RC-2.5, (b) RC-5.0, (c) RC-7.5, (d) representative RC samples after testing.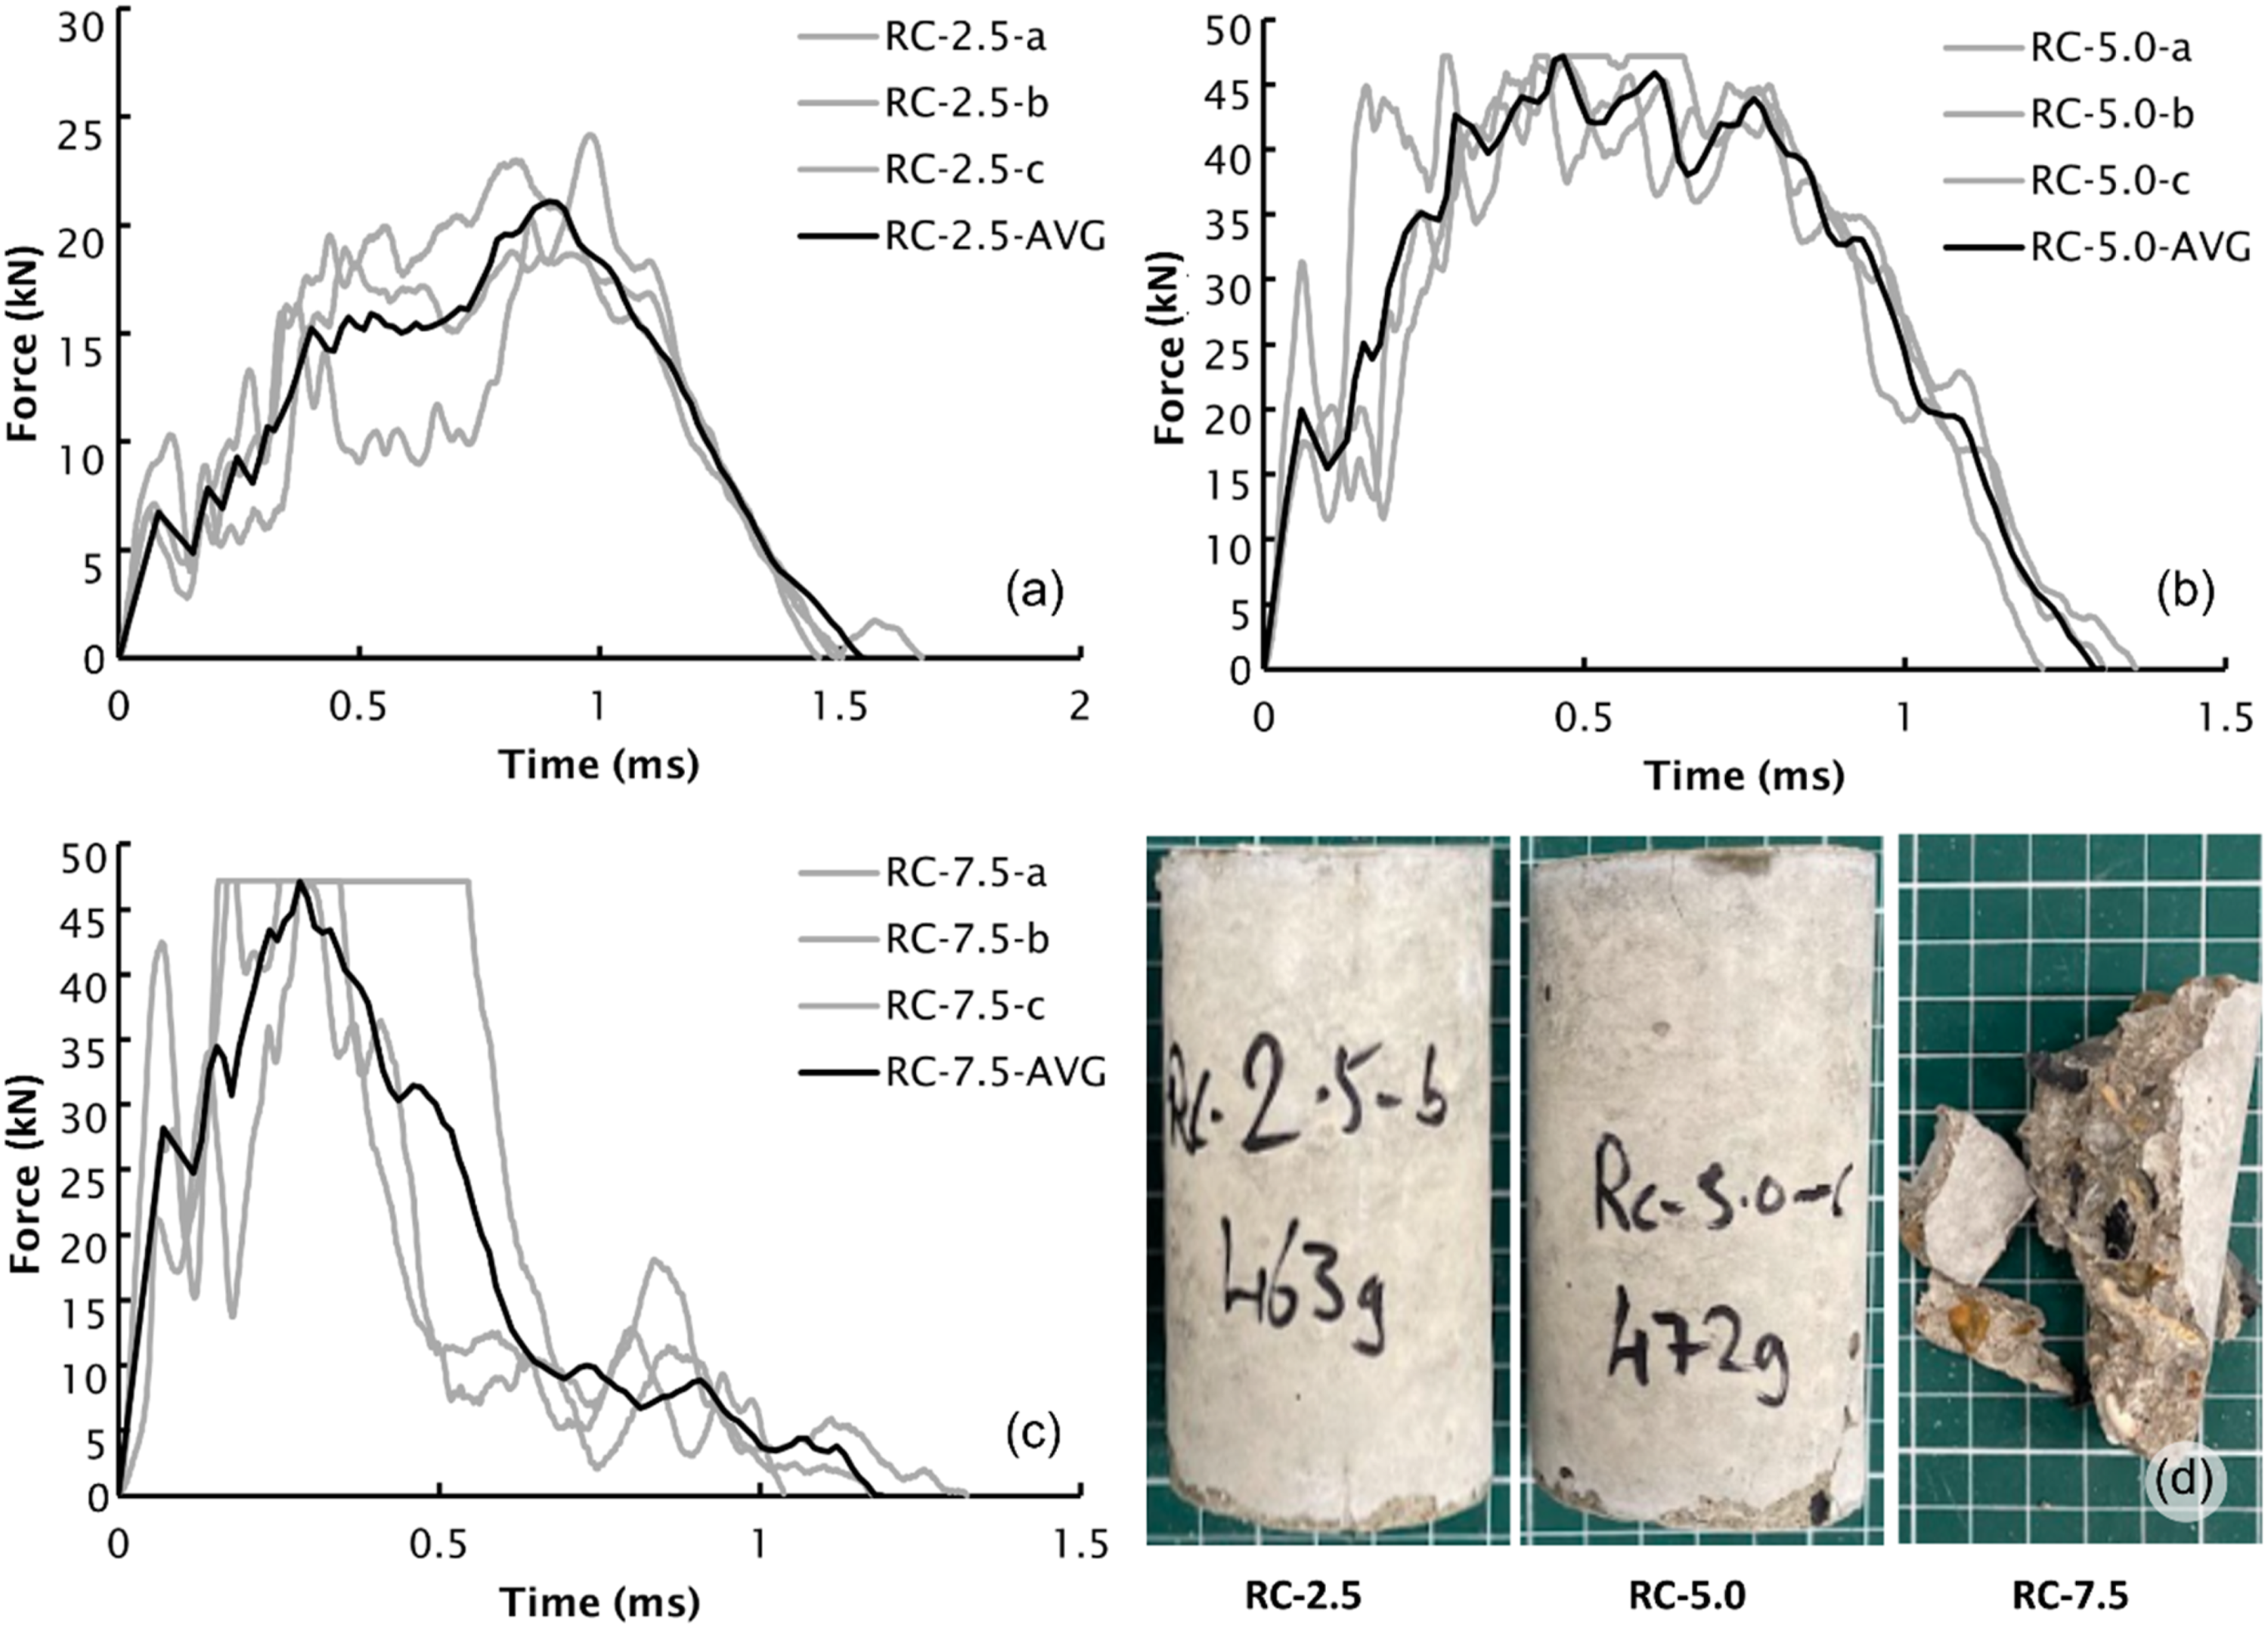
Composites with PU or SI core and NC external layers
The first composite system incorporating an energy-absorbing layer was the NC-PU-NC configuration. The main results are in Figure 6(a)–(c) and failure patterns in Figure 6(d). At 2.5 m/s, specimens recorded a peak force of 3.08 kN with a time to peak of 9.01 ms (Figure 6(a)). The time to peak refers to the time measured from the instant of the impact to the instant of the recorded peak force. Compared to NC-2.5-AVG samples, this represented an 84.7% reduction in peak force and a 1197.4% increase in total impact duration (20.13 ms vs 1.55 ms). Visual inspection indicated no cracking in the concrete layers and no permanent deformation of the PU interlayer (Figure 6(d)). At 5.0 m/s, the average peak force was 20.45 kN, reflecting a 49.85% reduction relative to the NC-5.0 samples (Figure 6(b)), and the time to peak increased by 302.1%. The impulse measured was 37.97 kNms, 4% higher than the NC equivalent. However, using the impulse-to-peak force ratio, as discussed by Montgomery and Runger (2014), the momentum transfer efficiency nearly doubled. Additionally, physical damage resembled that seen in NC-2.5 specimens, further supporting the improved energy dissipation characteristics (Figure 6(d)). At 7.5 m/s, specimens experienced complete failure (Figure 6(d)), yet the peak force was 32.35% lower than in NC-7.5 specimens, and the impulse increased by 96.8%. The corresponding momentum transfer efficiency coefficient was 2.908, indicating that absorber systems became more effective at dissipating momentum under higher impact energies, even when structurally compromised. Force - time curves for: (a) NC-PU-NC-2.5, (b) NC-PU-NC-5.0, (c) NC-PU-NC-7.5, (d) representative NC-PU-NC samples after testing.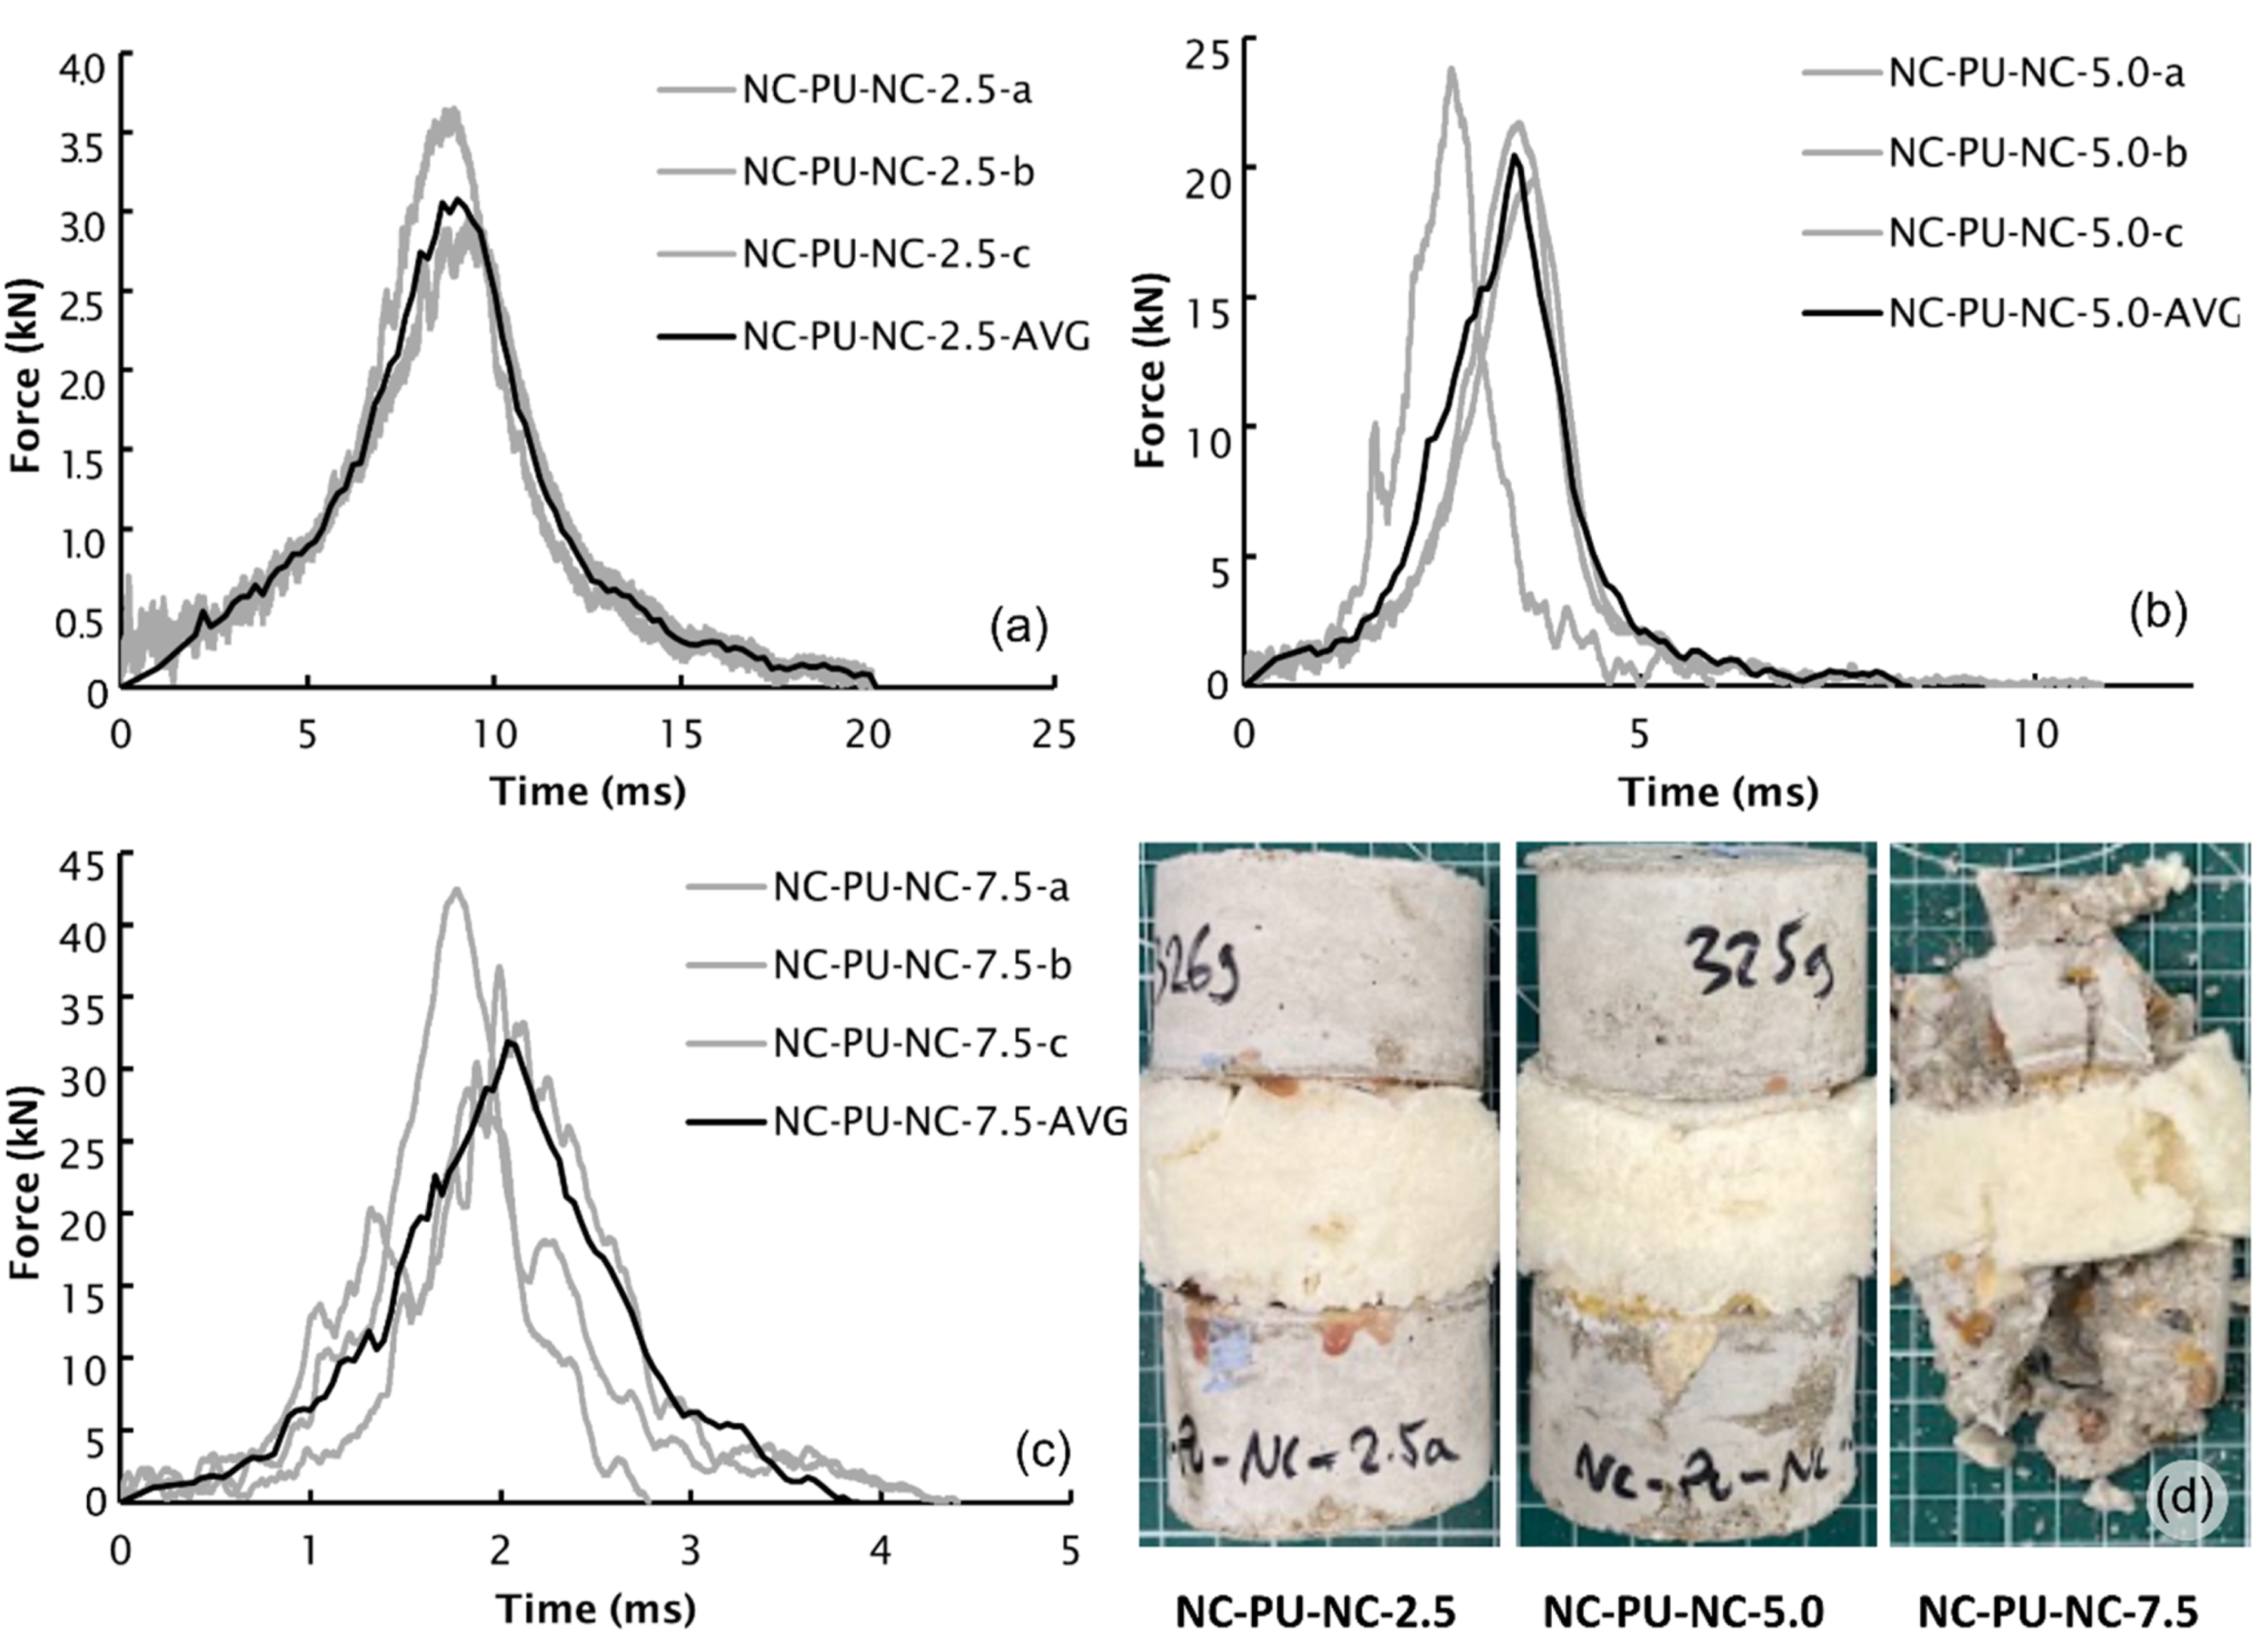
The results of the second configuration tested, NC-SI-NC, and failure characteristics are shown in Figure 7. At 2.5 m/s, the average peak force was 2.87 kN, a reduction of 85.71% compared to NC-2.5 specimens, with a measured impulse of 21.31 kNms (Figure 7(a)). This corresponds to a 10.96% and 15.46% increase in impulse compared to the NC and NC-PU-NC systems, respectively. The momentum transfer efficiency coefficient was 1.26 relative to NC-PU-NC and 1.46 relative to NC. At 5.0 m/s, NC-SI-NC specimens showed a peak force of 13.27 kN and an impulse of 37.51 kNms, resulting in a peak force reduction of 67.45% and 35.11% compared to NC-5.0 and NC-PU-NC-5.0 samples, respectively (Figure 7(b)). The momentum transfer efficiency coefficients were 3.07 and 1.76, respectively. At 7.5 m/s, the system recorded a peak force of 24.44 kN, a time to peak of 2.08 ms, and an impulse of 49.09 kNms (Figure 7(c)). Although the NC-7.5 specimens reached the upper limit of the load cell, the measured 48.16% peak force reduction is likely conservative. The momentum transfer efficiency was 4.61 compared to NC and 1.64 compared to NC-PU-NC. Visually, the NC-SI-NC system sustained the least damage (Figure 7(d)), remaining structurally intact after impact at 7.5 m/s. Force - time curves for: (a) NC-SI-NC-2.5, (b) NC-SI-NC5.0, (c) NC-SI-NC-7.5, (d) representative NC-SI-NC samples after testing.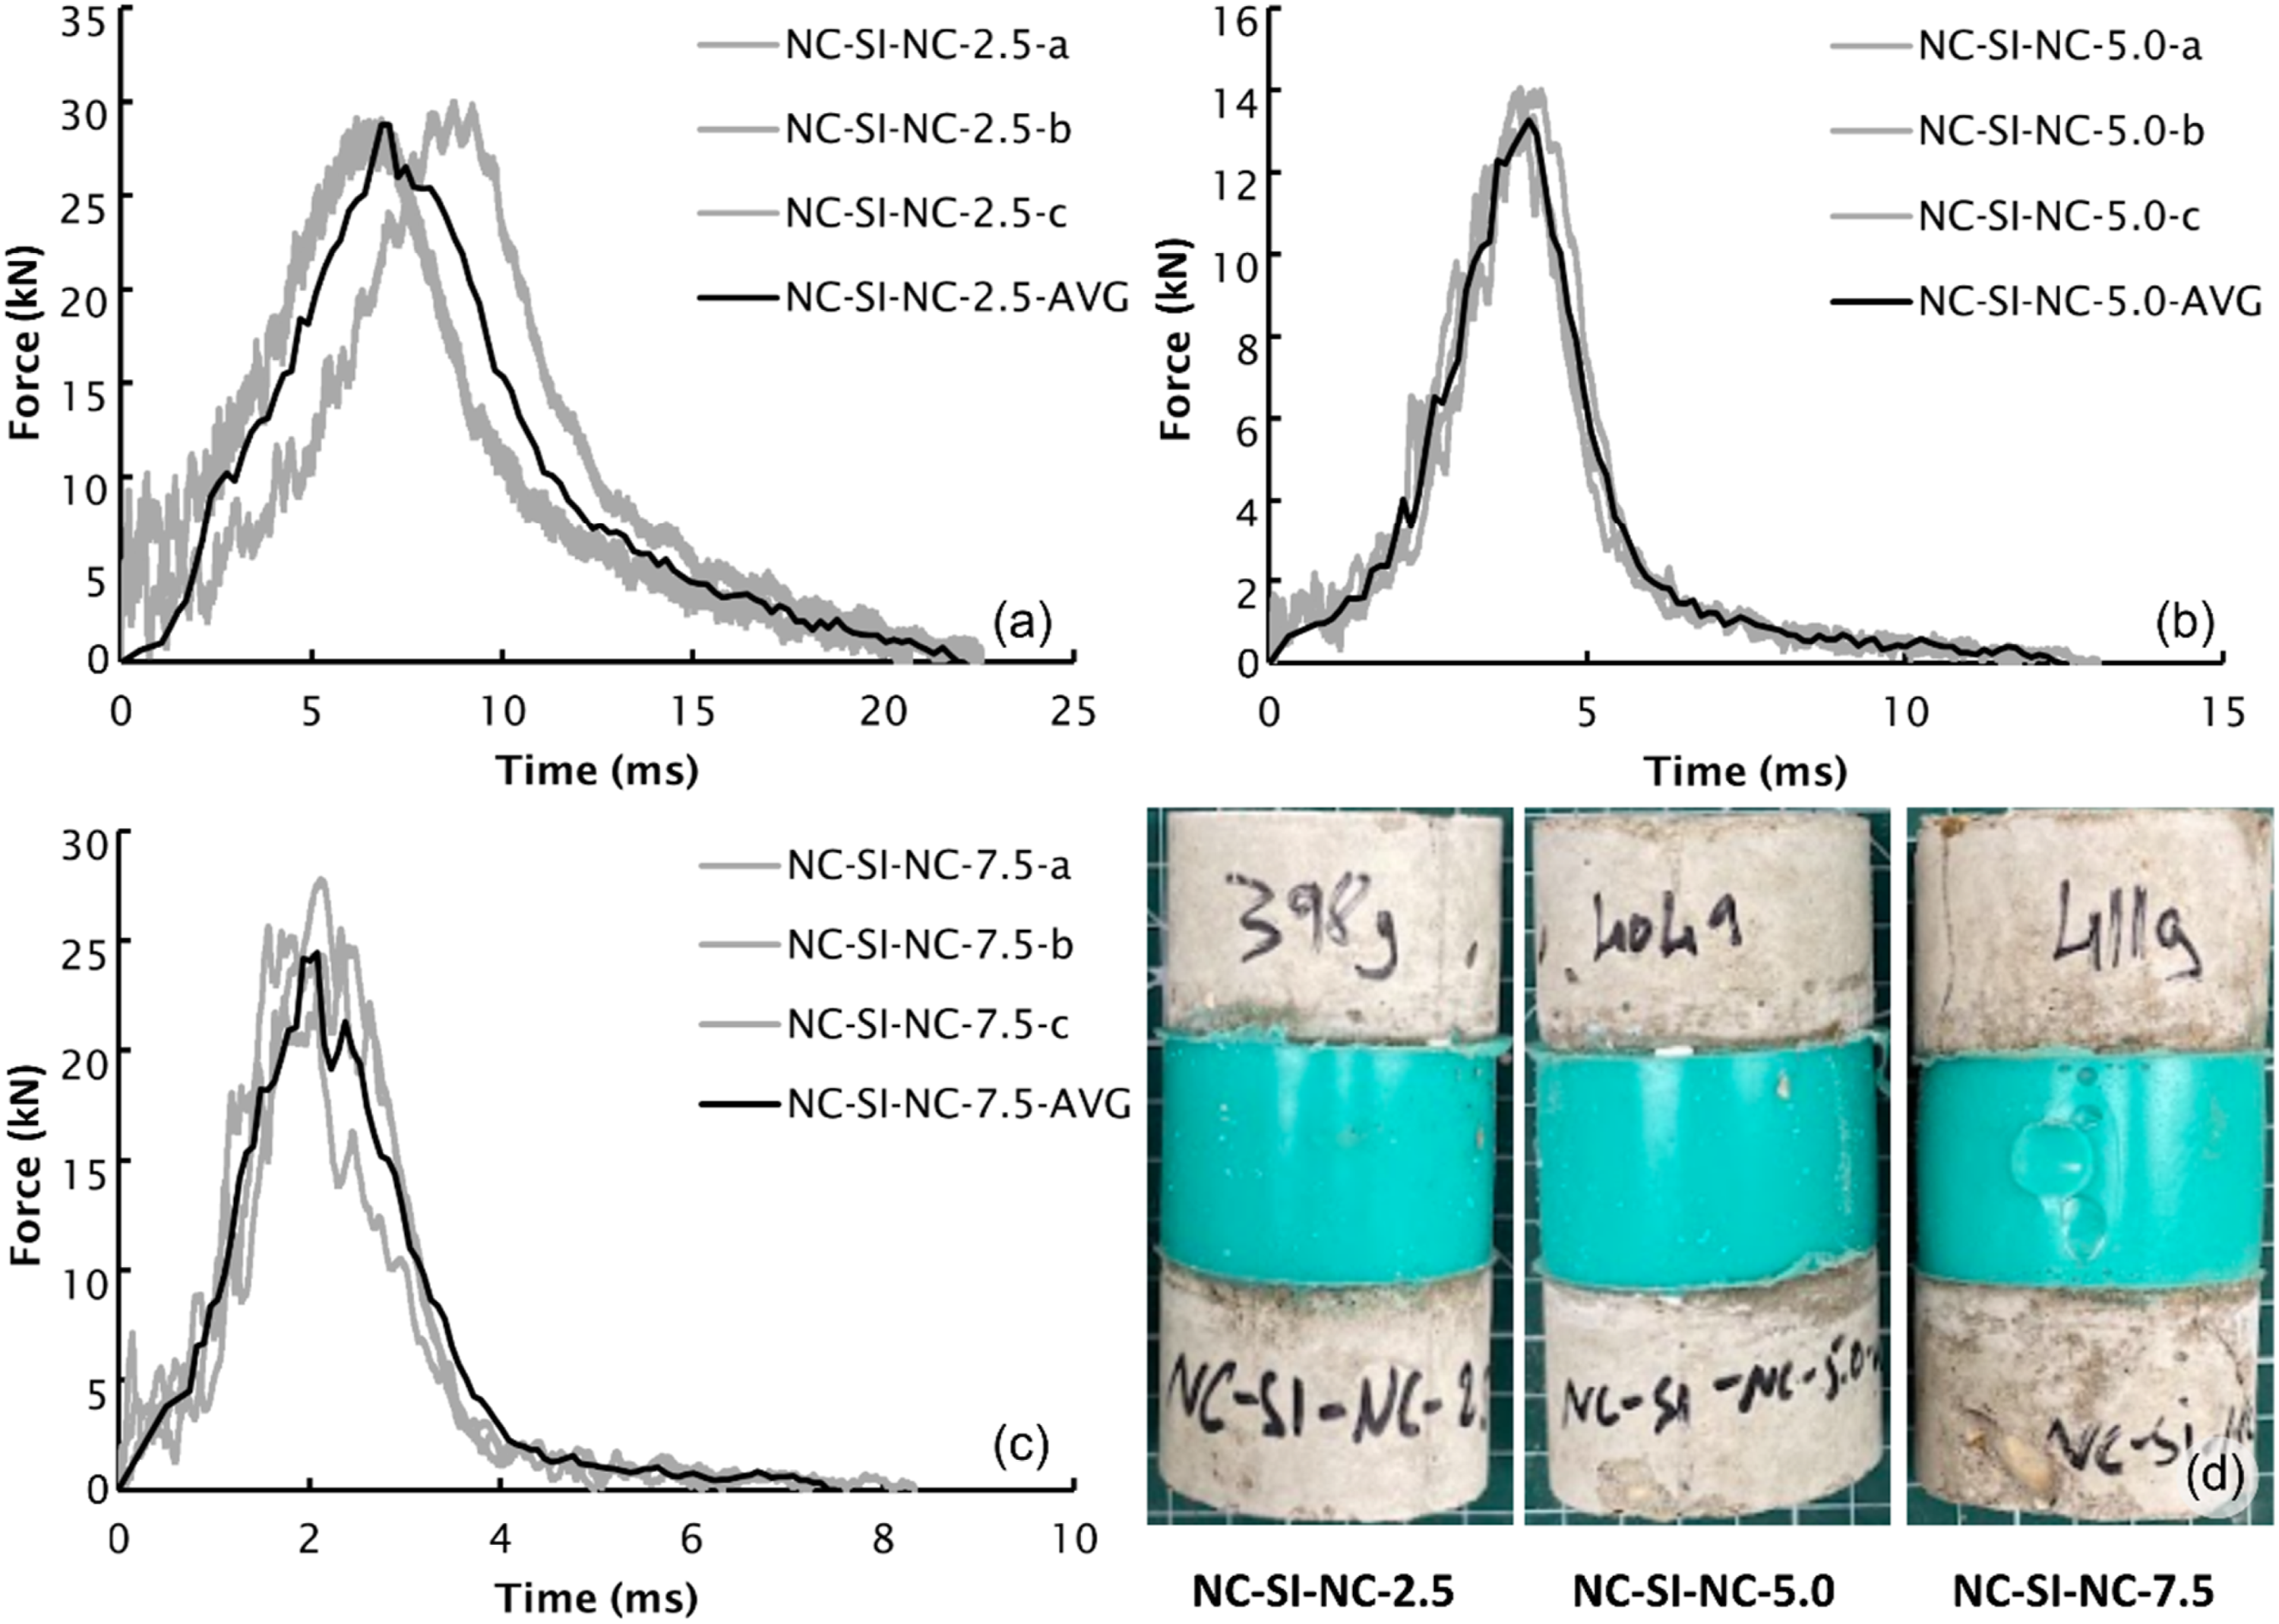
Composites with PU or SI core and NC and RC external layers
The second configuration positioned rubberised concrete (RC) as the bottom layer, based on prior findings, indicating its 5.7% higher momentum transfer compared to NC. The main test results and failure characteristics are depicted in Figure 8. In the NC-PU-RC system tested at 2.5 m/s, the average peak force was 3.20 kN, 4.04% higher than that of the NC-PU-NC system, while the impulse increased by 3.27% (Figure 8(a)). This corresponds to a slight decrease in momentum transfer efficiency of 0.77%. However, given the higher coefficient of variation in peak force for NC-PU-RC-2.5 (22.19%) compared to NC-PU-NC-2.5 (9.59%), this difference does not imply a significant performance deviation. At 5.0 m/s, the NC-PU-RC system showed an average peak force of 22.98 kN and an impulse of 35.06 kNms (Figure 8(b)). Compared to NC-PU-NC, this represented a higher peak force and lower impulse. The variation in results was again more pronounced in the RC-layered samples, with a coefficient of variation of 14% compared to 8.03% for the NC-PU-NC configuration. For the 7.5 m/s tests, NC-PU-RC specimens recorded a peak force of 34.42 kN and an impulse of 36.82 kNms (Figure 8(c)), representing increases of 3.79% and decreases of 8.85% respectively, relative to NC-PU-NC. Visual inspection indicated damage levels comparable to the NC-PU-NC system, although overall momentum transfer efficiency was lower (Figure 8(d)). Force - time curves for: (a) NC-PU-RC-2.5, (b) NC-PU-RC-5.0, (c) NC-PU-RC-7.5, (d) representative NC-PU-RC samples after testing.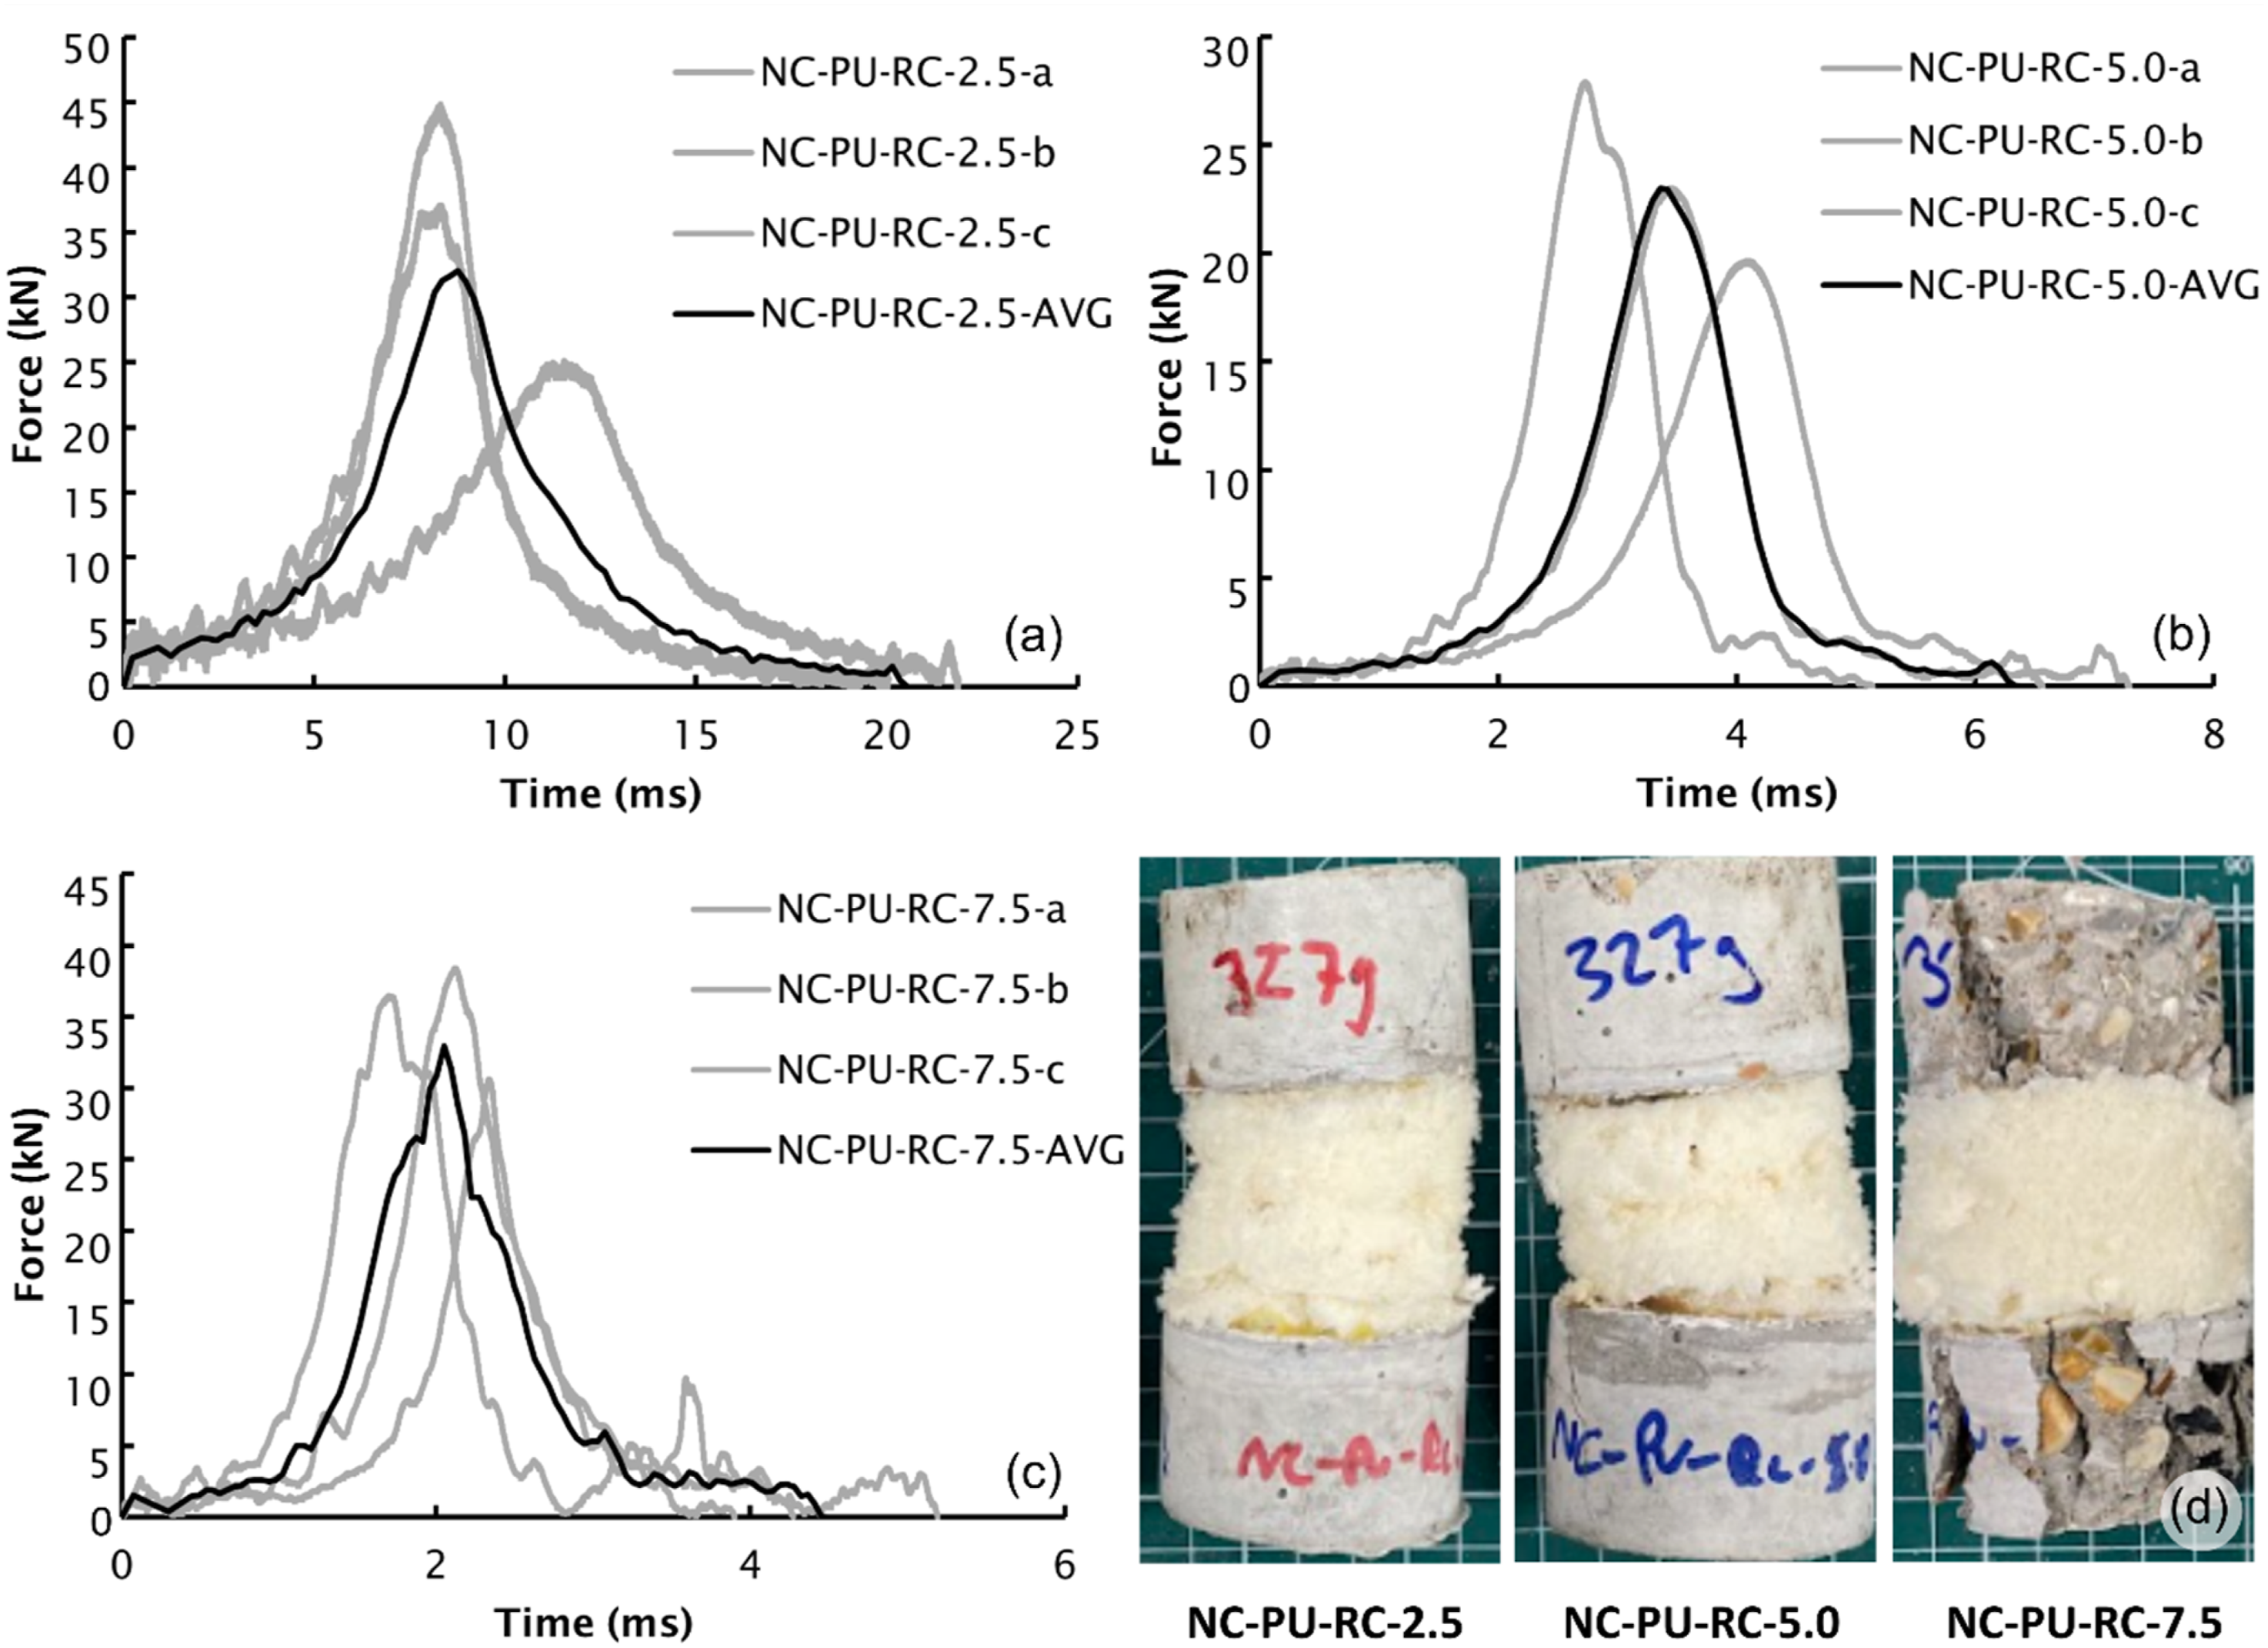
The final configuration tested was NC-SI-RC, maintaining RC as the bottom layer for consistency. At 2.5 m/s, NC-SI-RC specimens recorded a peak force of 2.81 kN and an impulse of 22.19 kNms (Figure 9(a)), indicating a 2.81% reduction in peak force and a 4.12% increase in impulse compared to NC-SI-NC. The peak force variation coefficients were 1.5% and 2.18% for NC-SI-NC and NC-SI-RC respectively. These results suggest a marginal improvement in momentum transfer efficiency attributable to the RC layer. At 5.0 m/s, NC-SI-RC recorded a peak force of 11.87 kN and an impulse of 37.35 kNms (Figure 9(b)), representing a 10.51% reduction in peak force and a 0.43% decrease in impulse compared to NC-SI-NC. The momentum transfer efficiency coefficient of NC-SI-RC-5.0 was 1.05 relative to NC-SI-NC and 3.51 relative to NC. The NC-SI-RC system demonstrated its best performance at 7.5 m/s, achieving a peak force of 24,224 N and the highest measured impulse of 50.22 kNms (Figure 9(c)). This reflected a 0.89% decrease in peak force and a 2.29% increase in impulse relative to NC-SI-NC. Additionally, the time to peak increased by 8.71%, further supporting the improved ability of the system to distribute and absorb the momentum of the impactor more effectively. The NC-SI-RC sample failure characteristics after failure are shown in Figure 9(d). Force - time curves for: (a) NC-SI-RC-2.5, (b) NC-SI-RC-5.0, (c) NC-SI-RC-7.5, (d) representative NC-SI-RC samples after testing.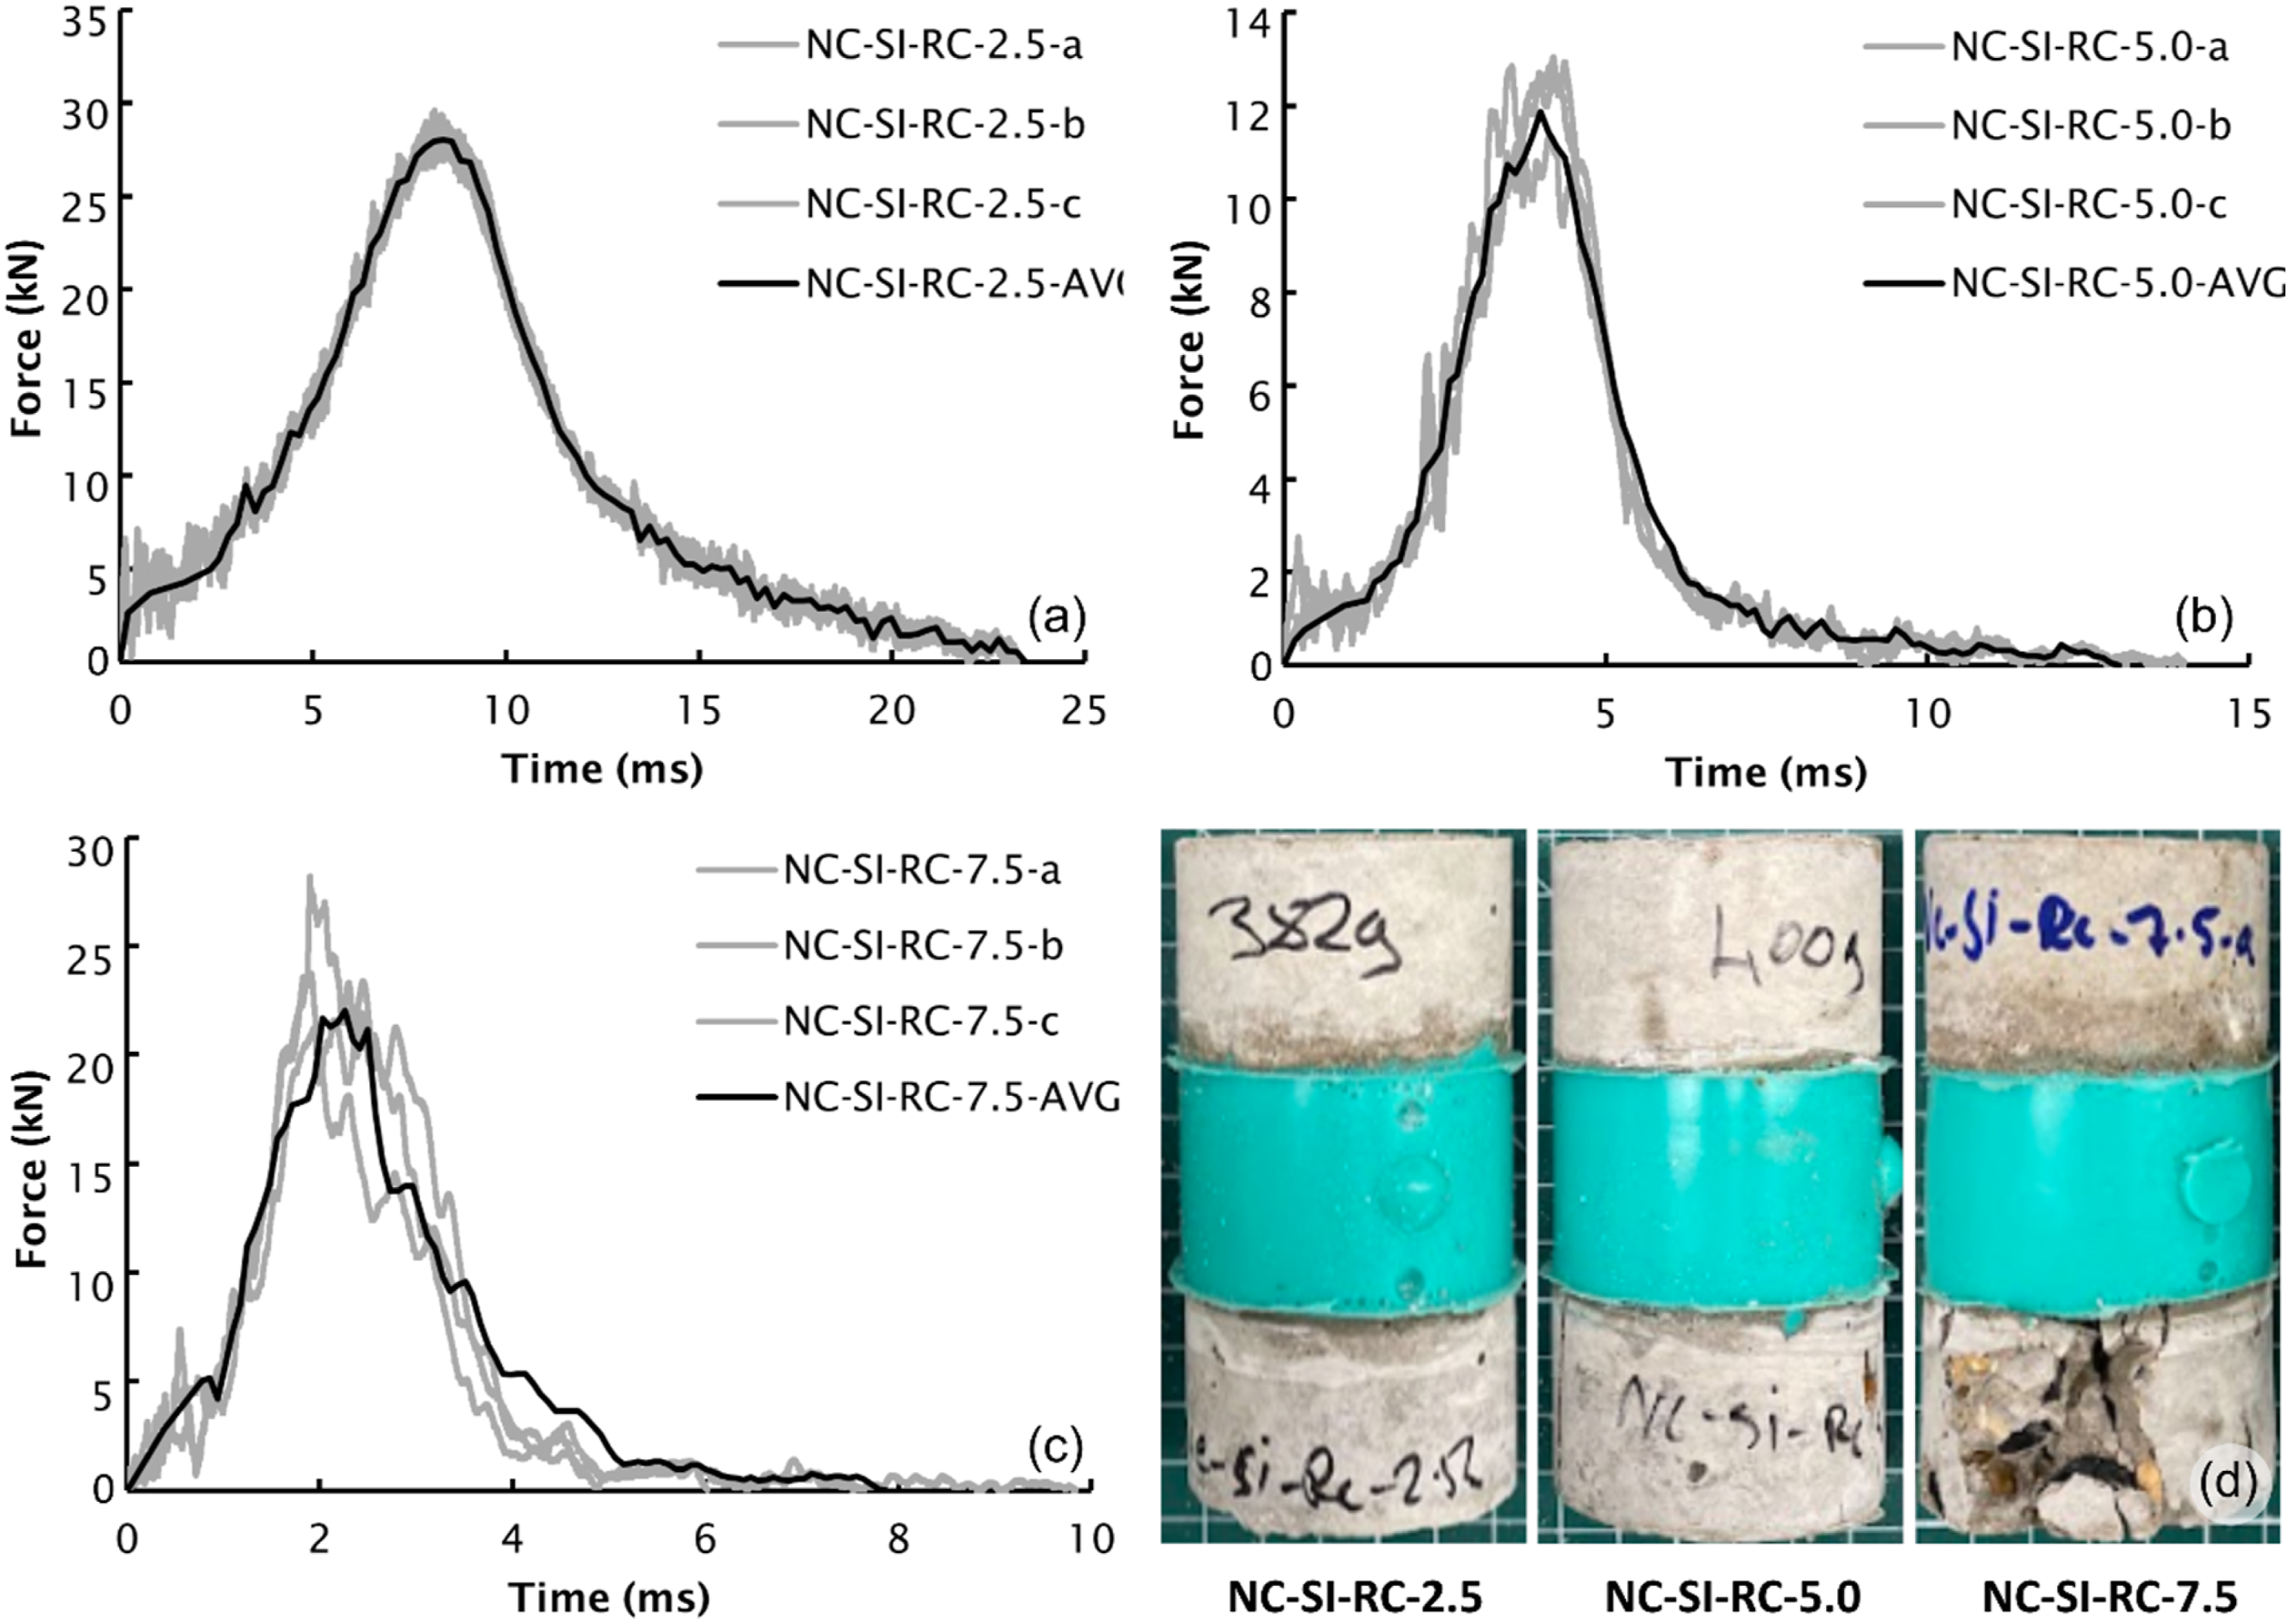
Comparative assessments
This section describes an assessment of variability in results of investigated systems. Comparative analyses are then presented to evaluate the influence of different configurations and materials for the tested impact velocities, focusing on momentum transfer efficiency. Finally, a predictive nonlinear regression model is introduced, developed from the most efficient configurations. This model enables the estimation of absorbed energy based on key material parameters, supporting future design of layered impact-resistant systems.
Statistical distributions
A detailed statistical examination was conducted to quantify variability and assess the distribution of results. This section focuses on key statistical measures of dispersion, specifically standard deviation and coefficient of variation (CV), to evaluate the performance consistency of each system (Montgomery and Runger, 2014). These metrics provided a clearer understanding of internal variability caused by the aleatoric uncertainties, which is critical for assessing both reliability and predictability. The intra-system standard deviations and CVs are summarised in Table 4.
The analysis considered six systems: NC, RC, NC-PU-NC, NC-PU-RC, NC-SI-NC, and NC-SI-RC. The respective CVs in peak force measurements were 7.5%, 3.8%, 14.3%, 19.5%, 3.2%, and 4.4%. It is worth noting that the highest impact velocity (7.5 m/s), both NC and RC systems experienced complete failure, with the load cell reaching its maximum capacity. It is reasonable to assume that, had the instrumentation permitted higher readings, the CVs for these systems might have increased. This aligns with established understanding that brittle materials such as concrete exhibit greater scatter in failure loads under high strain rates due to the random distribution of internal microcracks (Neville, 2011). Nevertheless, the recorded CVs remained within acceptable limits, suggesting reasonable consistency in the behaviour of concrete mixes under controlled conditions.
Systems incorporating PU foam exhibited notably higher variability, with CVs of 14.3% for NC-PU-NC and 19.5% for NC-PU-RC. This is attributable to the irregular cellular structure and non-uniform void distribution inherent in PU foam, which leads to inconsistent load paths during impact. In contrast, systems utilising silicone layers showed significantly lower variability, 3.2% for NC-SI-NC and 4.4% for NC-SI-RC. This reduced variation is consistent with the homogeneous and isotropic nature of silicone, which facilitates predictable stress distribution, as demonstrated by Zhu and Li (2021).
The integration of RC as the bottom layer had a detrimental effect on variability in both PU- and SI-based systems. Although RC alone exhibited a lower CV (3.8%) than NC (7.5%), its inclusion in layered composites, particularly with PU, resulted in increased variability. These results suggest that while RC can behave consistently in isolation, its interaction with more heterogeneous materials like PU introduces additional uncertainty. It should also be acknowledged that CV values, as statistical estimators, carry inherent uncertainty, which may partially influence the observed variability trends.
Comparative discussions
When comparing all systems for the tested velocities of 2.5 m/s, 5.0 m/s, and 7.5 m/s (Figures 10 and 11), it was generally observed that the presence of energy-absorbing layers led to a decrease in peak impact force decreased and an increase in impulse. The systems were ordered for comparison as follows: NC, RC, NC-PU-NC, NC-PU-RC, NC-SI-NC, and NC-SI-RC, reflecting the superior performance of silicone (SI)-based systems over polyurethane (PU)-based configurations. On average, PU-based systems reduced peak force by 51.9%, while SI-based systems achieved a 67.1% reduction. The most significant reductions in peak force occurred at 7.5 m/s, with PU and SI systems showing reductions of 84.7% and 85.7%. Comparative force - time curves for: (a) NC, (b) RC, (c) NC-PU-NC, (d) NC-SI-NC, (e) NC-PU-RC, (f) NC-SI-RC. (a) Averaged peak force with respect to the specimen type, (b) Normalised Averaged Measured Impulse with respect to the specimen type.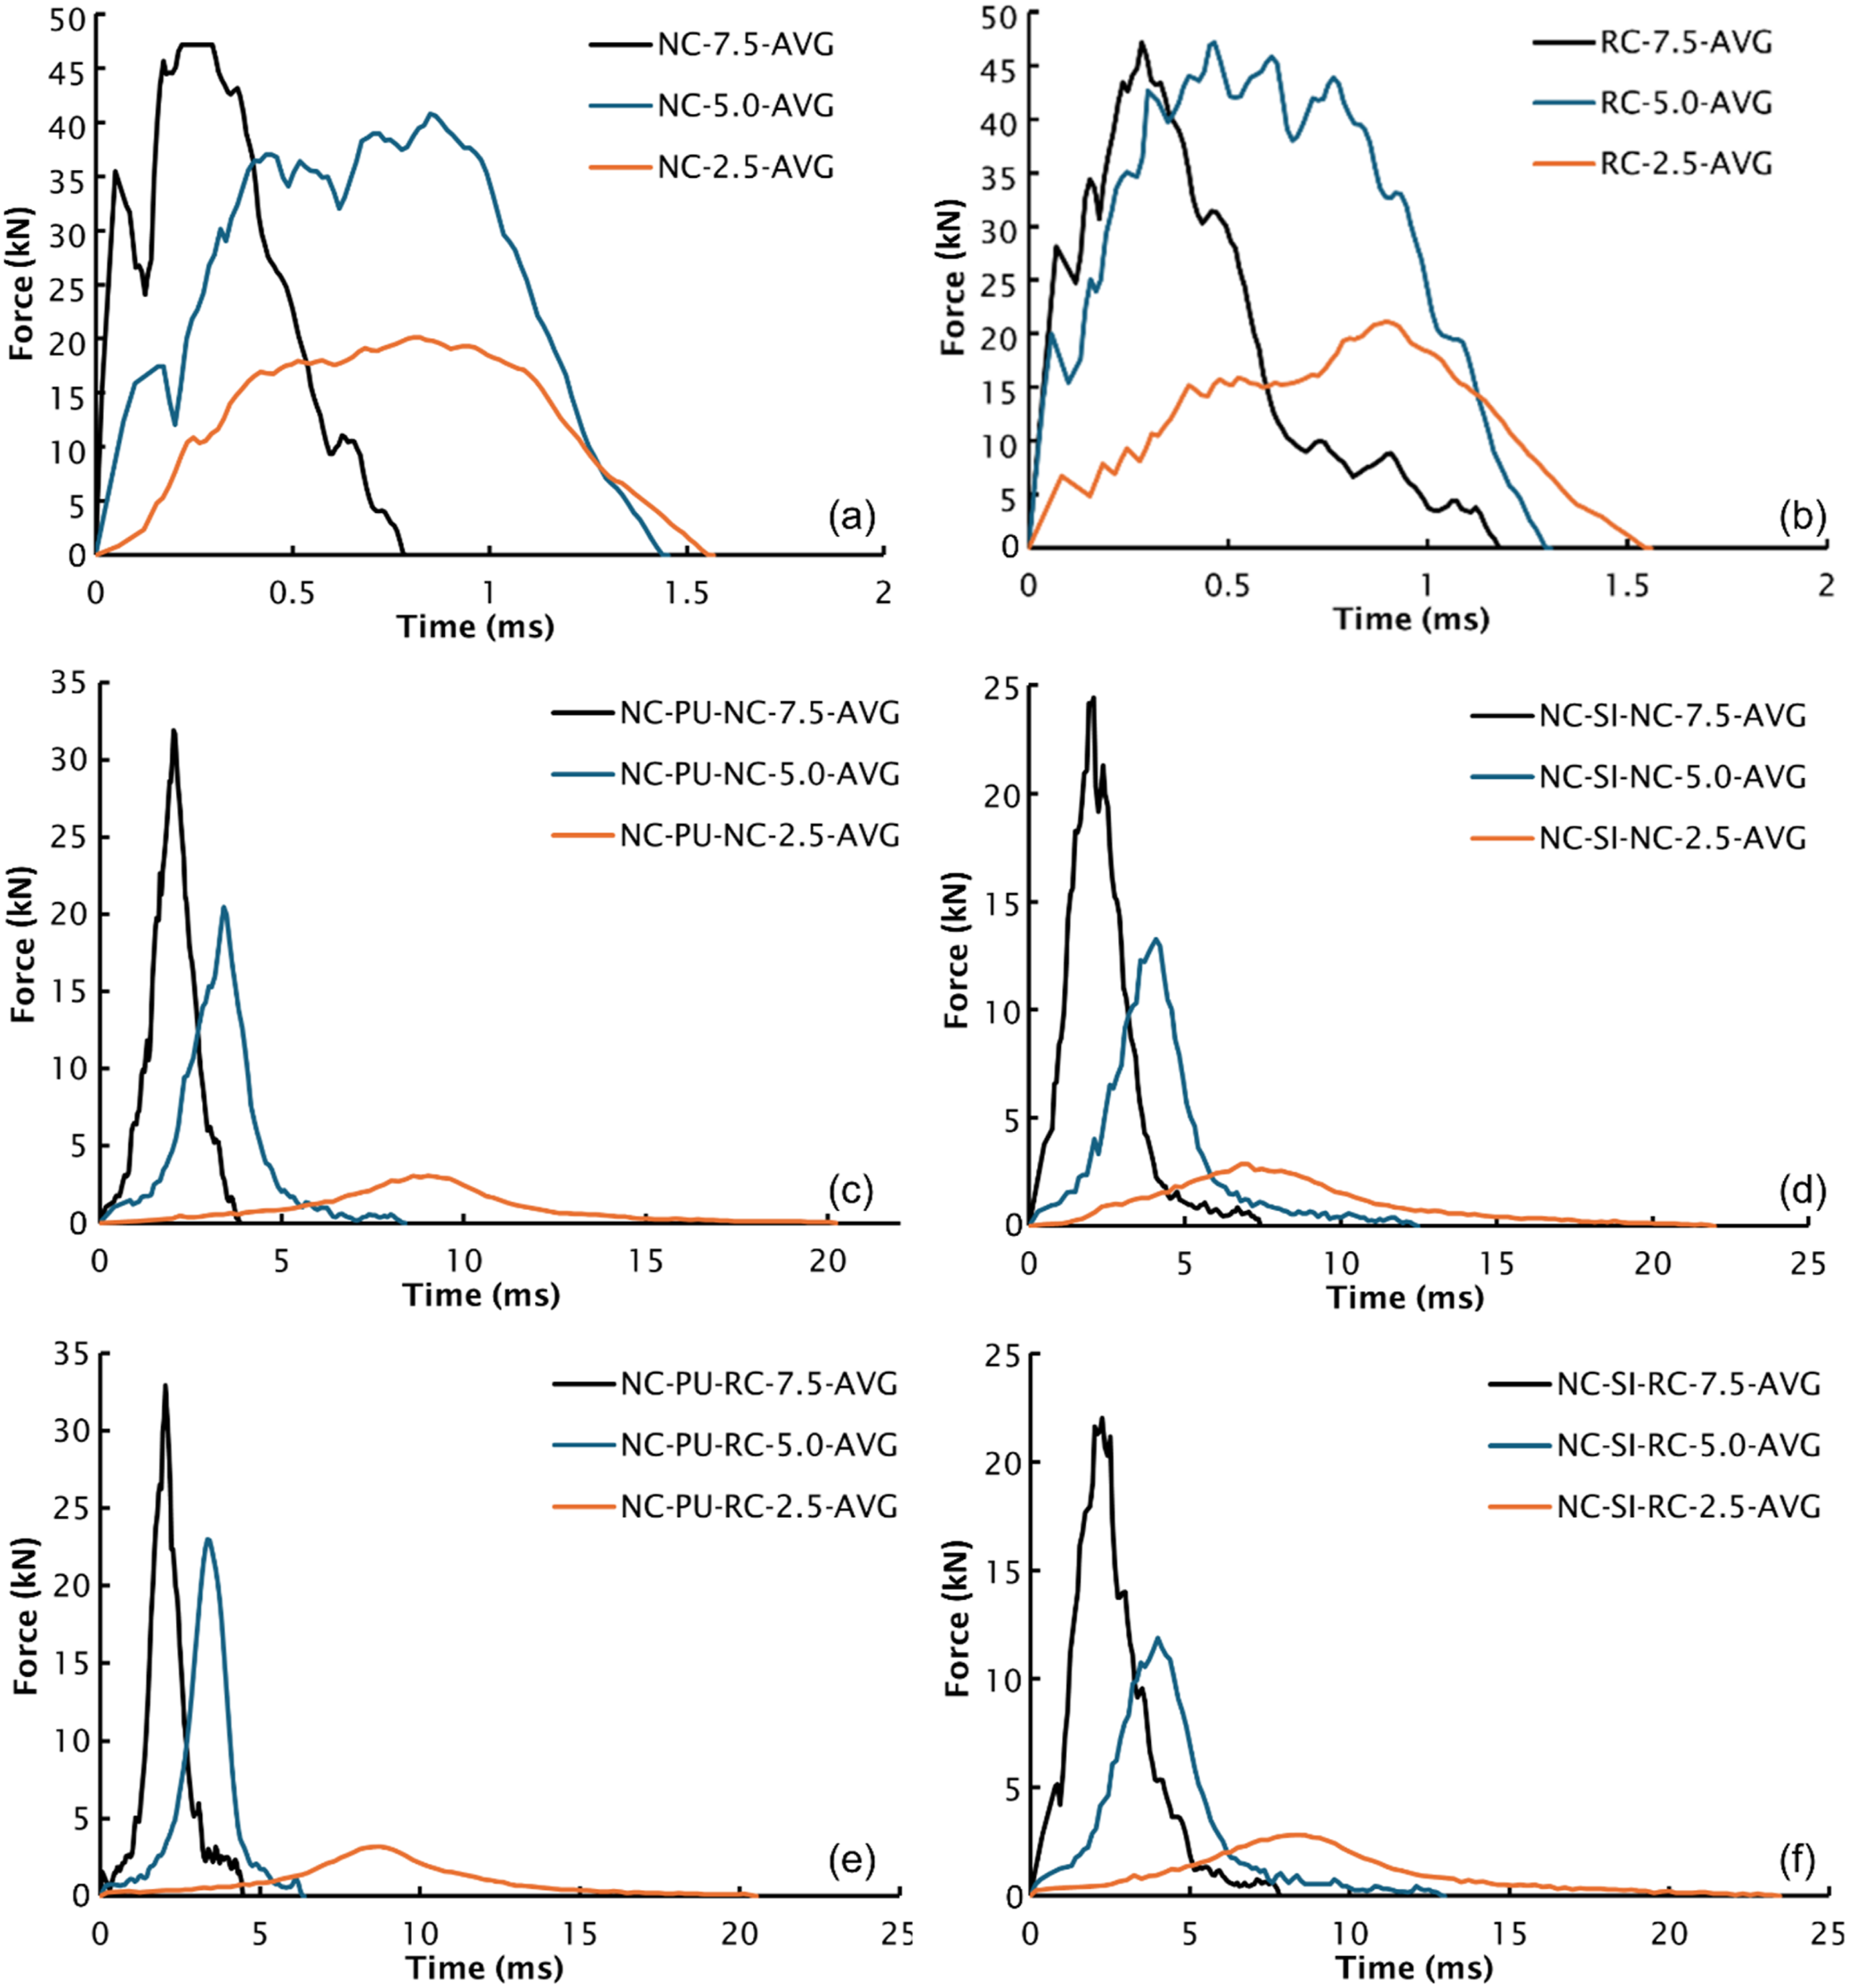
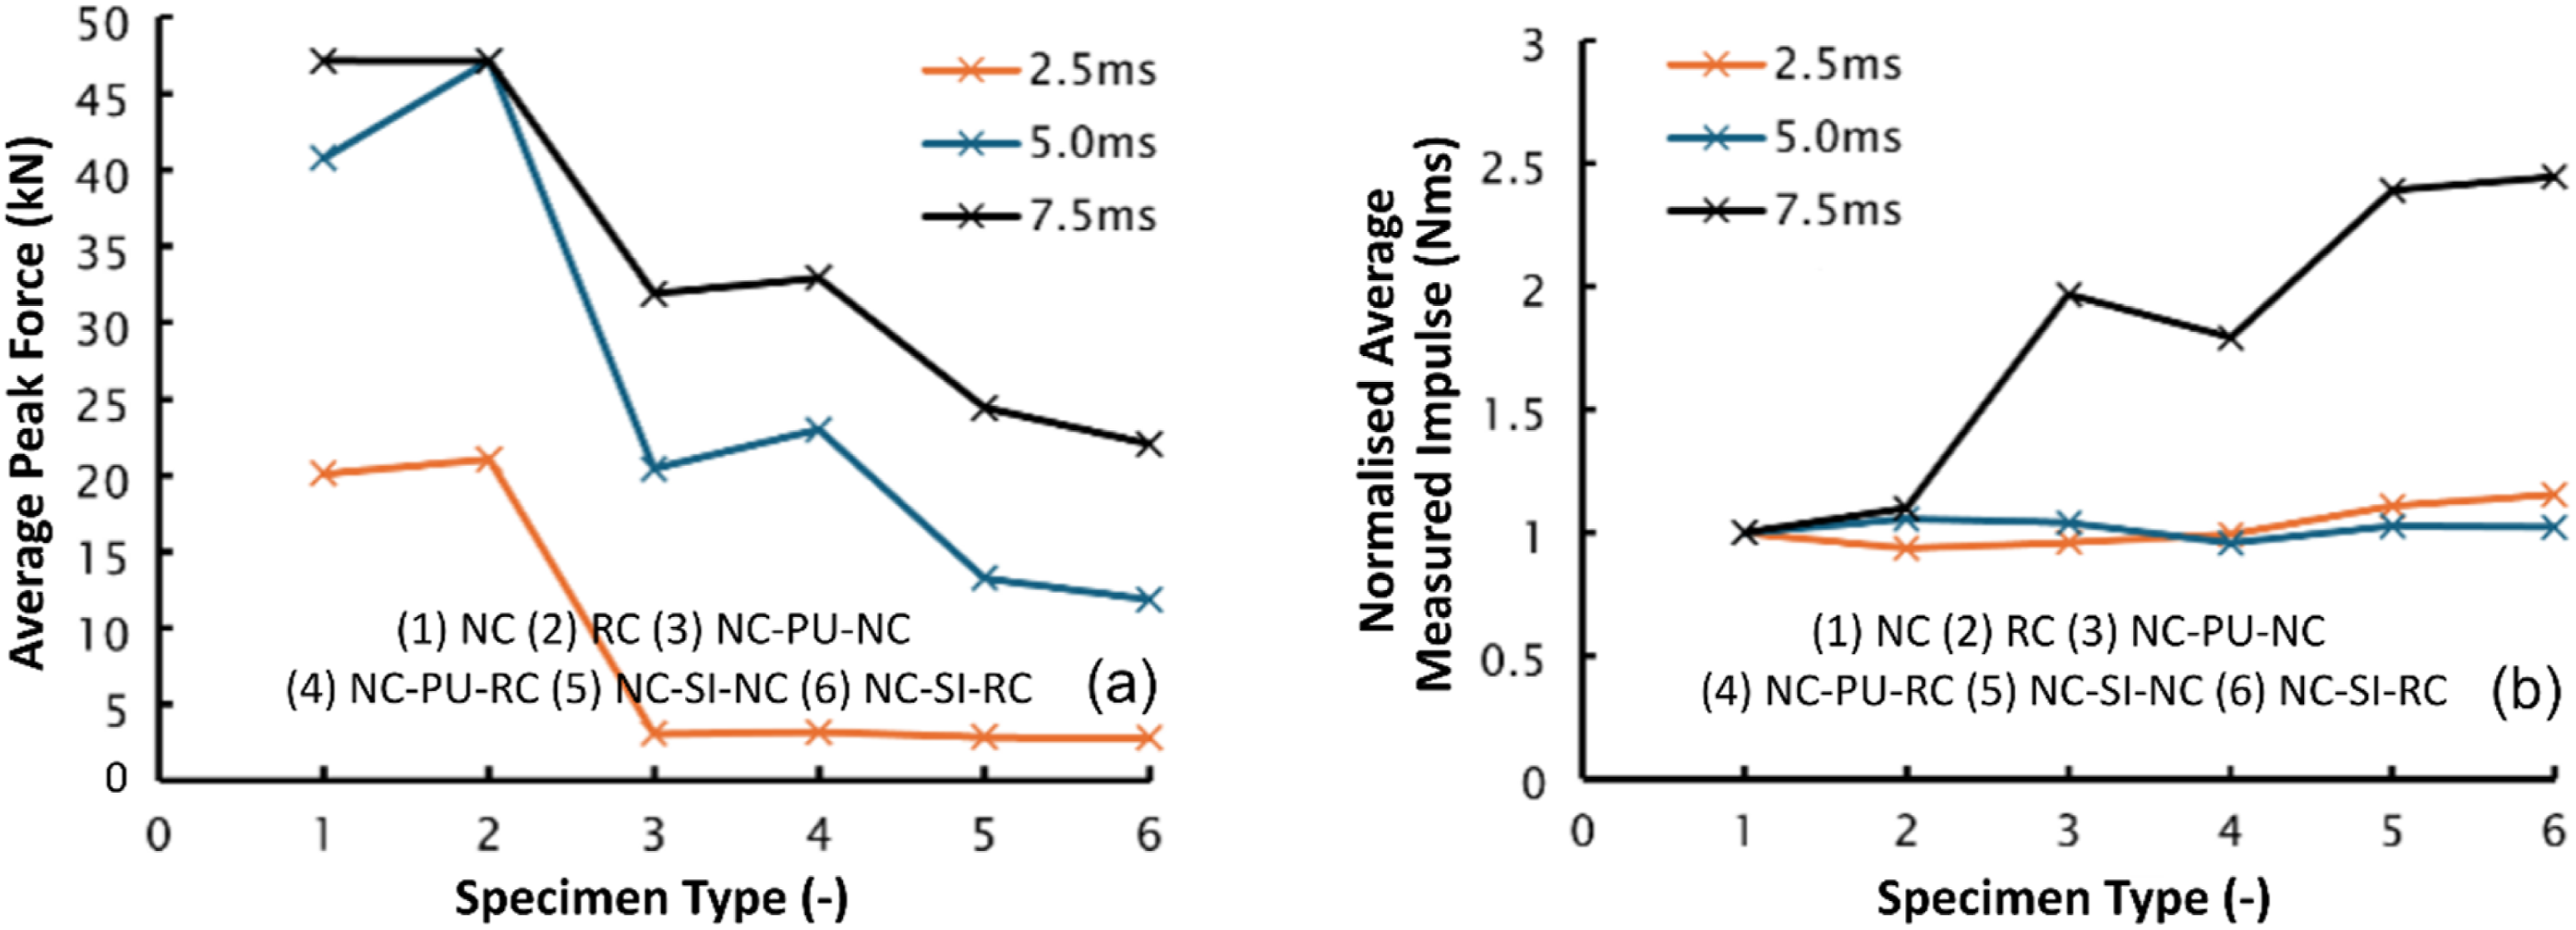
Normalised impulse data (Figure 11(b)) indicated a steeper gradient at 7.5 m/s, particularly for configurations combining multiple materials, indicating that as they approached their ultimate capacity, their efficiency in momentum transfer became increasingly critical. Notably, both NC and RC failed at this velocity, unable to transfer momentum beyond their ultimate strength, whereas systems with absorber layers sustained greater impulse due to their enhanced energy dissipation capacity. The effective impulse metric, accounting for improvements in one variable without corresponding losses in another, offers a more representative measure of system efficiency (Moore et al., 2017).
The effect of substituting the bottom concrete layer with RC varied by absorber type. In NC-PU-NC, adding RC reduced the effective impulse increase from 57.9% to 35.8%, a decline of 38.3%. This was likely due to the irregular cellular structure and void distribution within RC, which created non-uniform stress paths (Koohbor et al., 2020), supported by lower strengths of RC with respect to NC. These irregularities induced localised stress concentrations, impairing the ability of the material to effectively transfer momentum. In contrast, the NC-SI-RC configuration showed improved performance with RC as the bottom layer. The effective impulse increased from 73.0% to 75.5%, a gain of 3.5%. The homogeneous and isotropic properties of silicone allowed for more uniform stress distribution across the RC layer, minimising stress concentrations and enabling efficient momentum transfer. This finding aligns with the work of Gibson and Ashby (1997), who reported that heterogeneous foams often deform unpredictably under dynamic loading, whereas homogeneous elastomeric materials like silicone exhibit more stable responses. Zhu and Li (2021) also observed consistent strain rate-dependent behaviour in silicone under dynamic compression.
At 5.0 m/s, both NC-PU-NC and NC-SI-NC systems experienced only minor localised failure, allowing for controlled comparison of their performance and weight efficiency. This comparison is useful for further scaling up of the configurations for real world applications, where weight minimisation is useful for cost and carbon footprint reductions. The NC-PU-NC system had an average mass of 331.3 g, while the NC-SI-NC system averaged 404.4 g, 22.0% heavier. Despite the weight difference, the NC-SI-NC system reduced peak force by 67.4%, outperforming the 49.8% reduction observed in NC-PU-NC. In terms of effective impulse, NC-SI-NC achieved a 73.0% increase compared to 57.9% for NC-PU-NC, an improvement of 26.0%. When normalised against mass, NC-SI-NC provided a 1.6% greater reduction in peak force and a 1.2% higher increase in impulse per 1.0% mass increase, indicating superior weight efficiency.
During the NC and RC testing regimes the samples tested at 2.5 m/s showed no signs of failure. However, when increasing the impact velocity to 5.0 m/s both NC and RC samples displayed localised failure from the impact. In general, the failure was represented by inclined cracks and splitting corners at the bottom side of the samples which was in contact with the supporting plate (e.g. see Figures 4(d) and 5(d) for NC-5.0 and RC-5.0 respectively. All concrete samples, without interlayers, tested at 7.5 m/s showed complete brittle failure. This is shown in Figures 4(d) and 5(d) for NC and RC, respectively. The systems using absorbing layers also showed no signs of failure at 2.5 m/s. At 5.0 m/s impact velocity one in three samples the PU interlayers showed minor vertical cracking indicating that splitting strength perpendicular to the direction of impact has been reached. As similar behaviour was observed for the composite samples with SI interlayers. And this was more visible for samples had one of the layers incorporating RC, and the other NC. In all cases two out of the three samples were in pristine conditions, and considered as the governing case by majority, thus depicted in Figures 6(d), 7(d), 8(d), and 9(d). All PU inclusive samples tested at 7.5 m/s displayed complete brittle failure whilst the specimen using SI showed the tendency to fail in a more localised manner with either minor splitting cracks or disintegration of one of the layers.
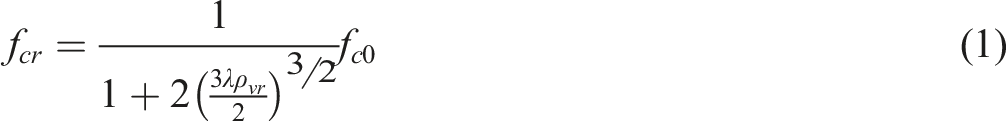
Regression modelling
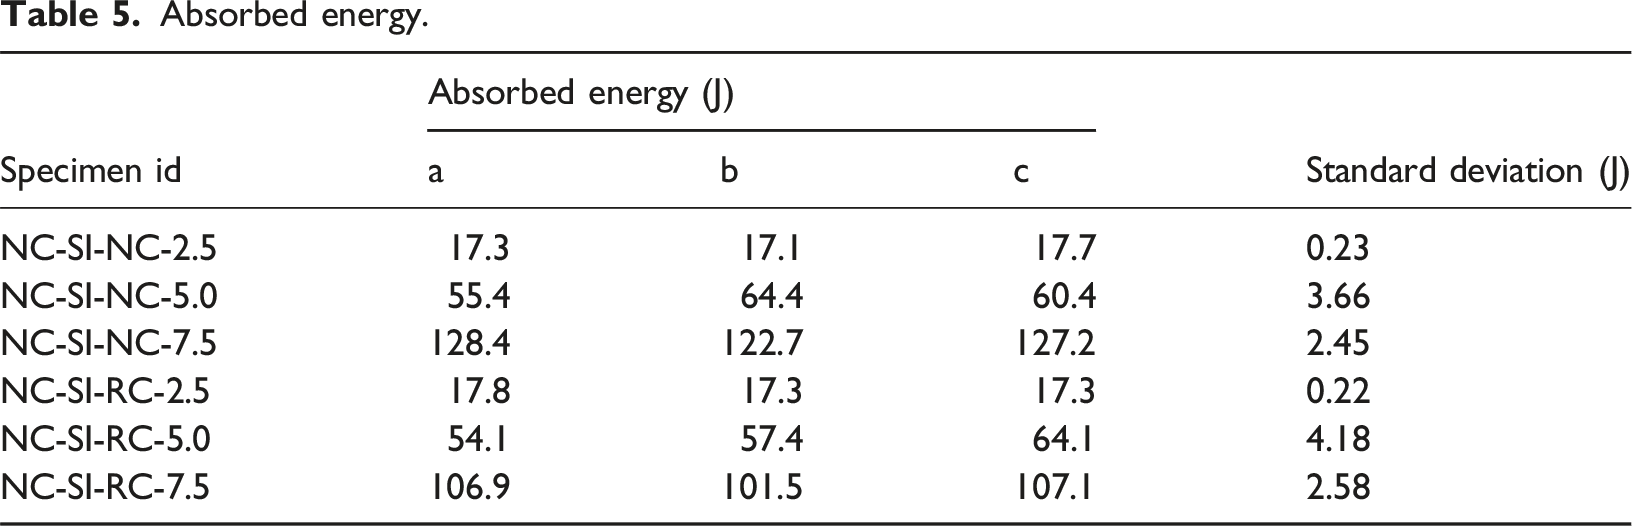
The aim of this section is to develop the analytical predictive tool to estimate the energy absorption of layered compressive cylinders, based on input parameters such as the layering configuration and the mechanical properties of the constituent materials. It should be noted that this equation has been developed using the available data presented in this section, and hence the validity of this equations is true only for this given configuration. To support the development of design expressions, analysis focused on systems with the lowest coefficients of variation (CV), namely NC-SI-NC (3.20%) and NC-SI-RC (4.42%). These configurations demonstrated high reliability and are therefore better suited for analytical modelling and practical implementation in impact-resistant design. Force-displacement curves were plotted for NC-SI-NC and NC-SI-RC specimens for all tested velocities to determine energy absorption (Figure 12). The analysis was based on the loading phase of the impact cycle, as this phase governs the primary deformation and energy dissipation. For all tests, the response exhibited a two-phase pattern characterised by an initial linear-elastic regime followed by a non-linear exponential increase in force. This is shown in the grey panel in Figure 12. Overall impact sample behaviour and step-wise regression procedure.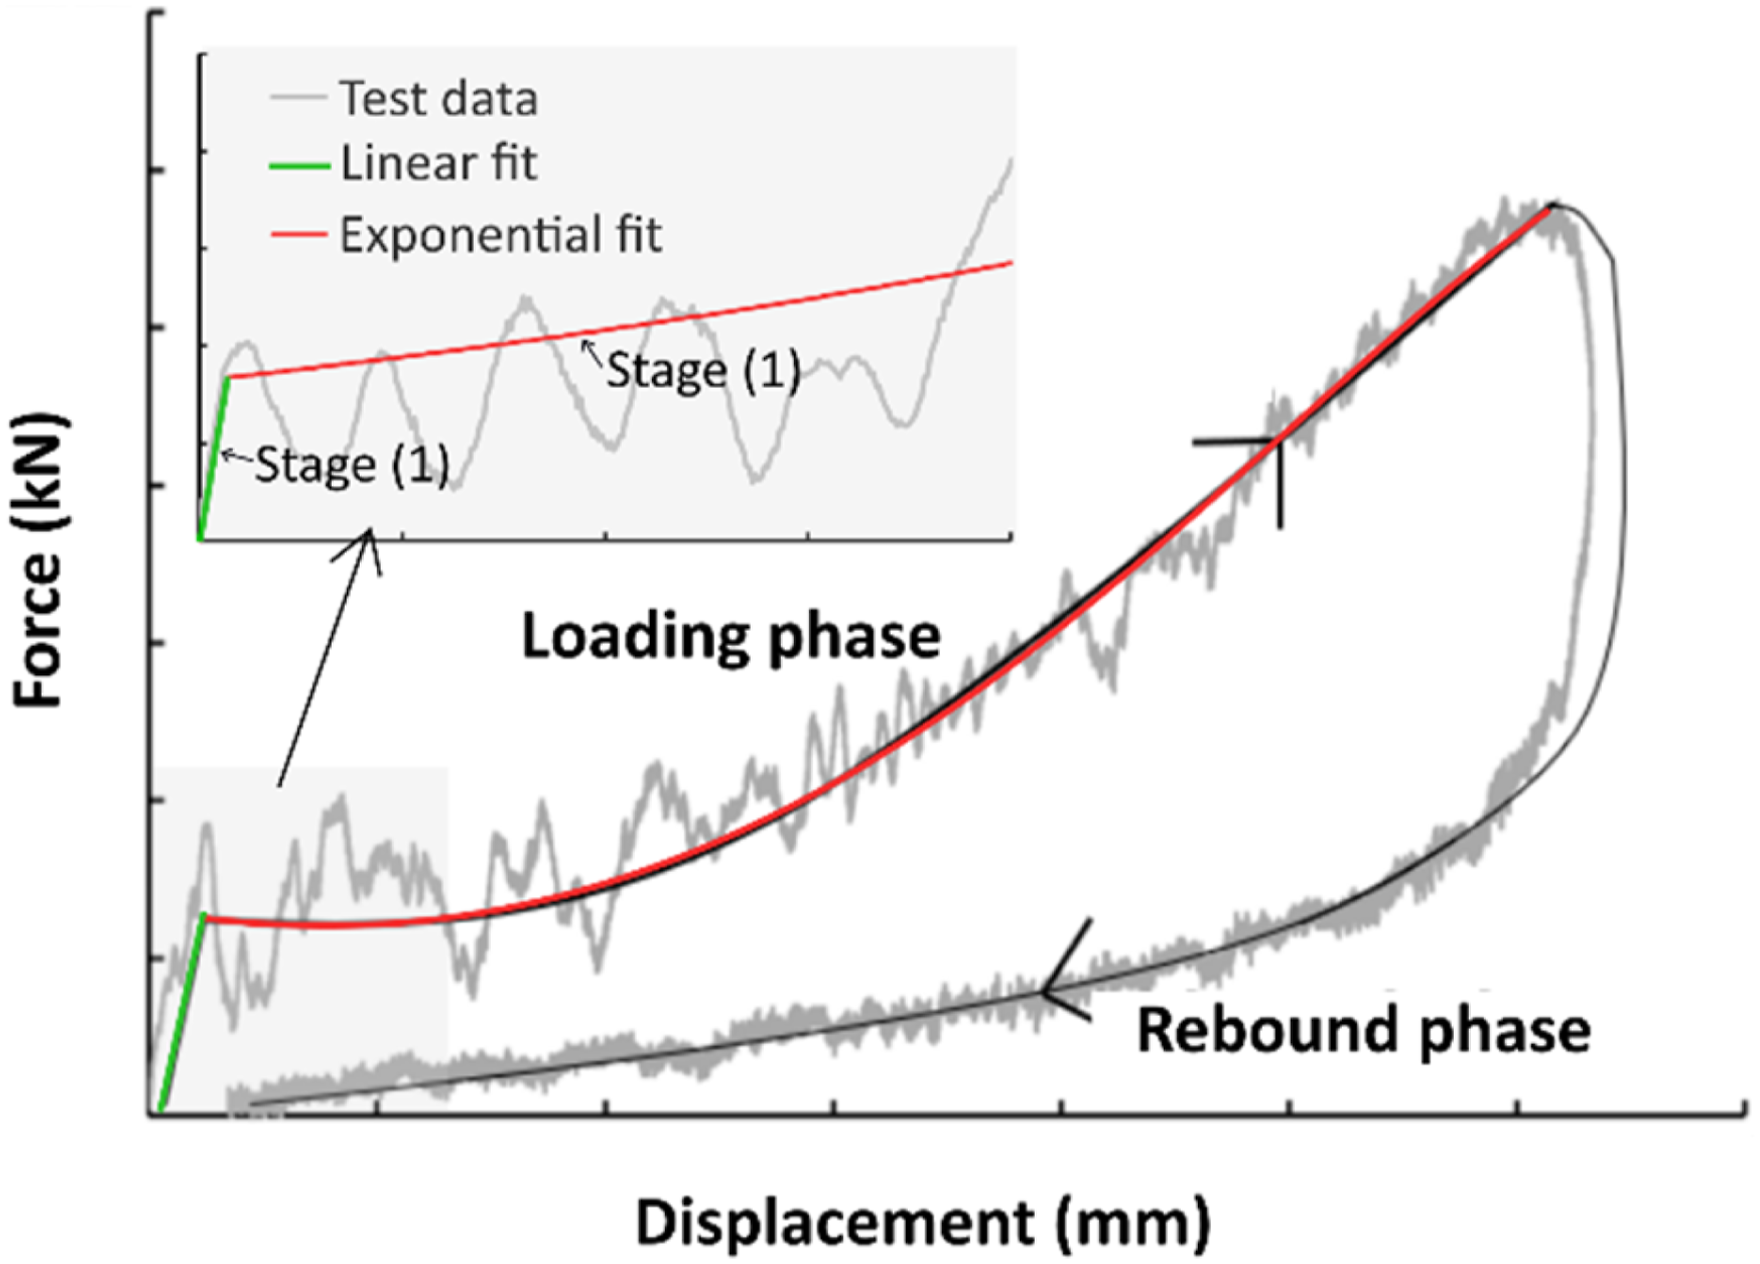
Absorbed energy.
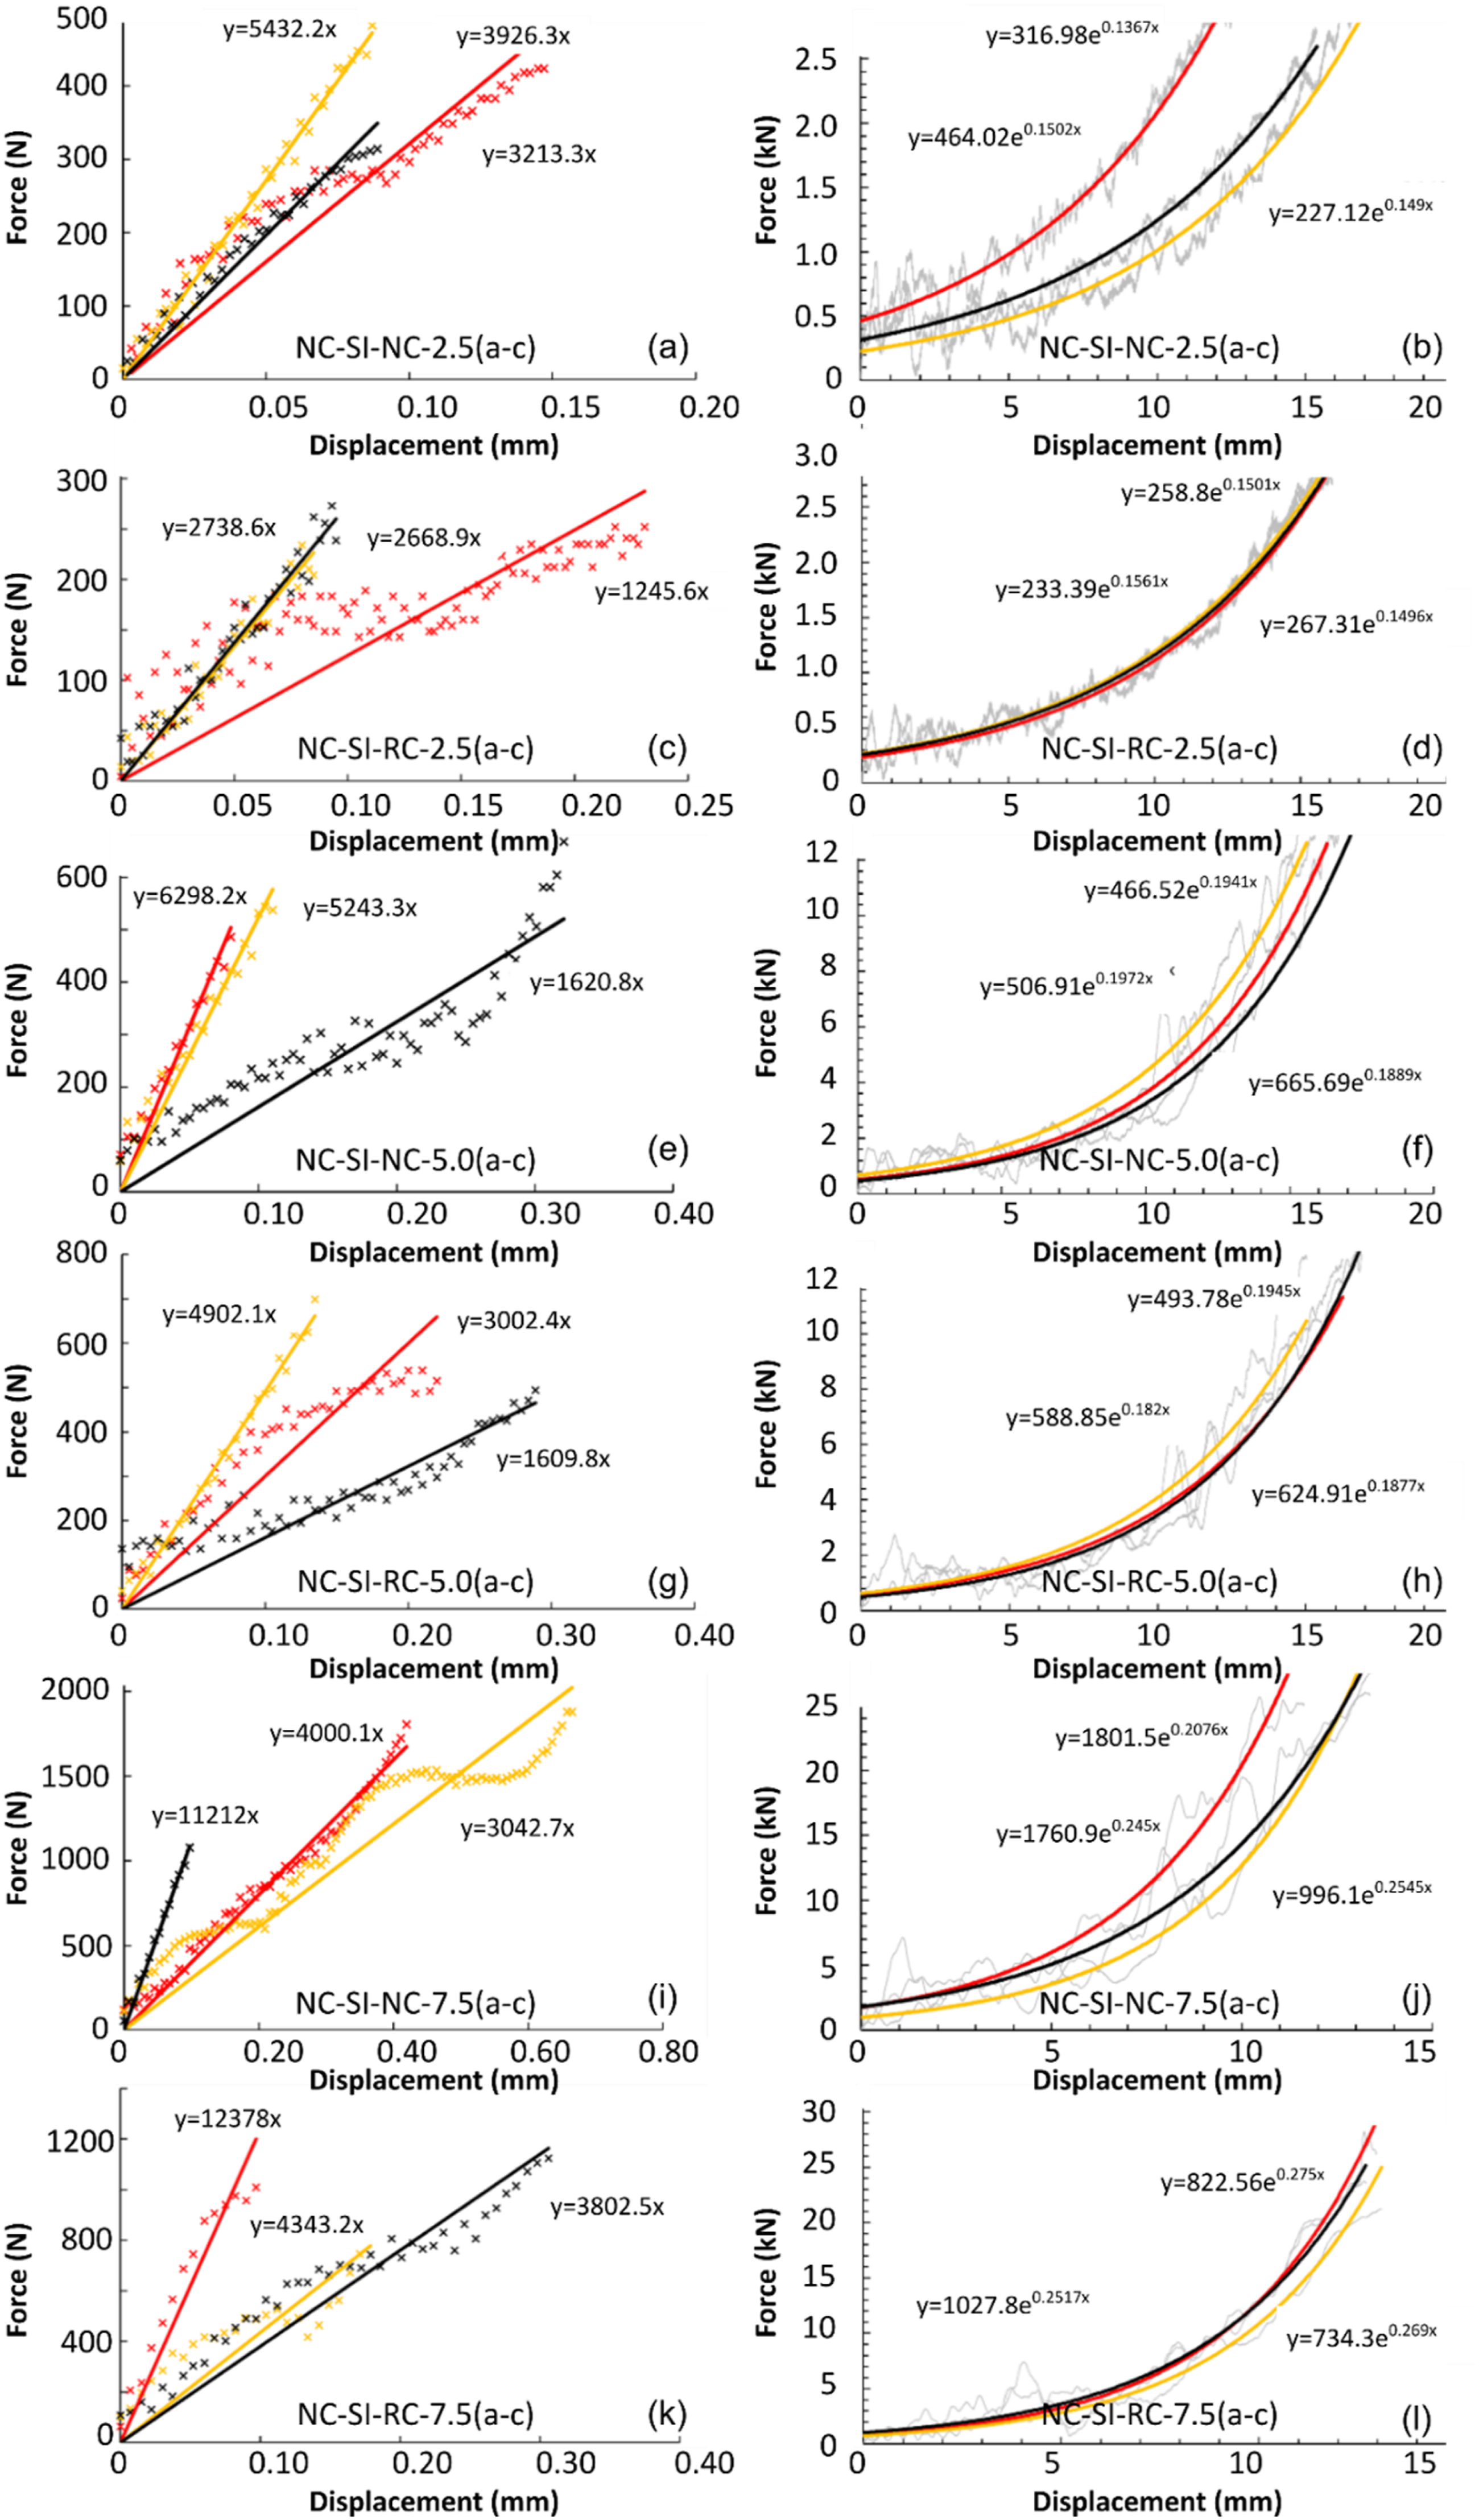
Regression modelling of experimental response: (a) NC-SI-NC-2.5(a-c) stage 1, (b) NC-SI-NC-2.5(a-c) stage 2, (c) NC-SI-RC-2.5(a-c) stage 1, (d) NC-SI-RC-2.5(a-c) stage 2, (e) NC-SI-NC-5.0(a-c) stage 1, (f) NC-SI-NC-5.0(a-c) stage 2, (g) NC-SI-RC-5.0(a-c) stage 1, (h) NC-SI-RC-5.0(a-c) stage 2, (i) NC-SI-NC-7.5(a-c) stage 1, j) NC-SI-NC-7.5(a-c) stage 2, k) NC-SI-RC-7.5(a-c) stage 1, l) NC-SI-RC-7.5(a-c) stage 2.
This divergence is explained by the physical failure observed in the RC layer of the NC-SI-RC specimens. With a lower compressive strength (32.9 MPa) than NC (34.9 MPa), RC was more prone to cracking and deformation. The RC layer reduced strength facilitated greater plastic deformation, which extended the duration of force application, increasing impulse but reducing effective energy dissipation, as more kinetic energy was absorbed through irreversible deformation. Notably, at 7.5 m/s, a reduction in average displacement was observed despite the higher impact force (Figure 13(j), and (l)). The average displacement across 2.5 m/s and 5.0 m/s was 16.424 mm, compared to 13.036 mm at 7.5 m/s, a 20.63% reduction. This behaviour highlights a pronounced strain-rate effect on silicone, consistent with the strain-hardening response described by Shergold et al. (2006), who attributed the increased stiffness at high strain rates to time-dependent molecular network responses in silicone.
For future design applications, data from both NC-SI-NC and NC-SI-RC systems were used to develop a predictive nonlinear multiplicative regression model using MATLAB (MathWorks, 2025). The resulting equation is presented in equation (2).
The empirical coefficients a, b, c and d were determined using a nonlinear last squares curve fitting approach which used MATLAB’s ‘lsqcurvefit’ function, resulting in a = 0.1716, b = 0.8613, c = 1.6763, and d = 0.3396. The function iteratively adjusts the coefficients to minimise the sum of squared errors between the predicted energy absorption and the measured results. This model structure was selected to capture the nonlinear influences of the material stiffness, strength and impact energy on the systems energy absorbing performance. The model accuracy was determined using the coefficient of determination (R2) value, which was found to be 0.9855, indicating a strong correlation between the predicted and the observed data.
The presented design expression was derived from experimental data using specimens with a silicone interlayer, selected for their superior and consistent performance relative to polyurethane PU-based systems. The model is valid for impact velocities between 2.5 and 7.5 m/s and assumes a three-layer configuration, concrete:silicone:concrete, each occupying one-third of the total 100 mm thickness (1:1:1 ratio). It should be treated as a best-fit approximation within this velocity range; its accuracy outside this range, particularly at higher velocities, cannot be confirmed.
For use in design, the application must reflect the conditions under which the model was developed. The impact velocity must lie within the validated range, and materials should be limited to concrete and silicone. Concrete compressive strengths should range from 20 to 40 MPa for normal strength concrete. Provided these parameters are satisfied, the required impact energy can be calculated using appropriate partial safety factors (CEN, 2004). Material properties, elastic modulus and compressive strength, should be determined through testing or sourced from reliable data. These inputs can then be used in the model to iteratively assess energy absorption until it matches the impact energy demand.
Discussion and implications
Previous studies have shown that conventional concrete exhibits brittle failure and limited energy dissipation under dynamic loading (Fujikake et al., 2009). The present results confirm this behaviour, as homogeneous NC and RC specimens experienced cracks or complete failure at intermediate and higher tested velocities. The results further align with previous investigations showing that incorporating rubber aggregates can increase ductility and energy dissipation while slightly reducing compressive strength (Elzeadani et al., 2023a; Liu et al., 2012). In this study, RC demonstrated a modest increase in impulse capacity relative to NC, consistent with reported improvements in energy dissipation due to rubber inclusions.
The main novelty of the present work lies in the layered composite configuration integrating viscoelastic absorbers between concrete layers. Similar approaches have been explored in protective structures and sandwich systems, where compliant interlayers are used to dissipate impact energy (Tomin and Kmetty, 2022). However, comparative experimental data for concrete-elastomer layered systems remain limited. The results show that silicone interlayers significantly improve peak force reduction and impulse transfer compared with polyurethane cores, which is attributed to the stable and homogeneous mechanical response of silicone under dynamic loading (Li et al., 2024).
The experimental programme was conducted using relatively small cylindrical specimens (50 mm diameter), which may not fully capture scale effects and structural boundary conditions present in real infrastructure systems. Size effects are known to influence fracture behaviour and energy dissipation in concrete under dynamic loading (Bažant and Planas, 2019). Furthermore, the impact tests were limited to the low-velocity range (2.5-7.5 m/s), which is representative of many rockfall and debris impact scenarios but does not capture higher-energy impact conditions that may occur in extreme events (Volkwein et al., 2011).
Another limitation arises from the load-cell capacity, which capped peak force measurements in some high-energy tests. Additionally, the predictive model developed in this study assumes a specific three-layer configuration (concrete-silicone-concrete) with equal thickness ratios and was calibrated for normal-strength concrete (20–40 MPa). Consequently, its applicability to other geometries, material strengths, or absorber configurations requires further validation.
Future research should therefore investigate larger-scale specimens, wider velocity ranges, and alternative absorber materials to better understand the interaction between viscoelastic layers and concrete substrates. Particular attention should be given to interface behaviour and confinement effects, which may influence energy dissipation mechanisms in layered impact-resistant systems. Such studies would support the development of design guidelines for protective infrastructure incorporating viscoelastic energy-absorbing layers.
Concluding remarks
This study investigated the low velocity impact response of composite-layered concrete systems comprising Normal Concrete (NC) or Rubberised Concrete (RC) with viscoelastic interlayers of polyurethane (PU) or silicone (SI), with the aim of enhancing energy absorption and reducing peak impact forces in applications such as railway catch walls. The research involved the design and testing of constituent materials and layered composites under quasi-static and low-velocity impact conditions, the quantification of peak force reduction, impulse efficiency, and energy absorption characteristics, and the development of an equation to characterise the energy-absorbing behaviour of the selected composite system. The main remarks are outlined below. • The inclusion of energy-absorbing interlayers improves low-velocity impact performance by reducing peak impact forces up to 85.7% at relatively low velocities and enhancing the impulses above 75% at relatively higher velocities. • Comparative testing showed that RC increased impulse capacity by 5.7% at intermediate velocities with respect to the NC counterpart, attributed to the presence of rubber aggregates. • The NC-PU-NC system achieved average reductions in peak force and increase in impulse by 215% and 15%, compared with NC samples. The NC-SI-NC system achieved comparatively greater reductions in peak force by 315%, higher impulse by 24% with respect to the NC counterparts. • In PU-based systems, RC reduced impulse transfer and increased variability due to stress concentrations and its relative lower compressive strength. SI-based systems showed increased impulse capacity with RC, although energy absorption did not improve because earlier cracking in the RC base. • A non-linear regression model was developed to predict absorbed energy in the 2.5–7.5 m/s velocity range, achieving a high coefficient of determination (R2 = 0.9855), effectively characterising the relationship between stiffness, strength, and impact energy with the tested ranges.
Footnotes
Acknowledgements
This paper directly contributes to integration of resilient material systems in critical infrastructure assets. The contributions of the technical staff at the Structures and Materials Testing Labs at the University of Surrey, particularly Dr Ed Cui and Ms Thabang Ntanda for support with the tests, are gratefully acknowledged.
Author contributions
Callum A. Hawkins-Row: Methodology, Formal analysis, Investigation, Writing - Original Draft; Marco F. Funari: Conceptualisation, Writing - Review & Editing; Dan V. Bompa: Conceptualisation, Methodology, Formal analysis, Investigation, Supervision, Funding, Writing - Review & Editing.
Funding
The corresponding author gratefully acknowledges funding received by UK Research and Innovation (UKRI) under the Horizon Europe Guarantee scheme (grant agreement No: EP/Y00986X/1), complementary to the European Union HORIZON-MSCA-2021-SE-01 grant agreement No: 101086413 for the project ‘ReCharged - Climate-aware Resilience for Sustainable Critical and interdependent Infrastructure Systems enhanced by emerging Digital Technologies’. This paper directly contributes to integration of resilient material systems in critical infrastructure assets.
Declaration of conflicting interests
The authors declared no potential conflicts of interest with respect to the research, authorship, and/or publication of this article.
Data Availability Statement
Some or all data, models, or code that support the findings of this study are available from the corresponding author upon reasonable request.