
Abstract
In this work, we aim at improved characterization of target damage occurring as the result of projectile impact against ultra-high-performance concrete (UHPC). For this purpose, we present the results of high-velocity impact experiments with spherical steel projectiles and finite-thickness UHPC targets of approximately 115 MPa compressive cylinder strength in the impact velocity range from approximately 600 m/s to 1500 m/s. The data set obtained from these experiments includes residual projectile velocities as well as qualitative and quantitative information on damage. Quantitative damage information is mainly extracted from digital 3D post mortem targets, which are produced by 3D-scanning. For all damage quantities, a dependence on the impact velocity and the target thickness is discussed and used to provide possible explanations for the origin of the particular type of damage. The large data set presented in this work can constitute the basis for a comprehensive and quantitative verification and validation of analytical, empirical, and numerical models that describe the perforation of UHPC targets in the investigated impact velocity range.
Keywords
Introduction
In modern architecture, concrete is the most widespread material, which creates a fundamental need to properly understand the behavior of this material class with respect to all types of mechanical loading. The effort to enable a better performance has led to the development of ultra-high-performance concrete (UHPC), a cement-based composite material that exhibits a compressive strength in the range of approximately 100 to 200 MPa (Xue et al., 2020). Recently, this material has become more and more relevant in applications such as bridge engineering (Xue et al., 2020), protective structures for critical infrastructure (Riedel et al., 2011), and security cores of high rise buildings (Nöldgen, 2011). Consequently, predictive capabilities for the response of UHPC to a variety of static and dynamic loading scenarios (Thoma et al., 2012) are highly desired for planning resilient structures and assessing possible vulnerabilities of existing infrastructure with respect to such loading cases.
As the impact of projectiles, aircraft, detonation fragments, and debris poses a possible threat to concrete structures, the penetration into concrete has already been investigated for a long time (Yankelevsky, 2017), with the considered impact velocities reaching the hypervelocity range (Atoua et al., 2013; Dawson et al., 2008). In addition to analytical models (Ben-Dor et al., 2015), as for example, the seminal work of Forrestal (Forrestal et al., 1996), and empirical descriptions (Li et al., 2005), several numerical material models (Tu and Lu, 2009) in so-called hydrocode simulations (Zukas, 2004) exist for predictions of the impact response of concrete. Although these analytical, empirical, and numerical methods constitute significantly different approaches, they all share the need for ballistic data within the proper impact velocity range in order to be verified, validated, and assessed regarding their predictive capabilities. Such ballistic data is especially valuable when it is provided in a quantitative form, so that a direct comparison to calculated results is possible, without the need for additional interpretation. While quantitative results are common practice for the depth of penetration or residual velocities damage information is rarely provided quantitatively.
For the ballistic impact on UHPC, several experimental studies investigate the penetration of semi-infinite (Kravanja and Sovják, 2018; Liu et al., 2018; Liu et al., 2022; Wang et al., 2016; Zhang et al., 2005; Zhang et al., 2020a; Zhang et al., 2020b; Zhong et al., 2021) and finite targets (Hanchak et al., 1992; Kristoffersen et al., 2021; Rosenberg et al., 2022; Sovjak et al., 2015; Sovják et al., 2017). Regarding the damage that occurs in the UHPC targets of these references, there are examples providing damage measures for several quantities. For example, cracks and damaged areas are evaluated by using a ruler (Kravanja and Sovják, 2018; Kristoffersen et al., 2021), a microscope, and CAD software evaluation of photos of post mortem targets (Kravanja and Sovják, 2018). In other work (Liu et al., 2018), crater diameters are deduced from averaging several crater diameters on the asymmetric crater areas on photos of post mortem targets and volume loss is gained by measuring the volume of the sand filling up the crater. Another method to obtain a crater diameter for an asymmetric crater area is used in references (Wang et al., 2016; Zhong et al., 2021). In this work, an equivalent crater diameter is defined by a circle that spans the same area as the impact crater, which is determined by evaluating the area of a grid painted on the target surface. Additionally, laser scanning is used to obtain digital crater profiles (Sovják et al., 2017; Wang et al., 2016; Zhong et al., 2021).
With this work, we want to extend the ballistic data on UHPC by providing a comprehensive study on plate perforation by spherical steel projectiles with impact velocities ranging from approximately 600 to 1500 m/s. This velocity range covers the regime of rigid penetration, comparatively small projectile deformation and, at the upper end of the velocity regime, failure of the very hard and brittle spherical steel projectile. As discussed in reference (Rosenberg et al., 2022), such perforation data with the measurement of residual velocities is quite scarce. Even more importantly, in addition to residual velocities for two different plate thicknesses, we provide qualitative and quantitative target damage information for a total of 28 perforation experiments. The qualitative damage is visualized by the inking of digital 3D targets obtained by 3D-scans, while these digital 3D targets are further evaluated to obtain quantitative information in the form of several damage quantities. To the best of our knowledge, such a large comprehensive data set on a UHPC material has not been presented in the existing literature. Particularly, the quantitative damage information as a function of impact velocities for the provided velocity range will allow new discussions on this topic. The recipe for the utilized UHPC, which contains aggregates with a maximum grain size of 8.0 mm as well as steel fibers, has been developed at the University of Kassel (Fehling et al., 2005). This material has previously been investigated with respect to dynamic tensile strength (Thoma et al., 2012), several detonation scenarios (Thoma et al., 2012), aircraft engine impact at velocities below 400 m/s (Nöldgen, 2011; Riedel et al., 2011; Riedel et al., 2010), and shaped charge penetration (Thoma et al., 2012). Furthermore, a planar plate impact study with this UHPC material has recently been published (Sauer et al., 2022). Here, three slightly different lots of this UHPC with (static) compressive cylinder strengths
In the following, we first give an overview of the performed high-velocity impact experiments, and the data acquisition is explained. After that, the first aspect of the obtained data is presented. This constitutes the impact velocity dependence of the measured residual velocities and its discussion with respect to an analytical plate perforation model. Then, the second aspect of the data set, the qualitative damage information, is discussed. This information originates from the 3D-scanning of the post mortem targets. The rest of this work concentrates on the third aspect of the experimental results, that is a data set of quantitative damage information, produced by an evaluation of the digitized 3D targets. After the respective quantities of mass loss, breakthrough diameter, crater diameter, and bulge diameter are introduced and the applied data acquisition is explained, these damage quantities are presented as a function of impact velocity. The occurrence of bulging is a result of a spallation plane and a bridging effect of the steel fibers in the UHPC material. The presentation of the data allows a discussion of several observed trends and comparisons of the quantitative damage data from the UHPC targets. Finally, the findings for the extensive data set are summarized and conclusions are drawn from earlier discussions.
Overview of data from impact experiments with finite UHPC targets
An overview of the acquired experimental information from the conducted ballistic tests is illustrated in Figure 1 together with a schematic presentation of the experimental setup. In these impact experiments, a spherical steel projectile with a diameter of 13.5 mm perforates a UHPC target of dimensions 260 mm × 240 mm × 30 mm (width × height × thickness) that is confined by a matching steel frame. The projectiles were accelerated in a powder gun laboratory accelerator with a sabot. The majority of the experiments use a single target plate, only three tests are performed with a double plate target of the given dimensions without a gap between the two 30 mm thick plates. The target is confined in a steel frame in order to mimic the behavior in a larger structure and to prohibit the target from possible disintegration due to damage and the transferred momentum of the impact. Between the steel frame and the target, a thin layer of polystyrene is used to enable a smooth transition from the UHPC to the steel surface and the frame is tightened carefully in order to avoid pre-stress or even pre-damage of the concrete surface. Schematic depiction of the experimental setup and an overview of the acquired data from the conducted impact experiments. The UHPC targets consist of one or two plates with dimensions of 260 mm × 240 mm × 30 mm (width × height × thickness), while the spherical steel projectile exhibits a diameter of 13.5 mm. The targets are processed by 3D scanning, leading to a digital twin.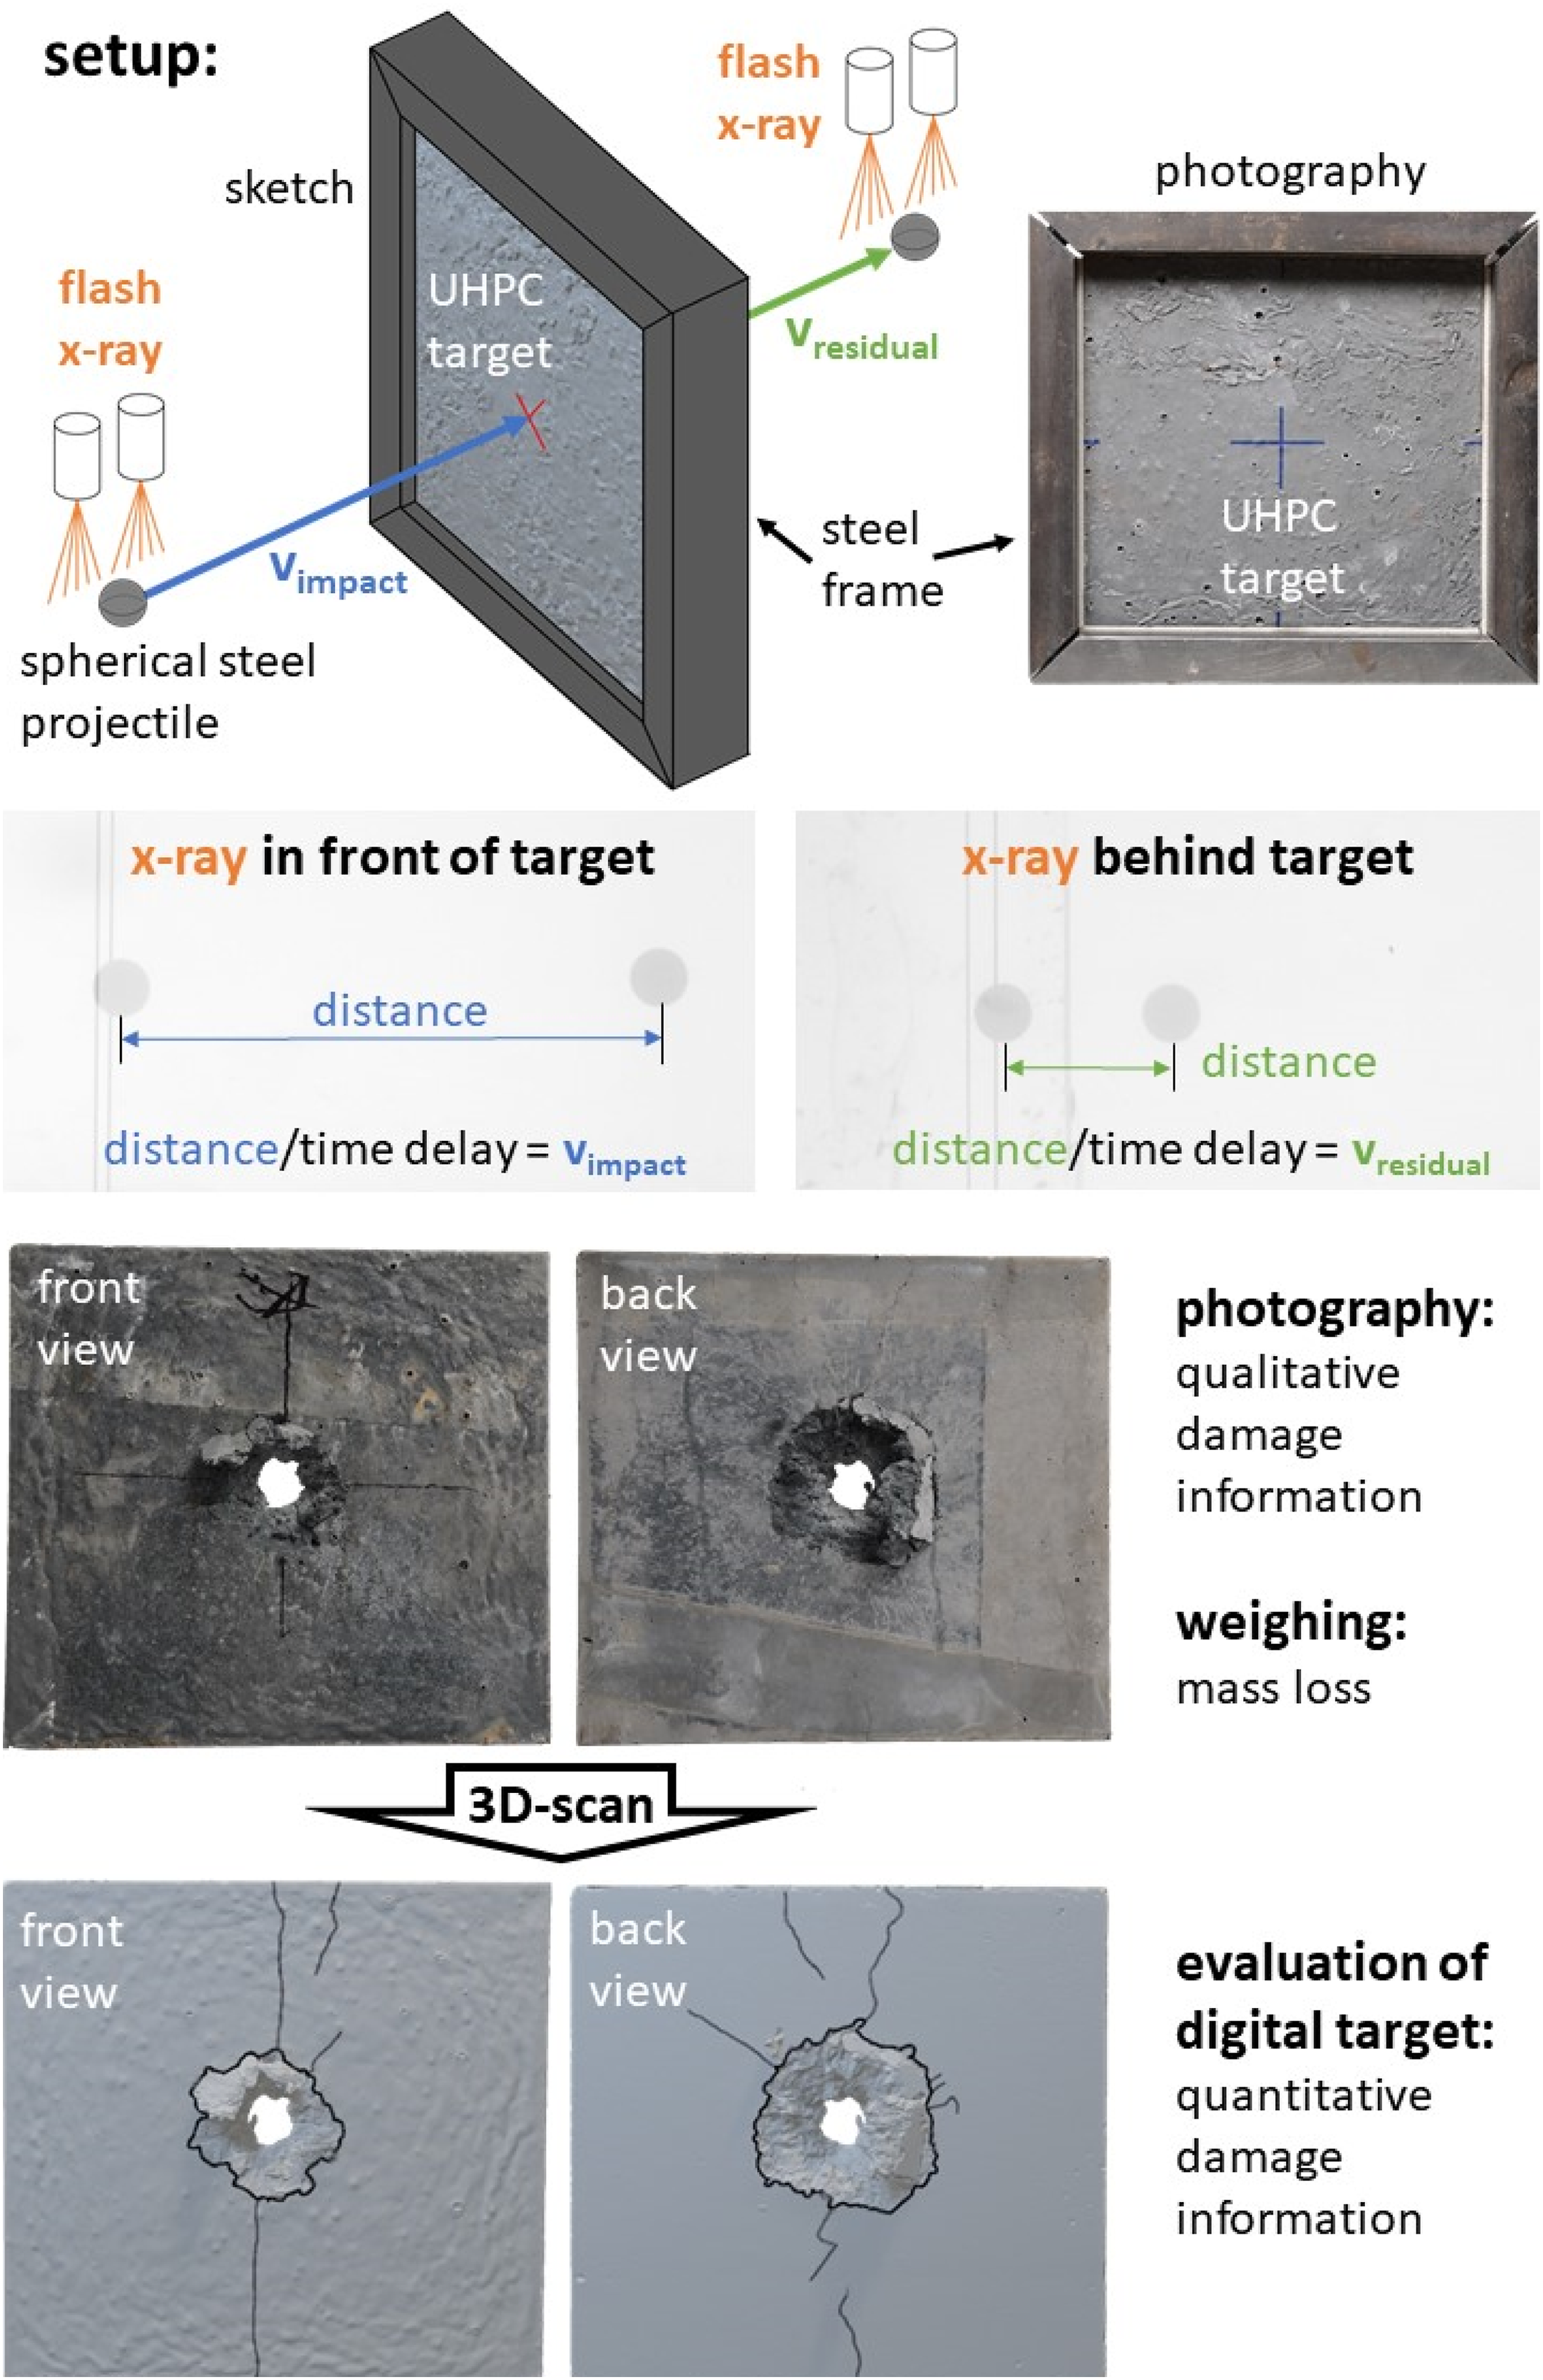
In each experiment, the projectile impacts the target with an obliquity angle of 0° with respect to the front surface normal. In addition, the projectile does not exhibit a pitch or yaw angle due to its spherical shape. The same projectile has previously been used in references (Heine and Wickert, 2015; Heine and Wickert, 2016; Sauer et al., 2017; Sauer et al., 2019; Sauer et al., 2020). It consists of a very hard ball bearing steel and upon ballistic impact on lower strength building materials, only a small plastic deformation was observed at comparatively high impact velocities before projectile failure occurred (Heine and Wickert, 2015; Heine and Wickert, 2016; Sauer et al., 2017; Sauer et al., 2019; Sauer et al., 2020). The X-ray pictures behind the targets of the ballistic tests in this work confirm this behavior for the perforation of UHPC. It is thus a reasonable assumption to idealize the penetration process of the ballistic tests in this work as rigid-body penetration within the impact velocity range without projectile failure, although—of course—there always is some elastic deformation.
Recipe for the investigated UHPC taken from preliminary work at EMI and the University of Kassel (Fehling et al., 2005; Millon, 2014; Nöldgen, 2009; Nöldgen, 2011). This material is denoted as B4Q with 1.0 volume percent of steel fibers.
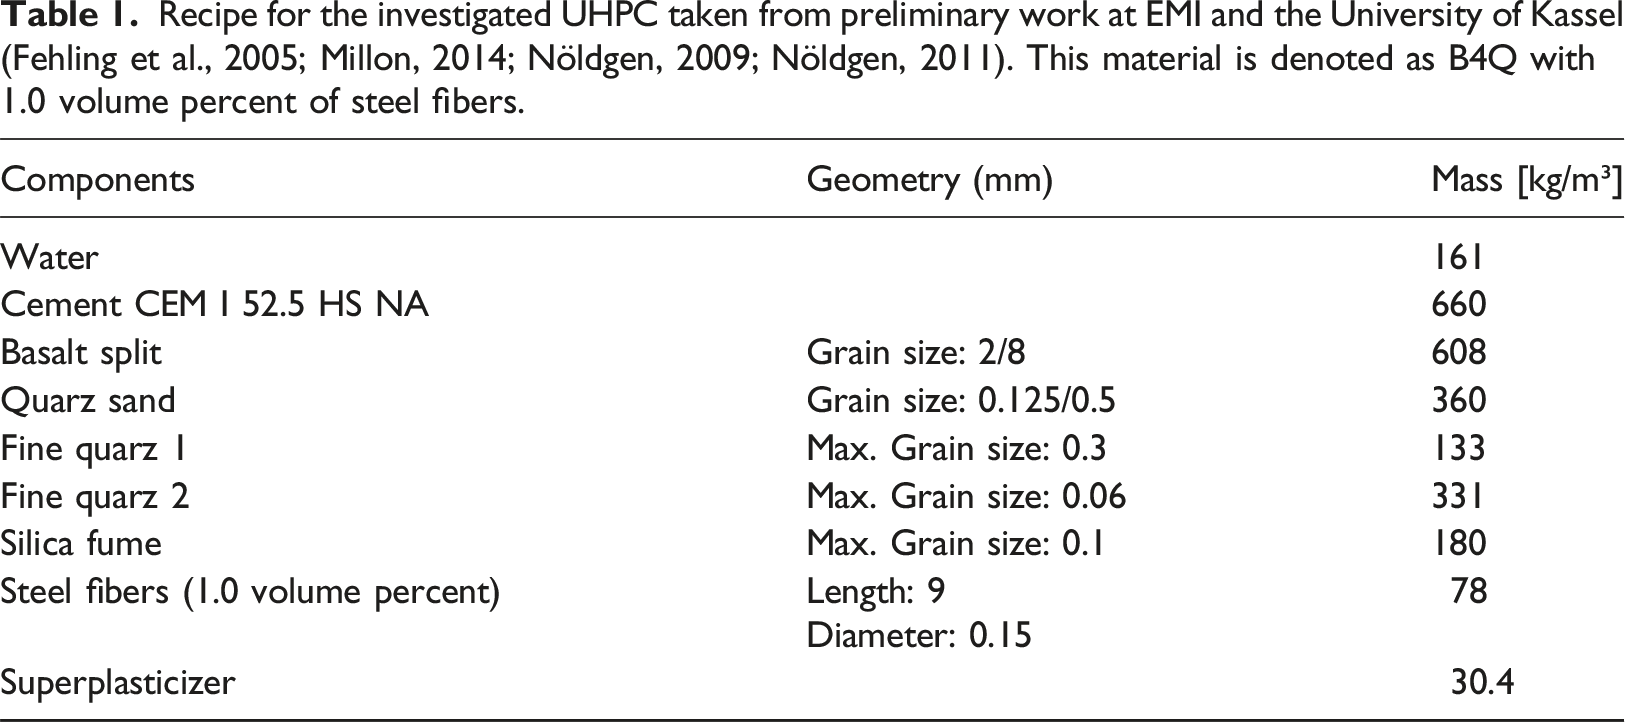
Finding the key steps for the production of the UHPC specimens was an iterative process. The basic mixing recipe was taken from preliminary work at EMI and the University of Kassel (Fehling et al., 2005; Millon, 2014; Nöldgen, 2009; Nöldgen, 2011). The related mixing regime followed the approach from Budelmann and Ewert (Ewert et al., 2014) by keeping the decisive steps in the correct order: • mixing of micro silica and quartz sand • addition and mixing of quartz sand plus cement • adding and mixing water plus superplasticizer • blending • adding and mixing steel fibers plus basalt • final blending
The entire process was carried out with a compulsory mixer and lasted between 15 and 20 min. When the material was poured into the formwork, a corresponding compaction was achieved by successive use of a shaking table (<1 min). So-called dry storage according to the national appendix NA of DIN EN 12390-2 (DIN-Normenausschuss, 2009) was used for all samples. Before the respective material test or final ballistic reference test, all samples were cured for at least 28 days.
Data directly determined from the high-velocity impact experiments with spherical steel projectiles and different lots of finite UHPC targets (defined by
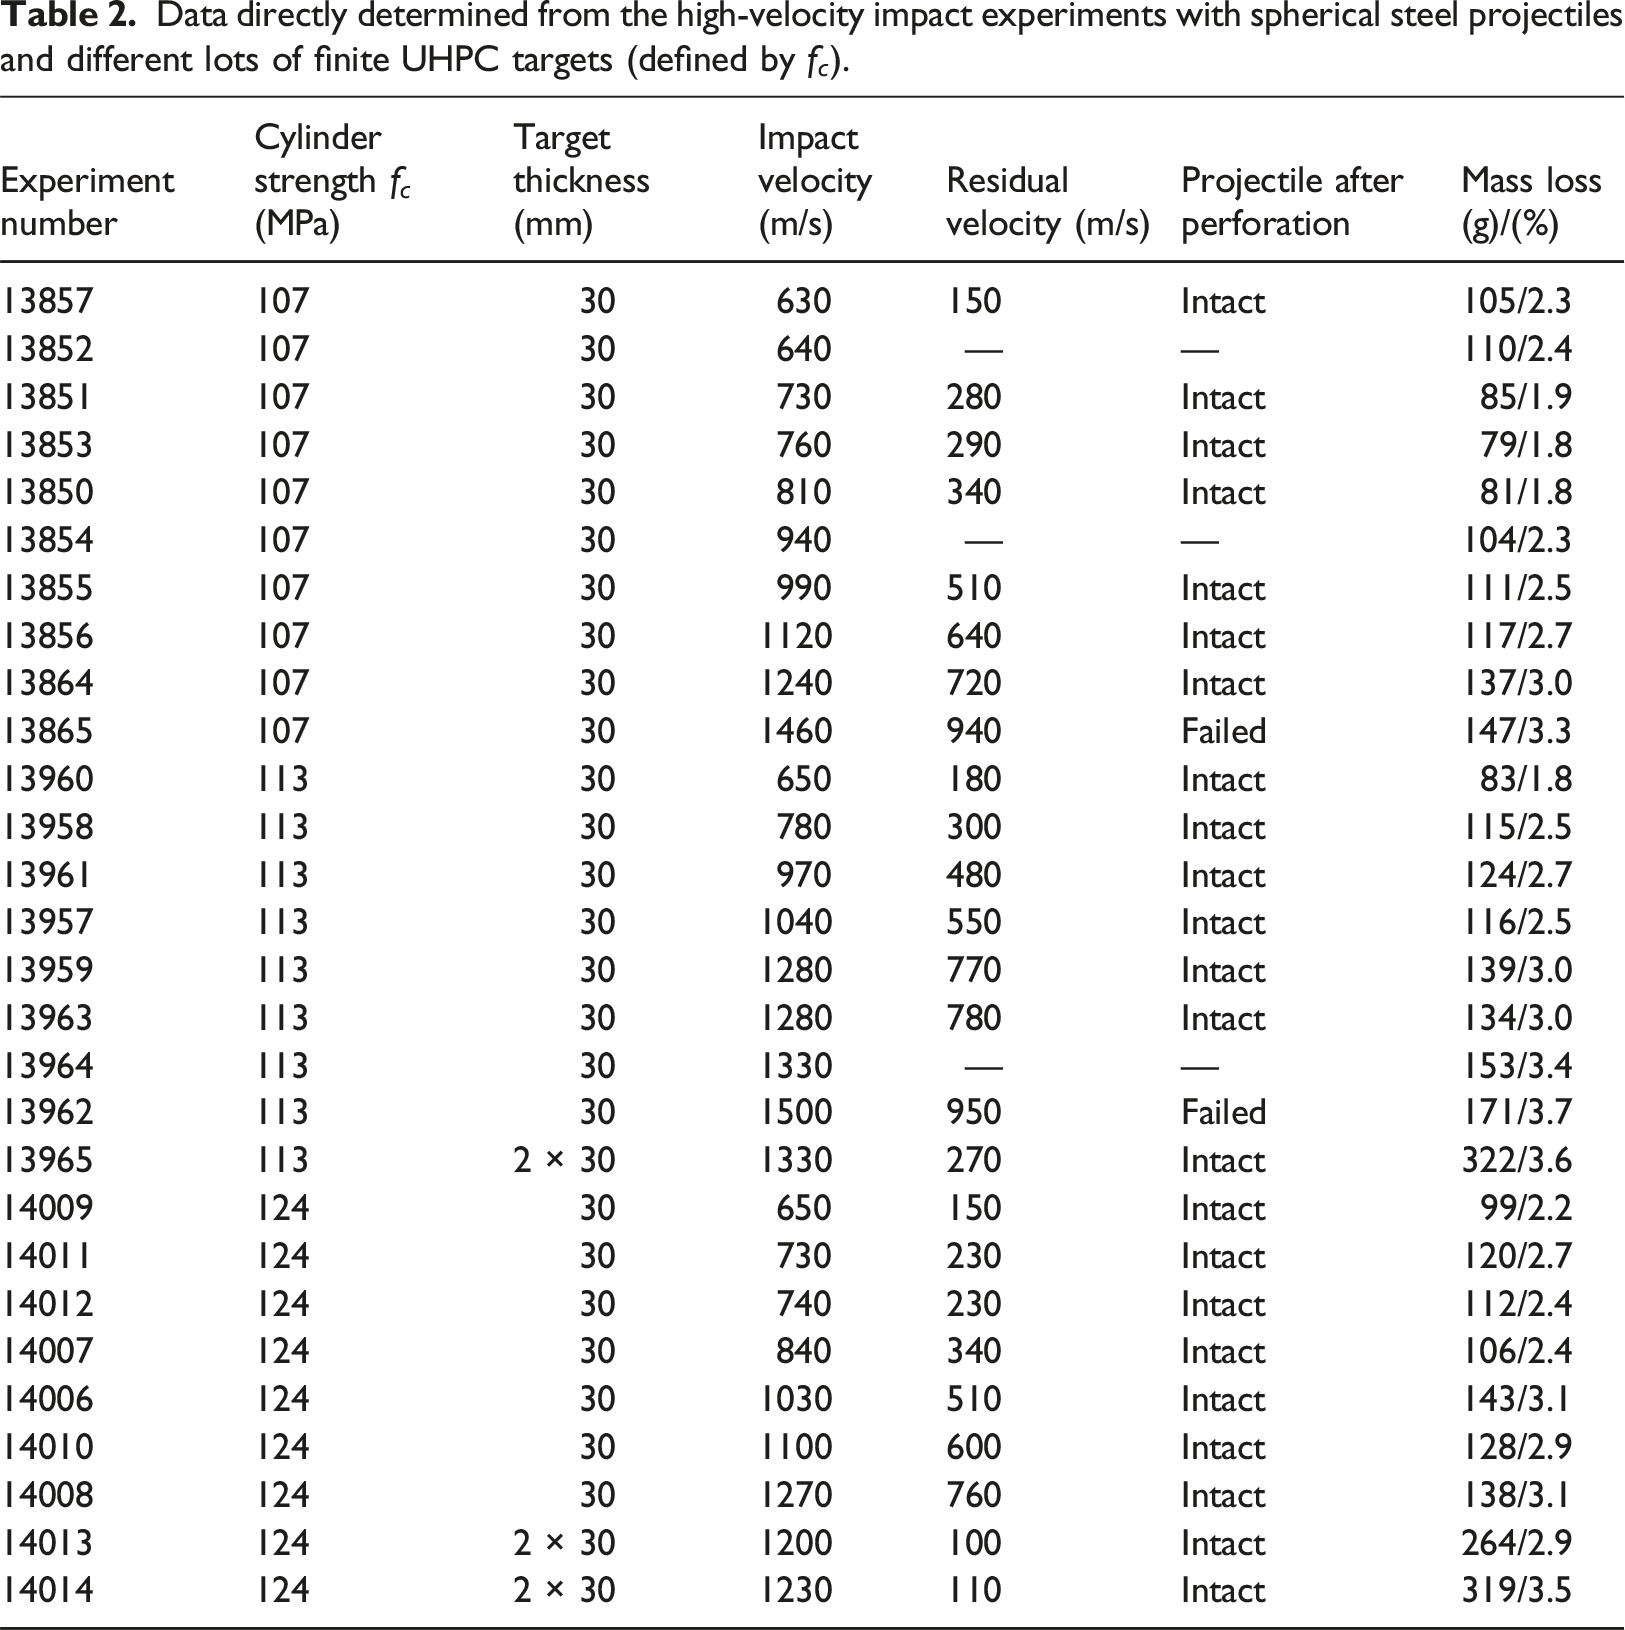
From the ballistic tests presented in the following, quantitative and qualitative information can directly be determined. In front and behind the UHPC target, the impact and the residual velocity, respectively, is measured with flash X-ray diagnostics. From the known time delay between the two X-ray flashes and the distance of the two projectiles determined from the doubly exposed X-ray film, the velocities before and after target perforation are calculated. The estimated measurement uncertainty of the obtained velocities is in the order of 10 m/s, so that all given velocities are rounded to values with this accuracy. Furthermore, the mass loss of the targets is measured through weighing them before and after the perforation. After the impact experiments, photographs of the post mortem targets are taken, which are used to derive qualitative damage information. Damage information here means the qualitative image of damage extent on the front and back surfaces of the targets with the crater shape and the crack propagation beyond the crater. This qualitative damage information is later used for the damage visualization with the digital 3D post mortem targets. In Table 2, the quantitative data directly determined from the high-velocity impact experiments is summarized. For three experiments, no information on the projectile after the perforation was available, that is, there are no flash X-ray images.
In addition to the data directly determined from the ballistic tests, a subsequent data acquisition was performed on digital 3D post mortem targets obtained from 3D-scanning. Details on the 3D-scanning technique and the procedure of using the qualitative damage information from the photos of the post mortem targets for damage visualization with the digital 3D targets are provided in Qualitative damage visualization. In addition, the quantitative damage evaluation with these digital 3D targets is explained in Quantitative damage evaluation and thereafter the obtained damage quantities are introduced, summarized, and presented as a function of impact velocity. In this section, these aspects are merely mentioned and illustrated as a part of Figure 1 in order to provide an overview of the data from the impact experiments as a whole.
Residual velocities of spherical steel projectiles
In the following, different aspects of the residual velocities from Table 2 are discussed. Figure 2 illustrates all residual velocities from Table 2 with full symbols for projectiles that are intact after the perforation of the target and with open symbols for the two cases in which projectile failure occurred. The values from experiments using UHPC targets of the three different lots are depicted with different colors and symbols as a function of their impact velocity in Figure 2. Comparing these three different subsets of residual velocities, there appears to be a small tendency towards smaller values for a higher compressive strength. Explicitly, this means that at similar impact velocities the blue symbols (targets with 124 MPa) are slightly below the green ones (targets with 113 MPa), which then are situated slightly below the black ones (targets with 107 MPa). This tendency can only be observed for the data points of the 30 mm thick targets, due to the small amount of experiments with 60 mm thick targets. With increasing impact velocity, this apparent small trend in the data seems to eventually vanish. In general, the differences in between the three data subsets in Figure 2 are comparatively small, so that the values from the experiments utilizing the three different lots of UHPC targets can be seen as a single data set with some moderate scattering. This unified single data set can be interpreted as data stemming from experiments with a UHPC target material with a mean compressive cylinder strength of 115 MPa. Experimentally obtained residual velocities of spherical steel projectiles (13.5 mm diameter) as a function of impact velocity after the perforation of UHPC targets from three different lots.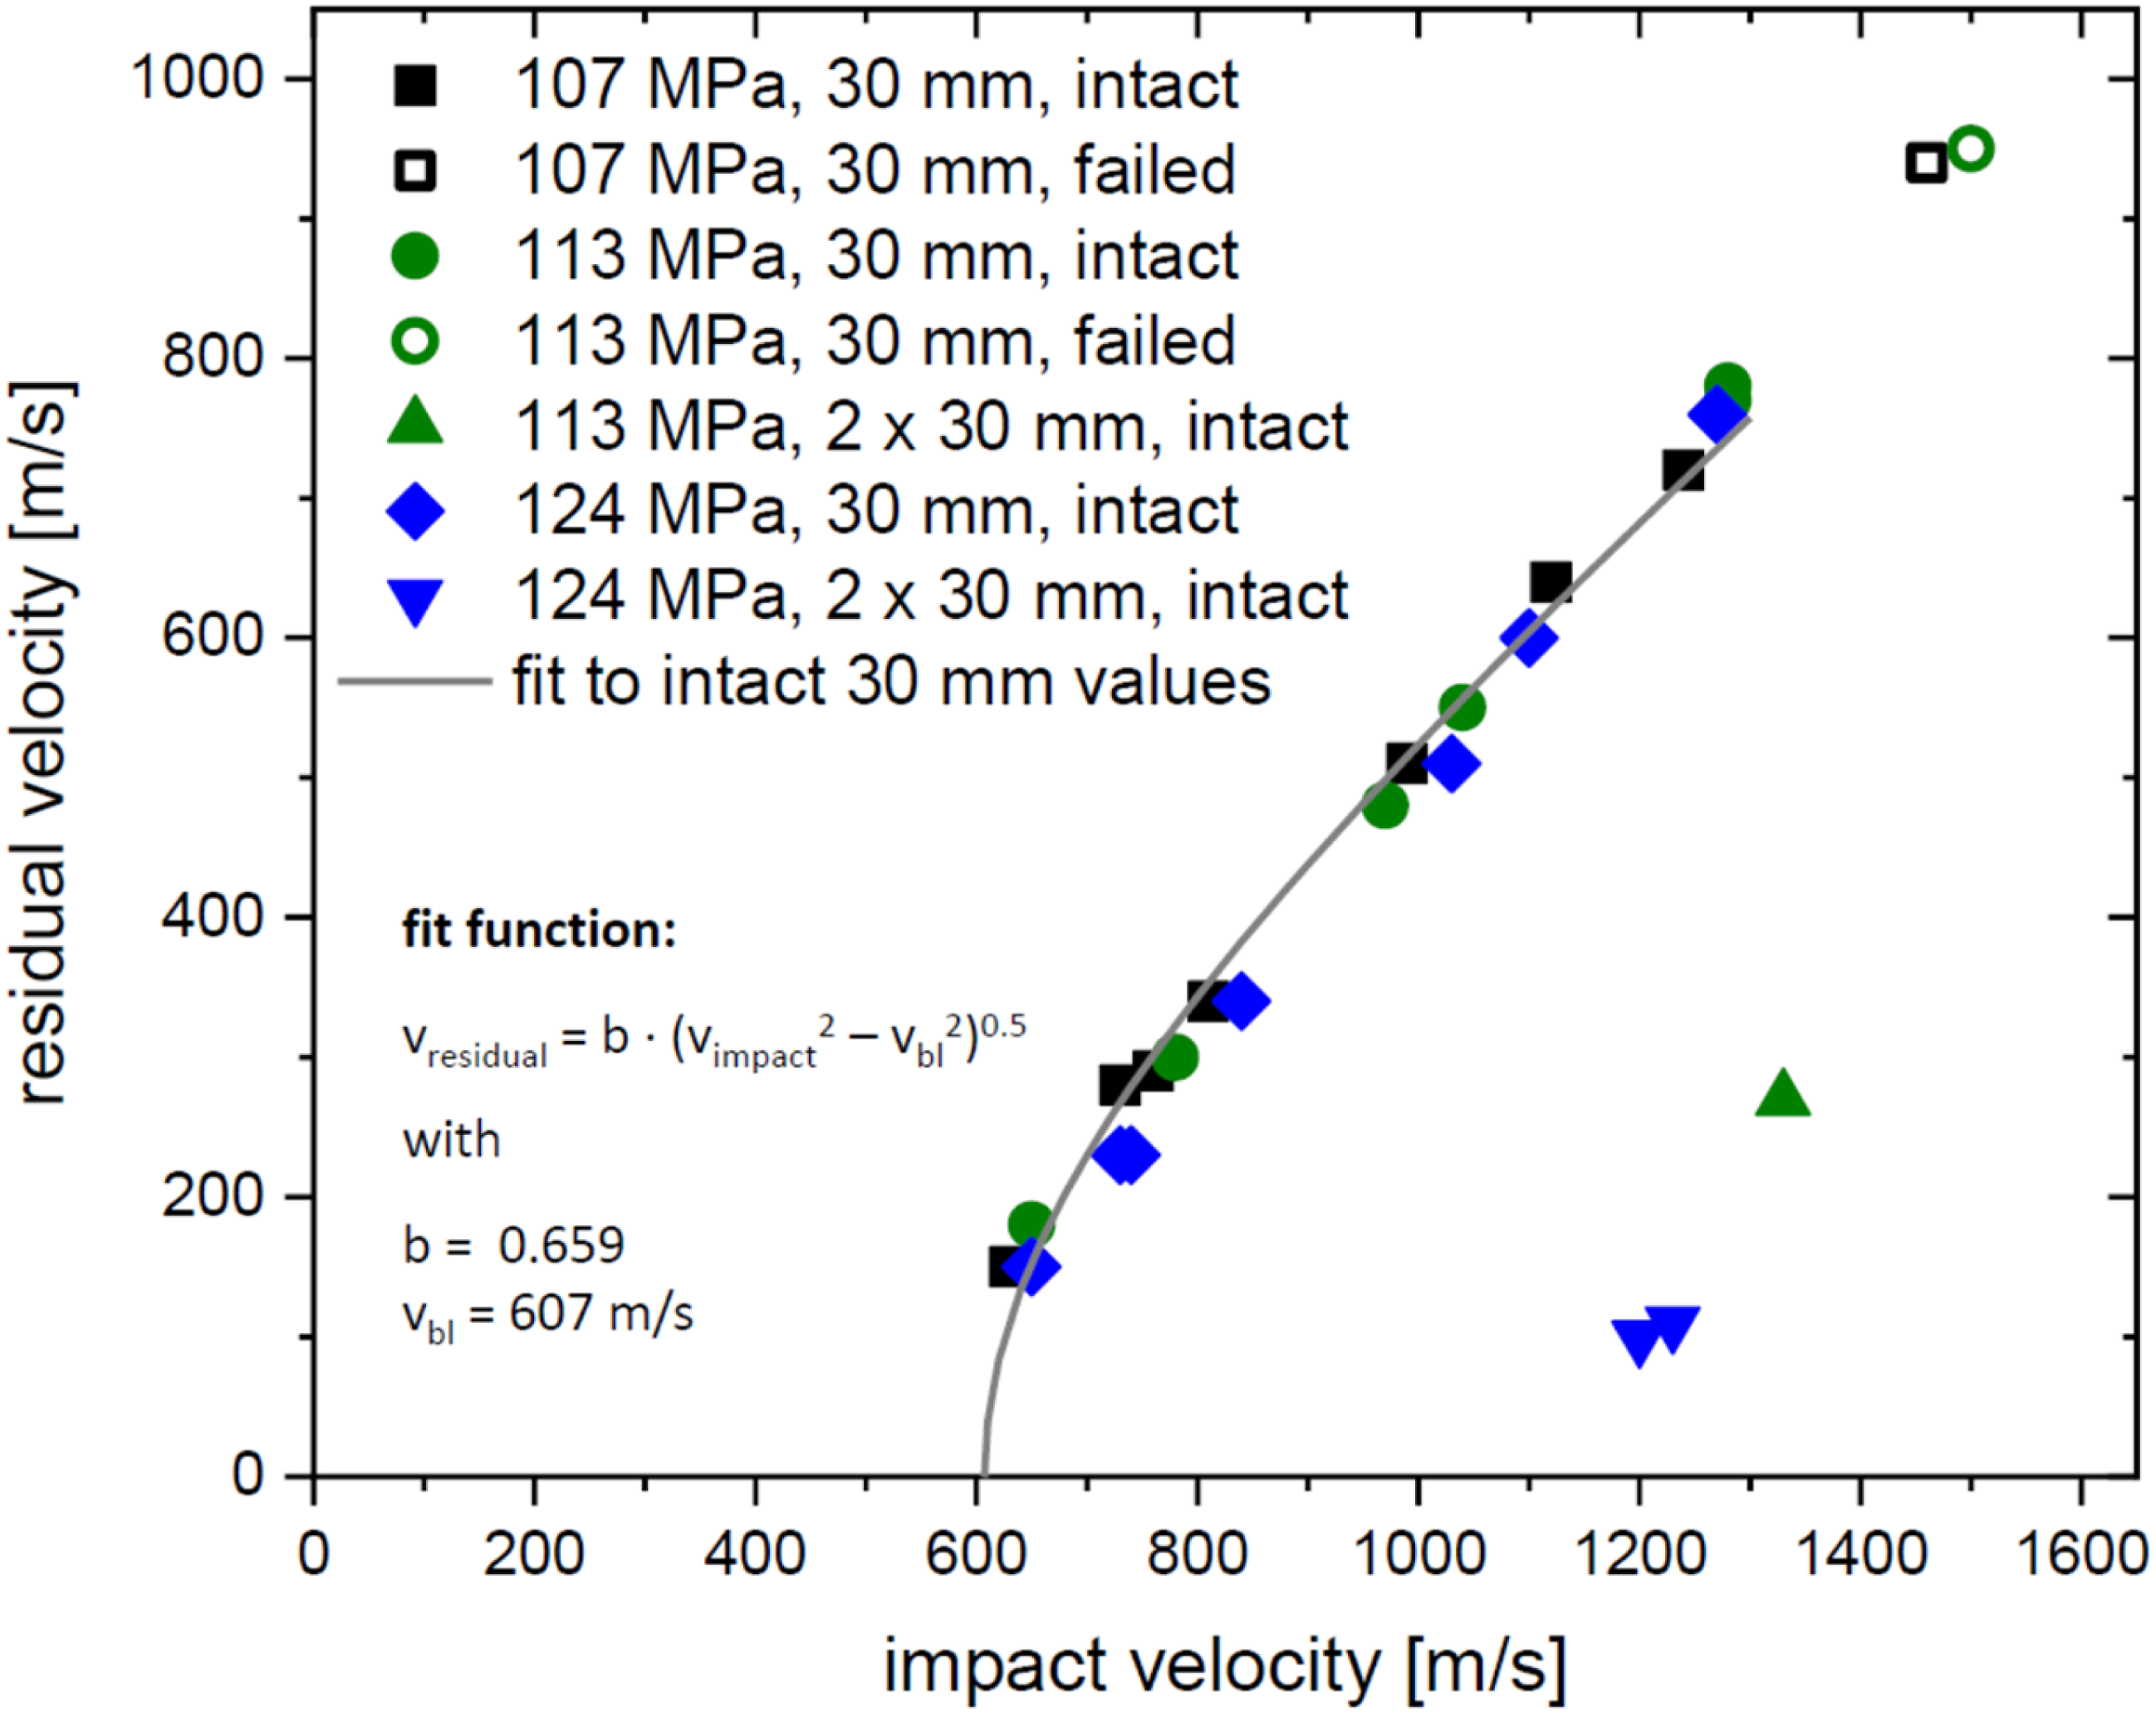
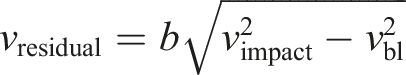
Parameters
There seems to be a correlation of the parameter
Qualitative damage visualization
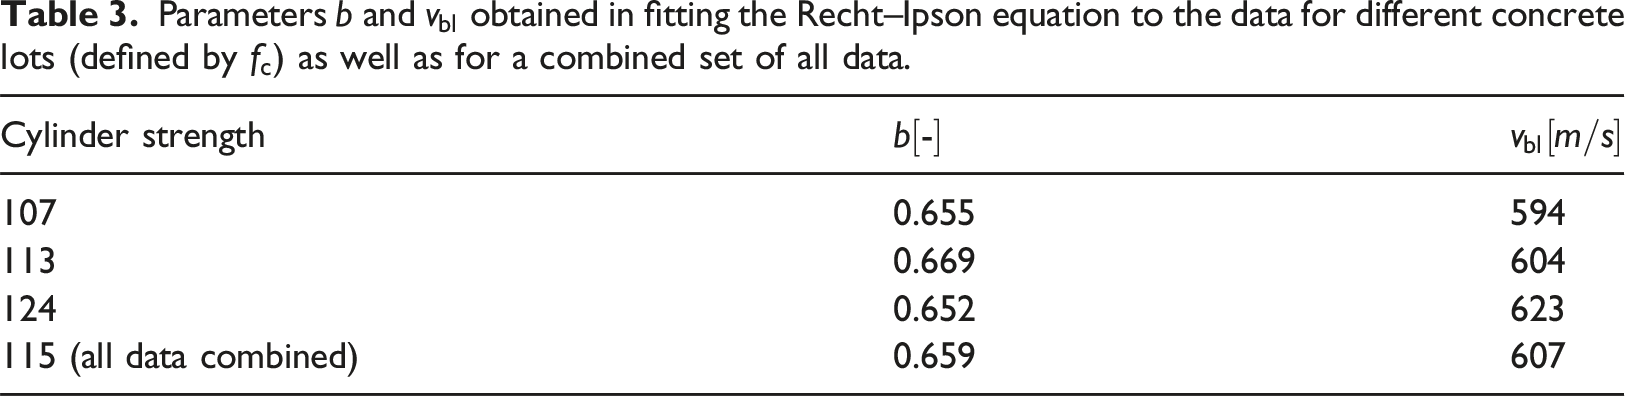
As already mentioned in the discussion of the overview of the data acquisition illustrated in Figure 1, the perforated UHPC targets were used to produce digital 3D post mortem targets by 3D-scanning. The experimental setup, the process of damage visualization with the obtained digital 3D targets, and a perspective view of an exemplary digital target with qualitative damage information is illustrated in Figure 3. The experimental setup in the upper left shows the placement of the UHPC target on a rotatable table which is mounted on a fixed optical table. The control software of the 3D-scanner defines the rotation steps of a scanning procedure and after each increment a partial scan of the target is performed. The software combines the information of all partial scans and produces a digital 3D image of the UHPC target. The resulting digital 3D target is a file consisting of points, which are combined to triangles defining a closed surface. Depending on the size of the features in a particular part on the surface, the distance between the points varies significantly. In the evaluated regions of the target, the distance of the points in this format is smaller than 1.0 mm. In addition, the 3D-scanner has an accuracy of at least 500 µm for the selected view field size of 500 mm. Consequently, the evaluation of the surface of the digital 3D targets can at least be performed with an accuracy of approximately 1.0 mm. Experimental setup of the 3D-scan and depiction of a resulting exemplary digital 3D target. The qualitative damage information is drawn onto the digital 3D target to visualize damage.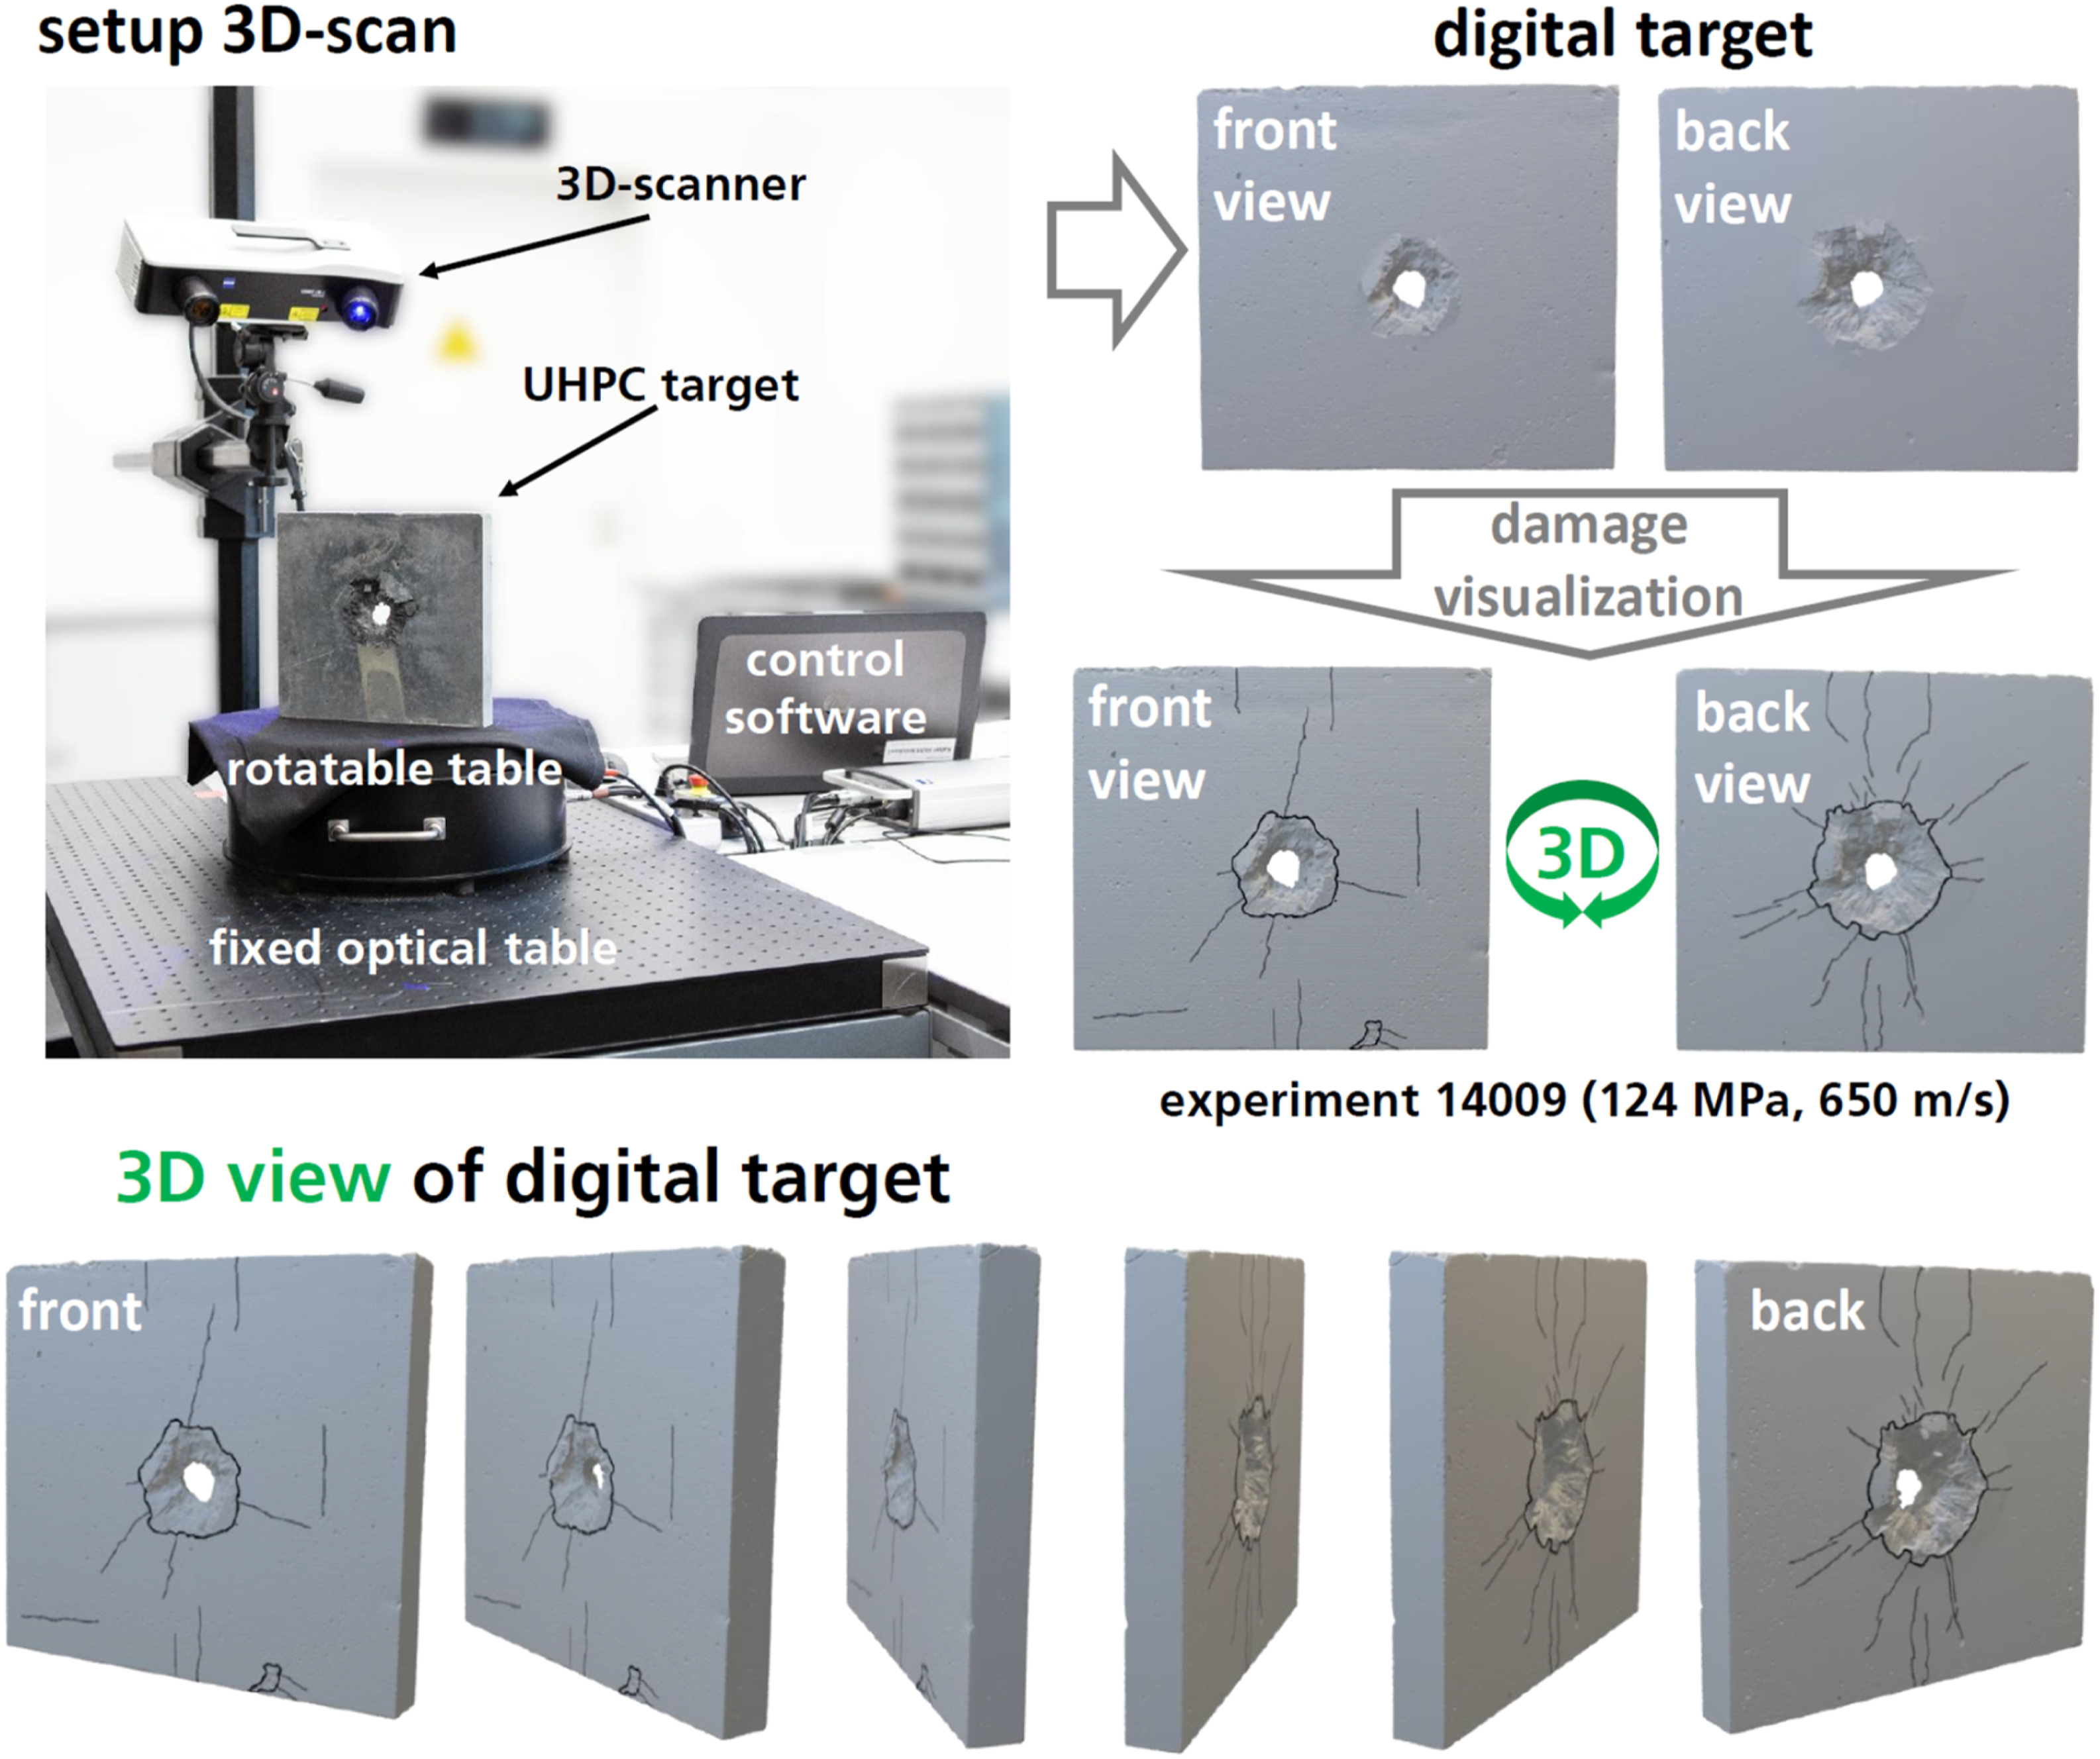
In a subsequent evaluation step after the scanning, the qualitative damage information is drawn onto the digital 3D targets. In particular, the outline of the front and back crater is marked in black, while the cracks propagating beyond the crater areas are drawn onto the surfaces of the digital targets in dark gray. The upper right of Figure 3 depicts an example of a digital target before and after this procedure in front and back view. This qualitative damage information is mainly extracted from the photos of the post mortem targets but also stems from the digital 3D targets themselves. Depending on the nature of the particular qualitative damage, it is either the one or the other source which reveals more details. In this procedure, there is some room for interpretation which features are considered in what way for the desired visualization of the visible damage. For example, material that is almost separated from the target but still attached to it, due to the steel fibers in the UHPC, can be seen as part of the crater, so that the crater outline is drawn to include this material in the crater area. Another possibility is to exclude this material from the crater and see the edge of the bulge as a crack. In our qualitative damage visualization, we decided to do the former for the strong cases of bulging, while in more subtle cases of bulging, the latter interpretation was used. However, there are always cases which are in some intermediate regime, where a clear categorization is difficult. Hence, only qualitative trends are discussed in the comparison of the 3D post mortem targets with qualitative damage visualization.
In Figure 4, two exemplary digital targets with qualitative damage information from each lot of UHPC material are presented in front and back view. For all three lots, one target from an experiment with a lower (around 800 m/s) and one with a higher impact velocity (around 1250 m/s) are selected for this illustration in order to discuss some qualitative trends. Such a trend, which is visible for almost all targets, is a higher number of cracks on the rear side surface than on the front. In addition, there is also a tendency for a larger size of the scab crater (back) than that of the spall crater (front). However, in some cases the expected experimental scatter for an inhomogeneous material like concrete leads to exceptions from these and other observed trends. Moreover, for all three lots of UHPC, an increase of visible damage (craters and cracks) with increasing impact velocity is found on both the front and the back of the targets. Again, this is not a continuous increase for each experiment but rather a general trend with some exceptions due to experimental scattering. In a comparison of this qualitative, visible damage information from the targets of the three different lots, it appears that the damage increases with the growing target strengths from 107 to 113 and then to 124 MPa. This trend mainly stems from a growing number of visible cracks. The exemplary targets in Figure 4 exhibit this trend on both sides for both impact velocities. Thus, a general trend for an increased brittleness with higher compressive strength appears to be present when the three lots are compared. As interesting as these observed qualitative trends are, a more significant analysis that also allows to gain an impression of the involved experimental scattering requires quantitative data. In the following section, this data will be provided in the form of several damage quantities extracted from the digital 3D targets. Presentation of qualitative damage (crater outlines and cracks) on the front and back surfaces of perforated UHPC targets (two exemplary targets from each lot).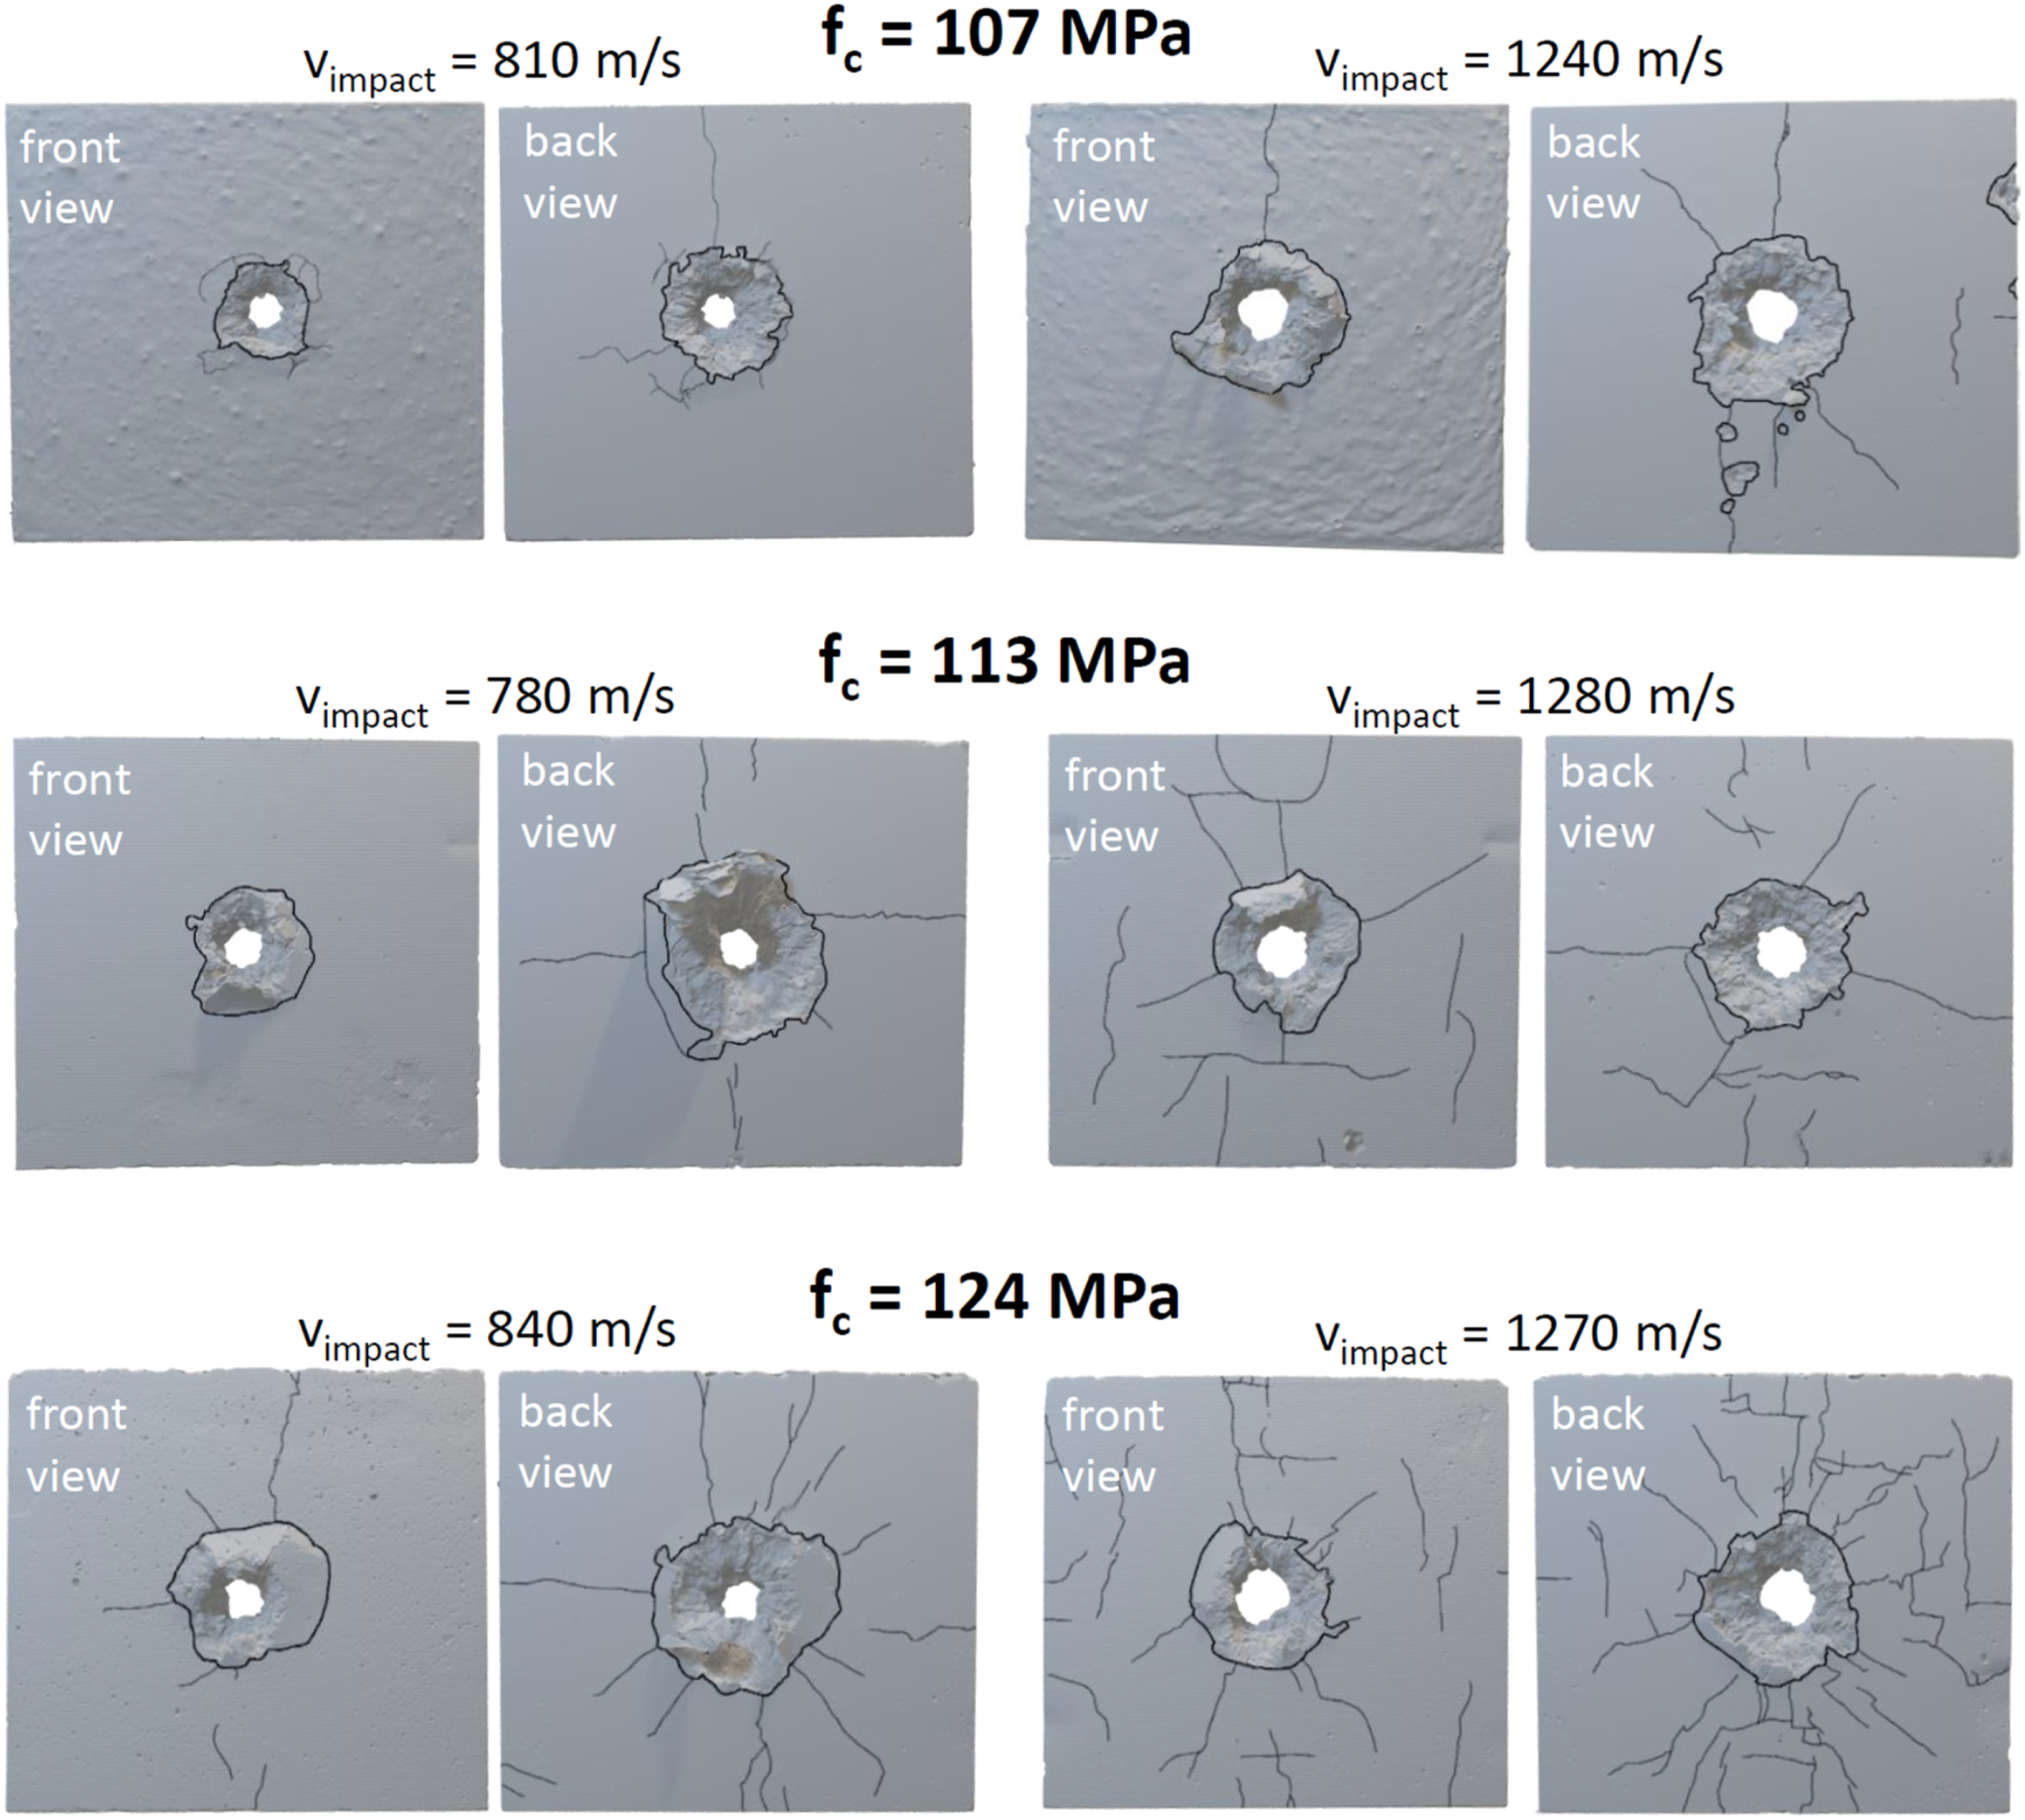
Quantitative damage evaluation
In this section, the quantitative damage evaluation of the digital 3D post mortem targets is explained for three different types of damage quantities. These are • the minimum breakthrough diameter • the maximum crater diameter • the maximum bulge diameter
The latter two quantities are extracted from the front and the back surfaces, so that for each target, two quantities exist for the maximum crater and bulge diameter. In addition to these quantities extracted from digital 3D targets, the mass loss of the targets, gained by weighing them before and after the impact experiment, is also discussed. The corresponding values of the mass loss are summarized in Table 2, since this data is directly determined from the ballistic impact experiments. All these four different types of quantities are presented together in this section, because each of them describes an aspect of quantitative target damage and in combination they allow a comprehensive discussion of this matter at the end of the section.
Definition of damage quantities
In the top part of Figure 5, six damage quantities are introduced with a corresponding icon that schematically depicts the nature of the specific quantity. For the mass loss, a crater profile in cross section is chosen, which is intended to illustrate the missing material in the crater. As a seventh quantity, the percentage of mass loss is considered and for the corresponding icon a percent sign is added. The five other quantities are represented in their icon by a dashed circle in the color chosen for the particular type of quantity. These icons will be used in the following as a graphical representation of the corresponding damage quantity. Introduction of the damage quantities presented in the following figures with corresponding generic icons for each quantity. For an exemplary digital 3D post mortem target, the quantities are illustrated. This type of presentation is provided for all targets in the Annex.
The minimum breakthrough diameter is defined as the diameter of a circle at the narrowest position of the crater which excludes all concrete material. It is named minimum breakthrough diameter in order to stress the fact that it constitutes the smallest choice for such a quantity. Definitions of larger circles might be chosen that for example, constitute a circle of an equivalent area of the asymmetric shape of the breakthrough area in front view. We chose the definition of a minimum circle since it is reasonable to determine this quantity as the diameter of a circular area that can be passed through without contact to the target material. Additionally, this definition appeared to represent the most reproducible way of determining this quantity. To extract this minimum breakthrough diameter, three points on the surface of the digital 3D target are chosen which automatically define a circle in the analysis software. If this circle appears to be the largest one that properly excludes all concrete material and is approximately parallel to the front and back surfaces of the target, its diameter is used as the minimum breakthrough diameter of the evaluated target. Otherwise, the procedure is repeated with three other points. For a double target, the smaller of the two values is chosen in accordance with the above given motivation for the definition of this quantity. In the bottom half of Figure 5, the minimum breakthrough diameter is depicted in the cross section (orange double arrow), the front, and the back view (orange dashed circle) of an exemplary digital 3D target.
The maximum crater diameter is defined as the diameter of a circle that includes the entire area of missing material on the target surface. In contrast to the definition for the breakthrough diameter, the largest choice for this quantity is used and hence, the name maximum crater diameter was selected. In this case, including all the area of missing material in the circle, and not an equivalent area, appears a reasonable choice, because with that, we provide something in the sense of an upper limit for a quantity describing damage. This is often the desired information for a risk analysis, for example, for resulting ejecta and debris. Again, this definition also appears to represent the most reproducible way of determination. As for the minimum breakthrough diameter, three points on the surface of the digital 3D target are chosen to define a circle in the analysis software. If this circle appears to be the smallest one that properly includes all missing concrete material on the front or back surface of the target, its diameter is used as the maximum front crater diameter, or the maximum back crater diameter, respectively. In the front and back view of the exemplary digital 3D target in Figure 5, the corresponding maximum crater diameter is illustrated as a red dashed circle, while in the cross section the two quantities are shown as red double arrows on the respective side of the target.
The maximum bulge diameter is defined as the diameter of a circle that includes the entire area on the target surface exhibiting bulging. In this case, bulging means that at a certain asymmetrically shaped edge, a change of the rather flat surface emerges and the concrete material beyond this edge is lifted upwards. In references (Wang et al., 2016; Zhong et al., 2021), such a behavior is also found for fiber reinforced cement-based composite materials. It can be explained by tensile states which are created by overlapping waves and a resulting spallation plane in the vicinity of the target surface. The material above this spallation plane is hence lifted upwards, but in some cases still attached to the target due to a bridging effect of the fibers. Consequently, in the UHPC material used in this work, such bulging occurs whenever the necessary energy for the pullout of the steel fibers is not overcome above a spallation plane. In contrast to ductile targets, where the full bulge can be seen in certain cases, in the brittle UHPC targets only the remainder of the bulge is present in the post mortem target, while most of it has been ejected as debris. As for the crater diameter, we chose the definition of a largest diameter and hence name the quantity maximum bulge diameter. The motivation for this choice as well as the determination method are equal to the one explained for the maximum crater diameter. In some cases, no bulging can be observed outside of the circular area of the crater. In these cases, we interpret the value of the maximum crater diameter as being equal to the one of the maximum bulge diameter. This interpretation is based on the idea that the crater is also produced by a spallation plane, but with enough energy to completely eject the material that would otherwise define the bulge diameter. In the bottom of Figure 5, the maximum bulge diameters of the front and the back surface of the exemplary target are shown with purple dashed circles and purple double arrows.
Data extracted from digital 3D targets produced by 3D-scanning as illustrated in Figure 3. The different lots of finite UHPC targets were perforated in high-velocity impact experiments with spherical steel projectiles.
Quantitative damage analysis of the impact experiments
In Figure 6, the total mass loss is depicted in panel (a) while panel (b) illustrates the percentage of mass loss. The corresponding values of both quantities are given in Table 2. For the values extracted from the 30 mm thick targets, a general trend of increasing values with increasing impact velocity can be observed. In addition, the total mass loss in panel (a) shows the expected difference between the values from the 30 mm and the 2 × 30 mm thick targets with the latter ones being larger than the former. In contrast, the display of the percentage of mass loss in panel (b) reveals that all data points appear to form a single data set. In order to discuss whether this is a general trend for finite UHPC targets, we would need additional data from targets with different thicknesses. The comparison of the values from the 30 mm thick targets produced in different lots might show a small trend for larger values originating from targets with higher compressive strengths. However, this small trend appears to be only visible above impact velocities of 700 m/s. Mass loss from weighing the targets before and after the impact experiments as a function of impact velocity. Panel (a) depicts total values, while panel (b) shows the percentage of lost mass.
The minimum breakthrough diameters of all perforated UHPC targets are presented in Figure 7. With increasing impact velocity, the data from 30 mm thick targets shows a trend of increasing values. Moreover, the data points from the 2 × 30 mm thick targets are situated significantly below the ones from the 30 mm thick targets. In all three cases, this value corresponds to the one obtained for the second plate. In addition, two of these three 2 × 30 mm values are only slightly larger than the projectile diameter (lower dashed gray line) which hints to the existence of a tunneling phase in the penetration of the targets with a total thickness of 60 mm. This thickness corresponds to 4.4 projectile diameters. In references (Rosenberg et al., 2022; Rosenberg and Kositski, 2016), an entrance and exit phase of a total of 5.5 projectile diameters is proposed, so that beyond this thickness, the emergence of a tunneling phase is expected. Considering that in references (Rosenberg et al., 2022; Rosenberg and Kositski, 2016) slender projectiles are used, we can interpret the small difference to the spherical projectiles in this work as a consequence of the different projectile shapes. Despite these different shapes, our finding is still in rough agreement with references (Rosenberg et al., 2022; Rosenberg and Kositski, 2016). Furthermore, the data illustrated in Figure 7, shows no significant difference to the minimum breakthrough diameters stemming from targets with different compressive strengths. Minimum breakthrough diameter from the evaluation of the digital 3D post mortem targets as a function of impact velocity. The dashed lines provide a relevant additional scale.
Figure 8 presents the two quantities of the maximum front crater diameter in panel (a) and the maximum back crater diameter in panel (b) as a function of impact velocity. For the maximum front crater diameter, increasing values with an increasing impact velocity can be observed for the 30 mm thick targets. Interestingly, the data points from the 2 × 30 mm thick targets exhibit similar values as the ones from the 30 mm thick targets. In addition, there appears to be a small trend towards larger values of the front crater diameter with higher values of the compressive strength of the corresponding targets. In contrast to the 30 mm values in panel (a), the ones in panel (b) do not show a significant increase with increasing impact velocities. Thus, the maximum front crater diameter appears to have a different impact velocity dependence than the maximum back crater diameter, with the latter quantity exhibiting rather constant values for all realized impact velocities. Additionally, the data points of the back crater diameter from the 2 × 30 mm thick targets can be observed a little above the ones from the 30 mm thick targets in panel (b). Again, this observation differs from the one made for the front crater diameter in panel (a). Moreover, no clear trend can be found for the values of the maximum back crater diameter with the different compressive strengths of the corresponding targets. This is another difference compared to the results for the maximum front crater diameter. Maximum crater diameters as a function of impact velocity. Panel (a) shows values extracted from the front surface, while panel (b) illustrates values obtained from the back surface.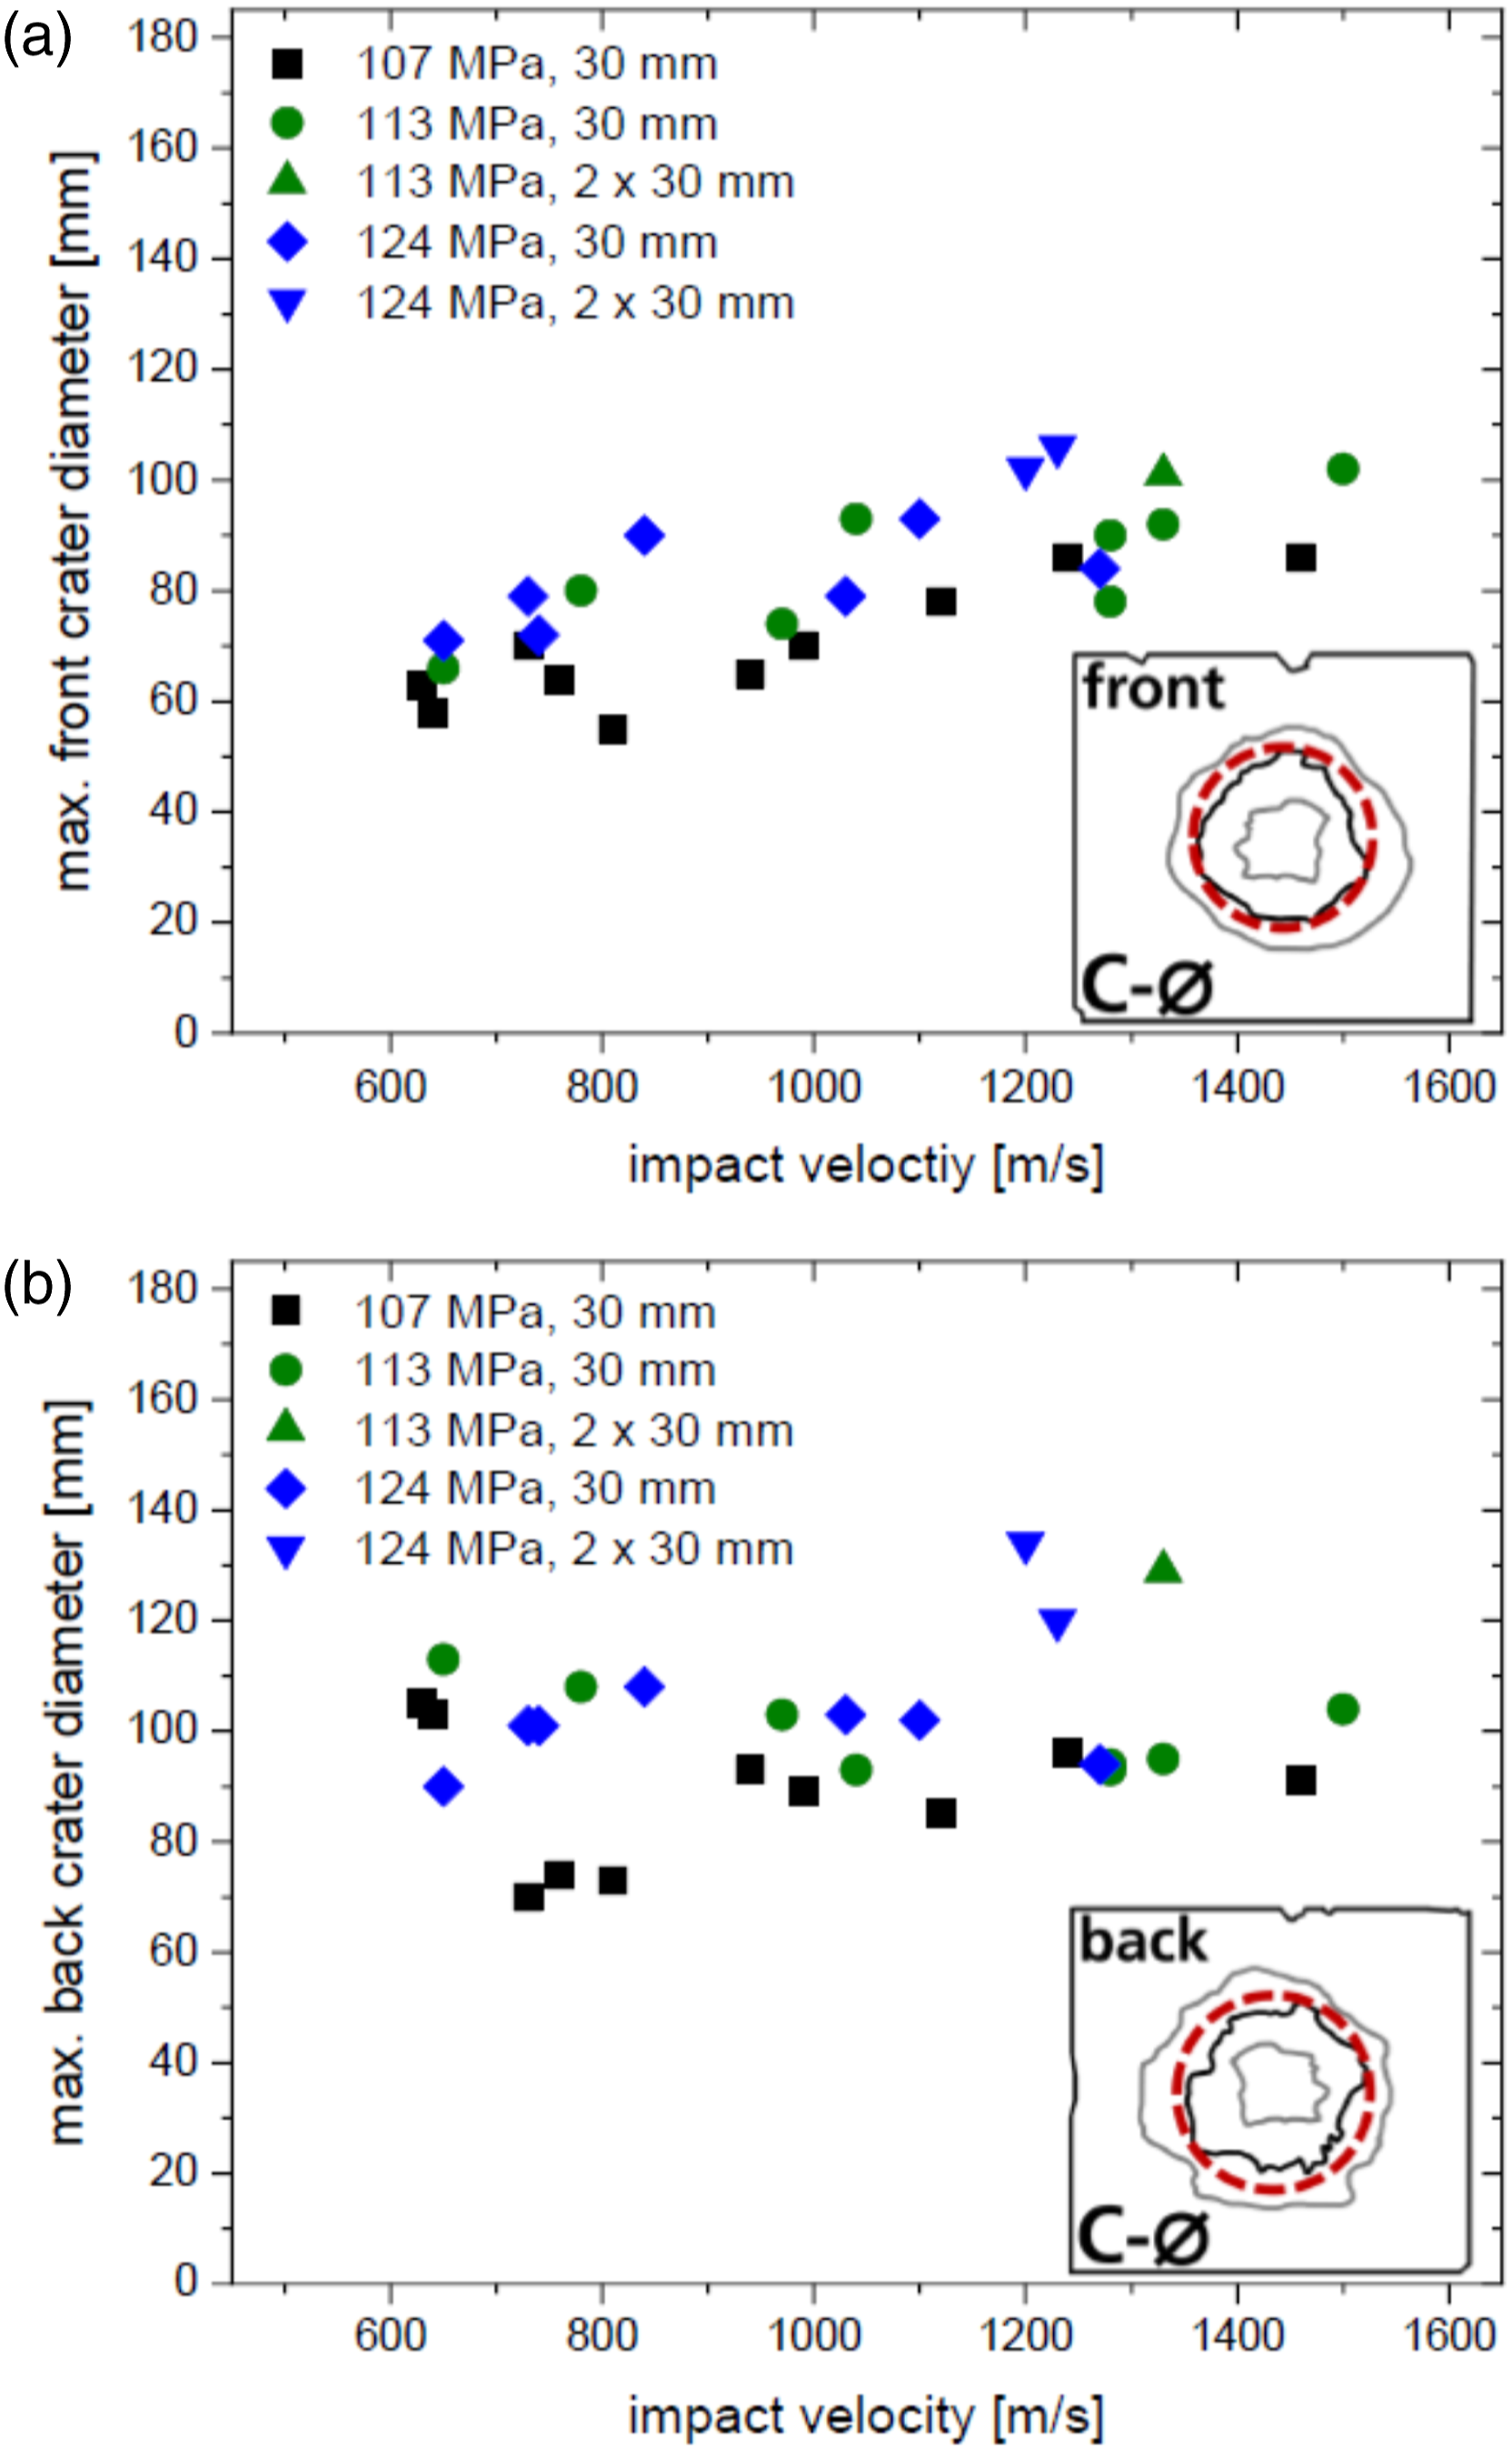
The maximum bulge diameters extracted from the front and the back surfaces of the UHPC targets are displayed in Figure 9. The dependence of the maximum front and back bulge diameters from the 30 mm thick targets on the impact velocity is quite similar to the one found for the maximum crater diameters in Figure 8. In panel (a), the values of the maximum front bulge diameter increase with increasing impact velocities, while the ones in panel (b) for the maximum back bulge diameter remain fairly constant. For both quantities, the values from the 2 × 30 mm thick targets are larger than the ones from the 30 mm thick targets. Moreover, only for the maximum back bulge diameter a visible influence on the values by the compressive strength of the targets can be observed. In this case, the values corresponding to the lots with 113 and 124 MPa are a little larger than the ones from the targets with a compressive strength of 107 MPa. Maximum bulge diameters as a function of impact velocity. Panel (a) presents values obtained from the front surface, while panel (b) shows values extracted from the back surface.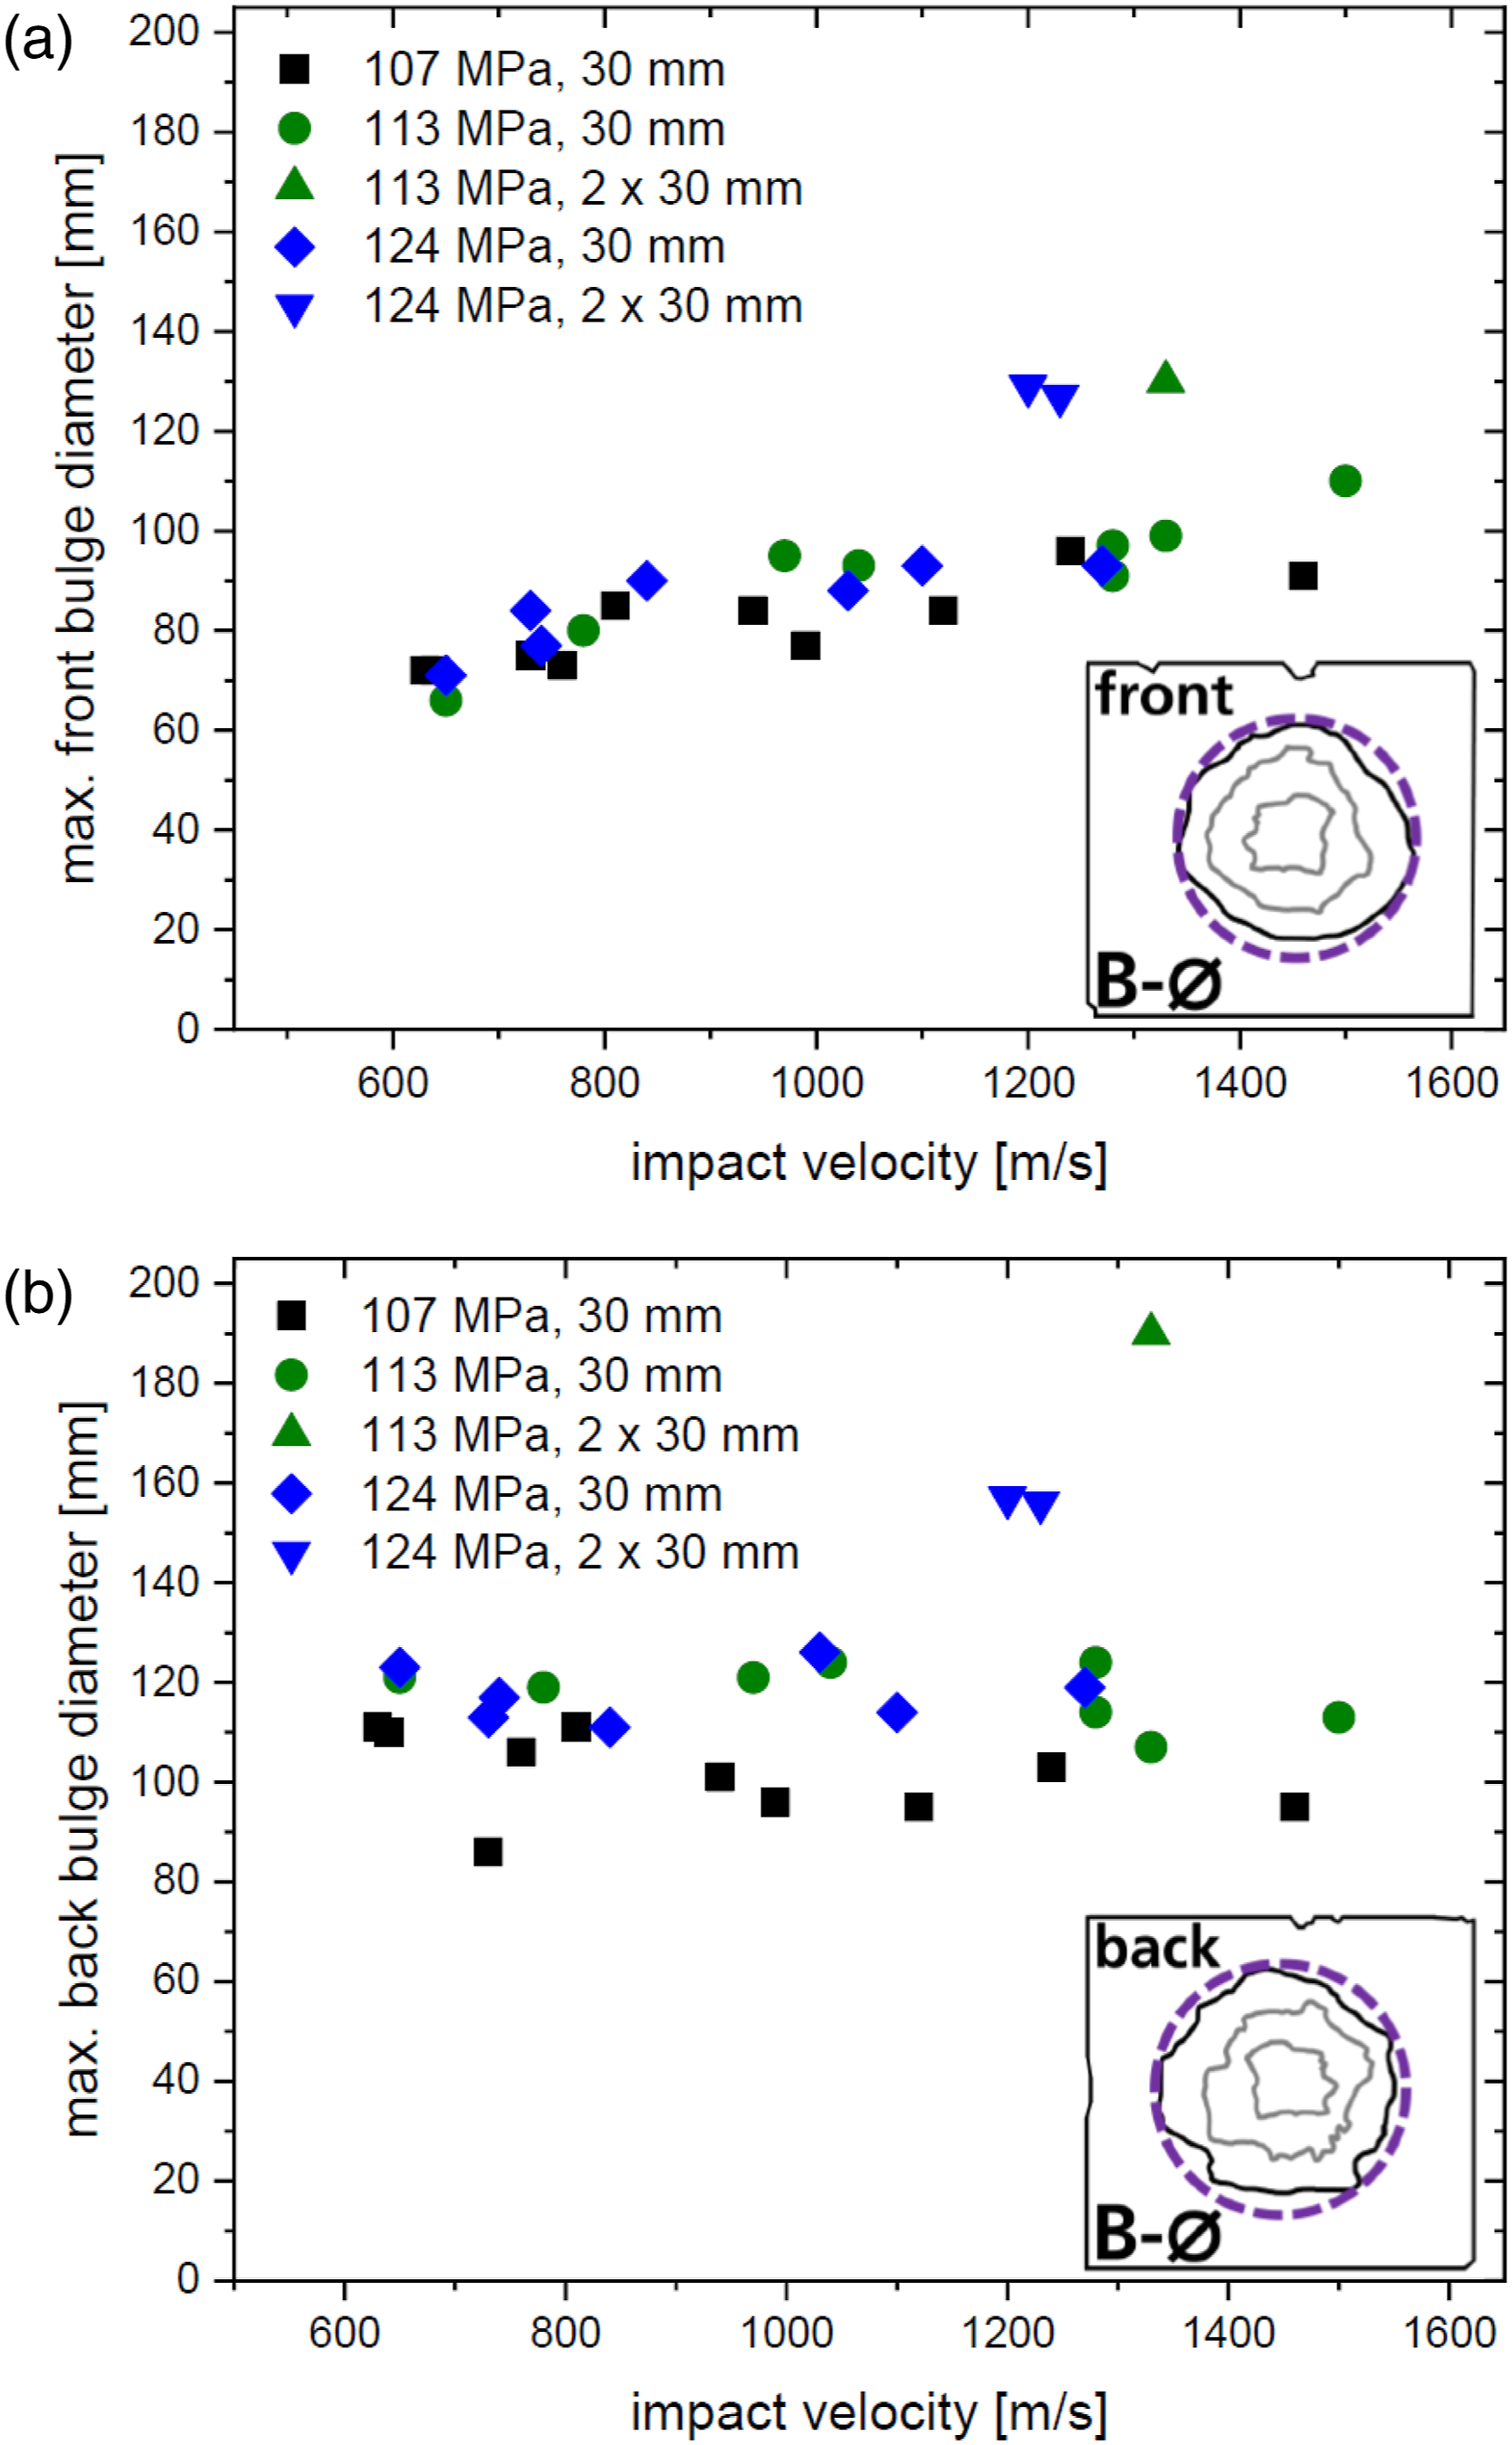
Comprehensive discussion of the results
With a comparison of the findings for all damage quantities presented in this section, a comprehensive discussion of quantitative damage extracted from perforated UHPC targets is possible. No additional focus is put on the differences between the results for the three different lots. This can be justified by the observation that these differences between the values of the damage quantities from the three lots are either small or not significant at all. Hence, in view of the results presented in this section for these damage quantities, data from all three lots can be seen as a unified data set with some moderate experimental scattering that originates from a UHPC target material with a mean compressive cylinder strength of 115 MPa.
In the high-velocity impact tests in this work, target damage is induced by a mix of the direct interaction with the projectile and by stress states created by waves. The waves can produce such stress states either directly or by an overlap of several waves. The main damage expected from waves stems from the creation of stress states with tensile character, since in tension concrete fails at much lower stress levels than in compression. In the following, an overall analysis of the damage quantities presented in this section will be used to discuss possible origins of the observed quantitative damage.
For most damage quantities, the values increase with increasing impact velocity. This means that, for the given projectile, the additional kinetic energy of the impact leads to more damage, which is an expected finding due to a higher magnitude of loading by the projectile and larger amplitudes of shock waves and other compression waves. The two exceptions to this finding are the maximum back crater diameter and the maximum back bulge diameter. A possible explanation for this result can be deduced from the fact that the extent of damage on the rear surface should be significantly influenced by stress states created by overlapping waves. Apparently, some of these waves do not significantly depend on the kinetic energy of the impact.
Another interesting observation is that from the total damage quantities, only for the maximum front crater diameter, values for the 30 mm and the 2 × 30 mm thick targets are similar. For this quantity, a large influence of the kinetic energy of the impact is expected, since the front crater size is strongly influenced by direct interaction with the projectile. A possible explanation for this finding would hence be a dominant influence on the crater size by the Rayleigh wave created at the surface upon impact. Moreover, the stress states created by overlapping waves should be negligible, since those should depend on the thickness of the target due to reflections on the front and back surfaces. In addition, a partial reflection and transmission of waves is expected at the interface between the two plates of the 2 × 30 mm thick targets, since the direct contact of the imperfectly flat surfaces of the plates constitutes a partial discontinuity of the concrete material. Furthermore, the values of all other total damage quantities show an influence from the target thickness. So, in accordance, a possible explanation for that finding would be a significant influence of stress states created by overlapping waves which are influenced by the target setup.
Summary and conclusion
In this work, we presented the results of high-velocity impact experiments with finite UHPC targets in the impact velocity range from approximately 600 to 1500 m/s. The acquired data from these experiments consists of residual velocities of the spherical steel projectiles, qualitative damage information, and several damage quantities. We first provided an overview by discussing the experimental setup in combination with the extracted experimental information. This includes the impact and residual velocities obtained by flash X-ray diagnostics, the qualitative damage information in photographs of the post mortem targets, and the mass loss of the targets from weighing them before and after the impact tests. Additionally, in a second evaluation step, digital 3D post mortem targets, obtained by 3D-scanning, were analyzed and values for several damage quantities were extracted from these digital targets. After this overview of the data acquisition, information on the production and characterization of the UHPC target material was provided. The targets produced for the ballistic tests originate from three different lots with compressive cylinder strength values of 107, 113, and 124 MPa. With these targets, 28 tests were performed with 25 of them using a single 30 mm thick plate as the target and three additional tests employing two such plates. The data directly determined from the ballistic impact experiments was then summarized in a data set consisting of the mass loss and the residual velocities for the realized impact velocities. In a reasonable assumption, these residual velocities were measured within the regime of rigid projectile penetration for the impact velocities without projectile failure.
The first explicit presentation and discussion of the obtained data was the one of these residual velocities as a function of impact velocity. For that, fits of a square root function (Recht–Ipson model (Recht and Ipson, 1963)) were employed and the obtained parameters were given and discussed. Then, we explained the production of the digital 3D post mortem targets with 3D-scanning and the damage visualization on their surfaces. With representative examples for the digital 3D targets, trends for the visible damage, including crater outlines and cracks beyond the craters, were revealed. For all lots, there is a trend of increased visible damage (crater sizes and number of cracks) on the rear side surface with respect to the front. Moreover, larger impact velocities go along with an increase of visible damage on both sides of the targets. Additionally, some apparent increase of visible damage with the growing strength values of the different lots of the target material seems to be observable. This mainly manifests itself in the number of visible cracks. Consequently, there appears to be an increased brittleness with higher compressive strength regarding the formation of cracks.
The discussion of quantitative damage started with an introduction of the damage quantities extracted from digital 3D targets. These are the minimum breakthrough diameter, the maximum crater diameter, and the maximum bulge diameter. The latter two quantities were extracted from the front and the back surfaces, so that two such quantities exist for the cratering and bulging of each target. After that, the mass loss of the target and the damage quantities extracted from digital 3D targets were presented as a function of impact velocity. Each of these damage quantities was discussed with respect to its dependence on the impact velocity, the difference between the values from the 30 mm and the 2 × 30 mm thick targets, and visible differences between the values from targets stemming from the different production lots.
For all quantitative data in this work, small or negligible differences for targets originating from different lots could be observed. Hence, this data can be seen as a unified data set with some moderate experimental scattering that has been extracted from targets that consist of a UHPC material with a mean compressive cylinder strength of 115 MPa. For the total damage quantities, that is, the total mass loss, the minimum breakthrough diameter, the maximum crater diameters, and the maximum bulge diameters, a comprehensive discussion of this unified data set was performed. The comparison of all findings for the individual quantities revealed that only for the maximum back crater diameter and the maximum back bulge diameter, rather constant values were found with increasing impact velocity. For all other quantities, the values increase with increasing impact velocity, as expected. A possible explanation for this result is that some of the waves which should be mainly responsible for the damage on the rear surface did not significantly depend on the kinetic energy of the impact. Another finding from the comparison of the different quantities was that only for the maximum front crater diameter, the values for the 30 mm and the 2 × 30 mm thick targets are similar. A possible explanation for that finding could be a dominance of the Rayleigh wave and simultaneously a negligible influence of reflected waves on the surfaces and interfaces of the targets, since those should have depended on the particular target thickness.
The large comprehensive data set presented in this work should be very valuable for future verification and validation of analytical, empirical, and numerical models that describe the perforation of UHPC. For that, we provided quantitative information for the projectile target interaction with the measured residual velocities as a function of impact velocity. Furthermore, our data set includes qualitative and quantitative damage information, which can be used to assess the predictive capabilities of models that aspire to determine the damage of UHPC structures after projectile or fragment perforation. Such predictive modeling is desired for a variety of applications in the assessment of damage on existing structures or the design of UHPC structures with respect to protective capabilities against projectile or fragment impact.
Footnotes
Acknowledgements
We thank the involved technicians at EMI for the production of B4Q and performing the ballistic impact experiments. Furthermore, we would like to thank Dr. H. Sohn for his kind support.
Declaration of conflicting interests
The author(s) declared no potential conflicts of interest with respect to the research, authorship, and/or publication of this article.
Funding
The author(s) disclosed receipt of the following financial support for the research, authorship, and/or publication of this article: We acknowledge funding by the Federal Office of Bundeswehr Equipment, Information Technology and In-Service Support (BAAINBw) and the Federal Ministry of Defence (BMVg).
Appendix