
Abstract
In this work, we present a comprehensive experimental and numerical study of high-velocity impact with high-performance fiber reinforced concrete (HPFRC) targets and samples. A large data set from projectile impact tests with finite and semi-infinite targets and planar plate impact (PPI) tests is provided. This includes residual velocities, depths of penetration, qualitative and quantitative damage of perforated targets as well as free surface velocity time curves from PPI. Moreover, we derive a hydrocode simulation model for HPFRC from material characterization results, literature sources, and some results of the given impact data set. The good performance of this model is demonstrated by a simultaneous reproduction of the experimental residual projectile velocities, qualitative target damage patterns, and surface velocity time curves. In two additional model applications, damage quantities of perforated targets and depths of penetration from semi-infinite targets are investigated. In these application cases, the experimental data is reproduced by the derived simulation model with reasonable accuracy.
Keywords
Introduction
In most countries worldwide, concrete is the dominant building material. As soon as a building reaches a certain height, conventional concrete will not be able to withstand the static load of the building due to its limited compressive strength. Consequently, high-strength concrete or high-performance concrete (HPC) is currently used in high-rise buildings (Chang et al., 2001; Kwan et al., 2003). Other possible applications of this material include tunnel segments (Ding et al., 2011) and underwater foundations (Kuo and Zhuang, 2021). In order to further increase the performance of an HPC material, fibers are often added, as for example in reference (Ding et al., 2011), leading to a high-performance fiber reinforced concrete (HPFRC). In this work, we refer to HPC when the characteristic compressive cylinder strength lies between approximately 55 and 100 MPa. This use of the term HPC is in accordance with the corresponding European norm (EN 206:2021, 2021; EN 1992-1-1:2011, 2011). If fibers are added to the recipe of such an HPC, we use the term HPFRC. Since the European norm for concrete specification, performance, production, and conformity (EN 206:2021, 2021) includes concrete strength classes up to a compressive cylinder strength of 100 MPa, HPC materials can be used in construction without additional requirements and verifications. Consequently, HPC and HPFRC are widespread in many applications across Europe that benefit from the better performance of these materials.
One of the many benefits of HPC and HPFRC with respect to conventional concrete is a higher resistance to projectile penetration. Hence, a considerable body of work exists on the issue of projectile impact on HPC and HPFRC (Almusallam et al., 2013; Antoniou et al., 2023; Børvik et al., 2002, 2007; Dancygier et al., 2007, 2014; Dancygier and Yankelevsky, 1996; Feng et al., 2019; Forrestal et al., 1996; Frew et al., 1998; Jacobsen et al., 2023; Kim et al., 2021; Kristoffersen et al., 2021; Liu et al., 2017, 2018a, 2018b, 2021a, 2021b, 2022; Luo et al., 2000; Ren et al., 2016, 2017; Riedel et al., 2011; Shirai et al., 1997; Sovjak et al., 2015; Thoma et al., 2012; Wan et al., 2021; Wang et al., 2016; Zhang et al., 2005, 2020a, 2020b; Zhong et al., 2021; Özalp et al., 2022). These references include pure experimental investigations (Almusallam et al., 2013; Børvik et al., 2002, 2007; Dancygier et al., 2007, 2014; Dancygier and Yankelevsky, 1996; Feng et al., 2019; Forrestal et al., 1996; Frew et al., 1998; Jacobsen et al., 2023; Kim et al., 2021; Luo et al., 2000; Thoma et al., 2012; Zhang et al., 2005, 2020a, 2020b; Zhong et al., 2021; Özalp et al., 2022), numerical simulations of impact scenarios (Antoniou et al., 2023; Liu et al., 2018a, 2022; Ren et al., 2016, 2017; Riedel et al., 2011), and combined experimental and numerical studies (Kristoffersen et al., 2021; Liu et al., 2017, 2018b, 2021a, 2021b; Shirai et al., 1997; Sovjak et al., 2015; Wan et al., 2021; Wang et al., 2016). Often, the results on HPC and HPFRC are compared to corresponding ones of other concretes with smaller or larger compressive strengths in these references. Additional information on the impact resistance of concrete and fiber reinforced concrete exhibiting a large range of compressive strengths is available in reference (Esaker et al., 2023). Studies of localized blast loading, like close-in and contact detonations, are closely related to this work since those loading scenarios exhibit a similar range of pressures (several GPa) and strain rates (up to 105 1/s). Examples for such related investigations of HPC and HPFRC are detonation experiments with panels (Yao et al., 2020) and columns (Roller et al., 2013), or a combination of experimental and numerical detonation loading studies (Mourão et al., 2021; Wan et al., 2021). All these works aim at gaining information for the assessment of vulnerabilities of particular building structures, the development of protective structures or the design of resilient buildings. This can either be achieved by experimental tests of particularly interesting scenarios or the development of simulation models with a validation that uses those cases. With a properly validated simulation model, threat scenarios like localized detonation loading and the impact of projectiles or detonation fragments can be predicted, which provides the desired information.
With this work, we want to extend the already existing literature on the impact response of HPFRC with a comprehensively combined experimental and numerical study of a relevant material for applications in concrete practice. The investigated HPFRC exhibits compressive cylinder strengths of approximately 70 to 100 MPa and contains coarse aggregates with a maximum grain size of 16 mm and 1.0 volume percent of steel fibers. For this material, we provide a large data set consisting of residual projectile velocities, depths of penetration, qualitative and quantitative target damage, as well as free surface velocity time curves from planar plate impact (PPI) experiments. The impact velocity range of the projectile impact tests ranges from approximately 500 to 1500 m/s while PPI tests were conducted in the range of approximately 250 to 1400 m/s. Corresponding numerical simulations reproduce the obtained experimental data with reasonable accuracy. Hence, we further provide a hydrocode simulation model, i.e. a parameter set for the chosen RHT concrete model (Grunwald et al., 2017; Riedel, 2009; Riedel et al., 2009), which should exhibit predictive capabilities in a loading range similar to the comparatively large one investigated in this work. For example, the impact of the used spherical projectile in the realized impact velocity range is quite similar to the threat scenario of detonation fragments (Del Linz et al., 2021), while the very high pressures reached in PPI are similar to the ones of localized blast loading. The essential novelty of this article lies in the fact that a practically applicable HPFRC will be characterized over an extremely wide range and will not be limited to a single application case. Consequently, other researchers can either use the provided data set to validate their models or apply the presented simulation model to such applications of high-velocity impact and localized blast loading of HPFRC.
In the following, we first provide the basic aspects for the conducted experiments and simulations. This includes information on the production process and material characterization. Moreover, a description of the setups of the conducted experiments and corresponding simulations is given before the origin of the RHT-model parameters is explained. The utilized process of the parameter derivation for the simulation model used for HPFRC follows the procedure in reference (Sauer et al., 2024a). After that, the experimental impact data which was included in the parameter derivation process is presented. In parallel, the performance of the derived parameter set is presented by the depiction of the reproduction of this data. It consists of residual projectile velocities, qualitative target damage, and free surface velocity time curves from PPI experiments. The comparison of qualitative target damage is based on experimentally determined and simulated damage patterns that include craters and cracks. Subsequently, the simulation model is applied to a study of quantitative target damage. The experimental damage quantities were extracted from digital 3D targets obtained by 3D-scans of the perforated targets, as in reference (Sauer et al., 2024b). For the corresponding simulated targets, the methodology in reference (Sauer et al., 2024a) was used to obtain the simulated damage quantities. In a second application of the numerical model, measured and simulated depths of penetration are discussed. Finally, we present a summary of and a conclusion from the presented studies.
Basic aspects for conducted experiments and simulations
In this section, we first present the production and material characterization of the investigated HPFRC. After that, the setups of the performed impact experiments and simulations are introduced. Then, the origin of the RHT-model parameters is explained. A comparison of data from the impact experiments and the corresponding simulation results obtained with the derived parameter set is provided in the next section.
Production and characterization of HPFRC
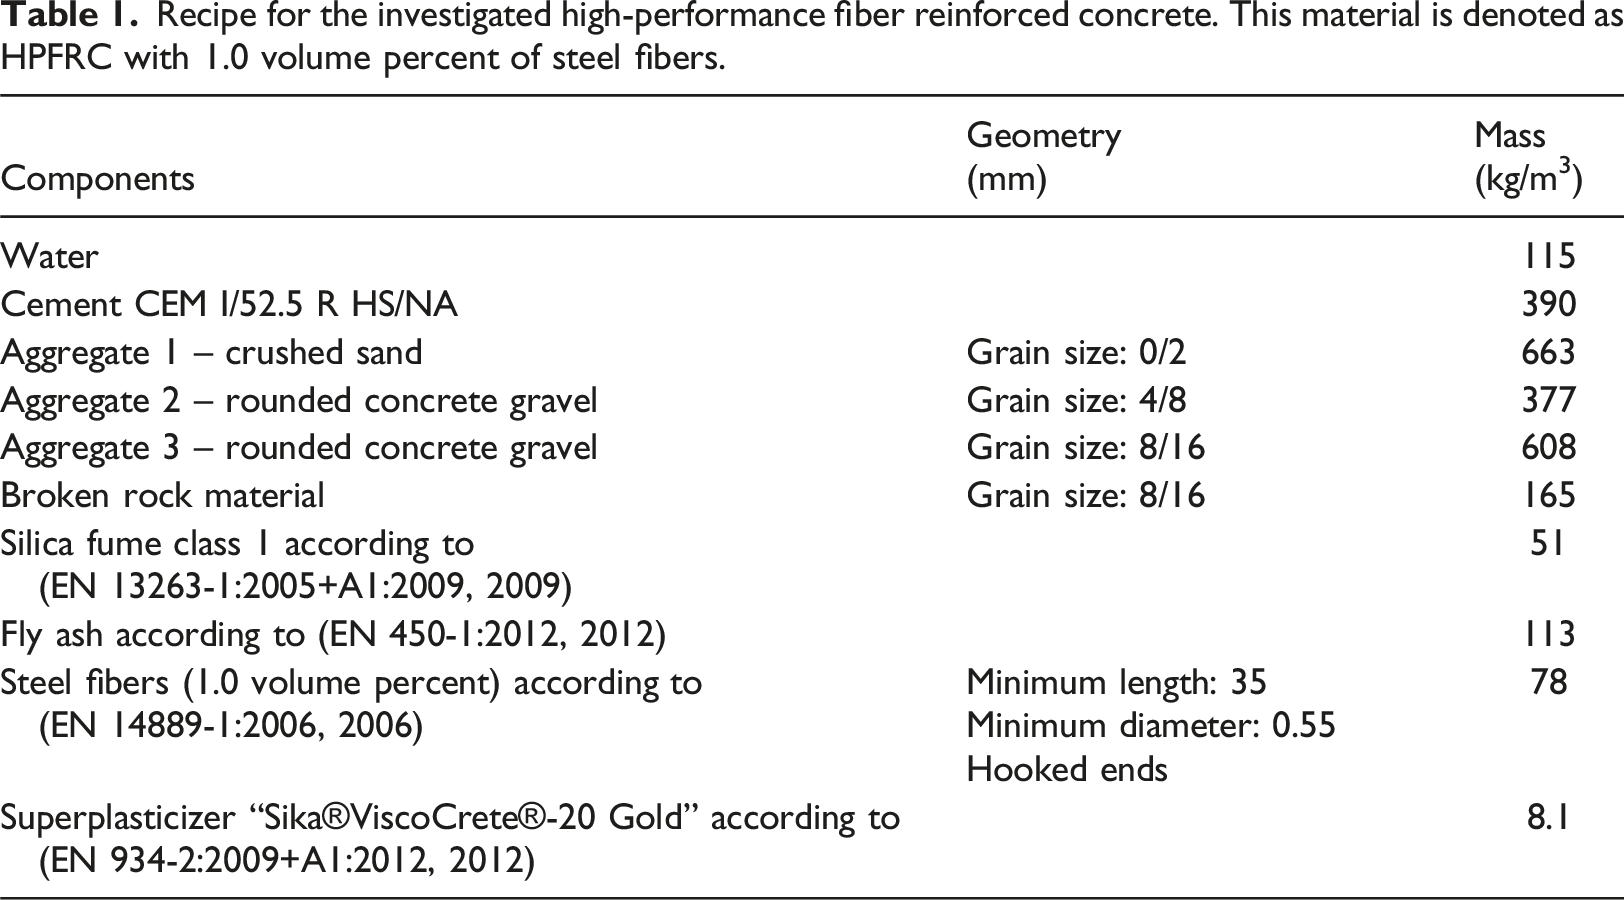
Recipe for the investigated high-performance fiber reinforced concrete. This material is denoted as HPFRC with 1.0 volume percent of steel fibers.
So-called “dry storage” was carried out for all samples according to national regulations in Appendix NA of DIN EN 12390-2 (2019). The standard specifies the making and curing of concrete specimen for strength tests. The standard-compliant process was applied: storing of the test specimen after production for 24 (±2) hours at 20 (±2) °C with protection from drying out, removing the specimen from the mold after 24 (±2) hours, leaving the removed specimen for 6 days at 20 (±2) °C on racks in a water bath, removing the specimen from the water bath and placing them at 20 (±2) °C and 65 (±5) % relative humidity on a slatted frame for further protection against drying out.
With the recipe given in Table 1, three different lots were produced which are characterized by the determined compressive cylinder strength fc in the following. For the later derivation of the material model, all other material properties are assumed to be equal for the different lots. This assumption is justified in this case, as the formulation in the RHT model is normalized to the uniaxial compressive strength f’c. Additionally, the difference in compressive strength between the different lots is within a moderate range. A lot with fc = 68 MPa was used to cast plates with the dimensions of 260 mm × 240 mm × 30 mm (width × height × thickness). These plates were utilized as finite targets in projectile impact tests. A second lot with fc = 84 MPa was used for the production of the PPI plates, the cylinders for the split tensile tests, and the samples for the modified Hopkinson Bar tests. Additionally, blocks of dimensions of 260 mm × 240 mm × 150 mm were cast from a lot with fc = 101 MPa. These blocks were used as semi-infinite targets in projectile impact tests. In all cases, the determination of the compressive strength was conducted in close temporal proximity to the particular test series.
In accordance with (EN 12390-3:2019, 2019), the compressive tests on cylindrical specimens (diameter of 150 mm and height of 300 mm) were carried out in a servo-hydraulic machine for the determination of the given unconfined compressive strengths fc under quasi-static loading (strain rate about 10−6 s−1). The experiments are characterized through the following boundary conditions: a loading velocity of 0.4 MPa/s, a ratio of length to diameter of the specimens l/d = 2.0, plane-parallel upper and the lower surfaces, and a load application with force control. In three tests, the average compressive strength was determined and the characteristic compressive strength fc was derived.
For the tensile tests, the specimen size was the same as for the compressive strength tests. Due to a strong influence by heterogeneity on tensile strength properties of brittle materials, the pores and disturbances in concrete have a significant influence on the determination of the tensile strength. Consequently, standards recommend the accomplishment of indirect testing methods, i.e. splitting tests or bend tests (EN 12390-6:2009, 2009). From the conducted splitting tensile tests in this work, the direct (centric) tensile strength was determined with the help of empirical relations (EN 12390-6:2009, 2009).
The characterization of concrete materials under high and highest strain rates is of special interest, since for strain rates above 1 s−1, a significant increase for the tensile strength is observed for such materials. For the characterization in the dynamic regime, the accomplishment of modified Hopkinson Bar tests is a recommended and accepted method (Schuler and Hansson, 2006) and hence was used within this study. The applied spall configuration consists of an incident bar and an acceleration facility, accelerating a striker which impacts the incident bar. The acceleration was reached through a sudden release of compressed gas. The cylindrical specimen (diameter of 75 mm and height of 250 mm) was fixed at the end of the incident bar. For that, high adhesive glue was used in the tests to determine the tensile strength and the longitudinal sound speed, since an optimal wave transmission is required.
With these material characterization tests, the following results have been obtained. As already mentioned above, the compressive cylinder strengths of fc = 68, 84, and 101 MPa were determined in compressive tests. By weighing the same cylindrical samples, a mean porous density of 2.46 g/cm3 was determined. From the split tensile tests, which were carried out with samples from the lot having a cylinder compressive strength of 84 MPa, a mean value for the split tensile strength of fsp = 8.1 MPa was obtained. With that, the tensile strength is calculated as ft = 0.8 fsp, leading to a value for the tensile strength of ft = 6.45 MPa. Moreover, by averaging the results from all valid SHB tests, a longitudinal sound speed of cL = 4120 m/s and a dynamic increase factor (DIF) of the tensile strength of DIF = 2.0 at an average strain rate of 60 1/s were determined. These results from quasi-static and low rate material characterization are later utilized to determine several RHT-model parameters.
Setup of impact experiments and numerical simulations
In this work, impact experiments are presented in combination with corresponding simulations. These impact experiments include projectile impact tests with finite HPFRC targets and PPI tests with HPFRC sample plates. An overview of the setups of these experiments and simulations is depicted in Figure 1. The setup of the projectile impact experiments is the same as in reference (Sauer et al., 2024b), while the corresponding simulation setup is equal to the one in reference (Sauer et al., 2024a). For the PPI experiments and simulations, similar setups as in reference (Sauer et al., 2022) were employed for which further details are available in reference (Sauer et al., 2018). In the following, the setups in Figure 1 are briefly discussed. For additional details, we would like to refer the reader to references (Sauer et al., 2018, 2022, 2024a, 2024b). Depiction of the setups of projectile impact experiment and simulation (left) together with the planar plate impact (PPI) experiment and simulation (right). For projectile impact, the residual velocity vresidual and the damage pattern are determined for a direct comparison. In the case of PPI, the obtained free surface velocity time curves are compared.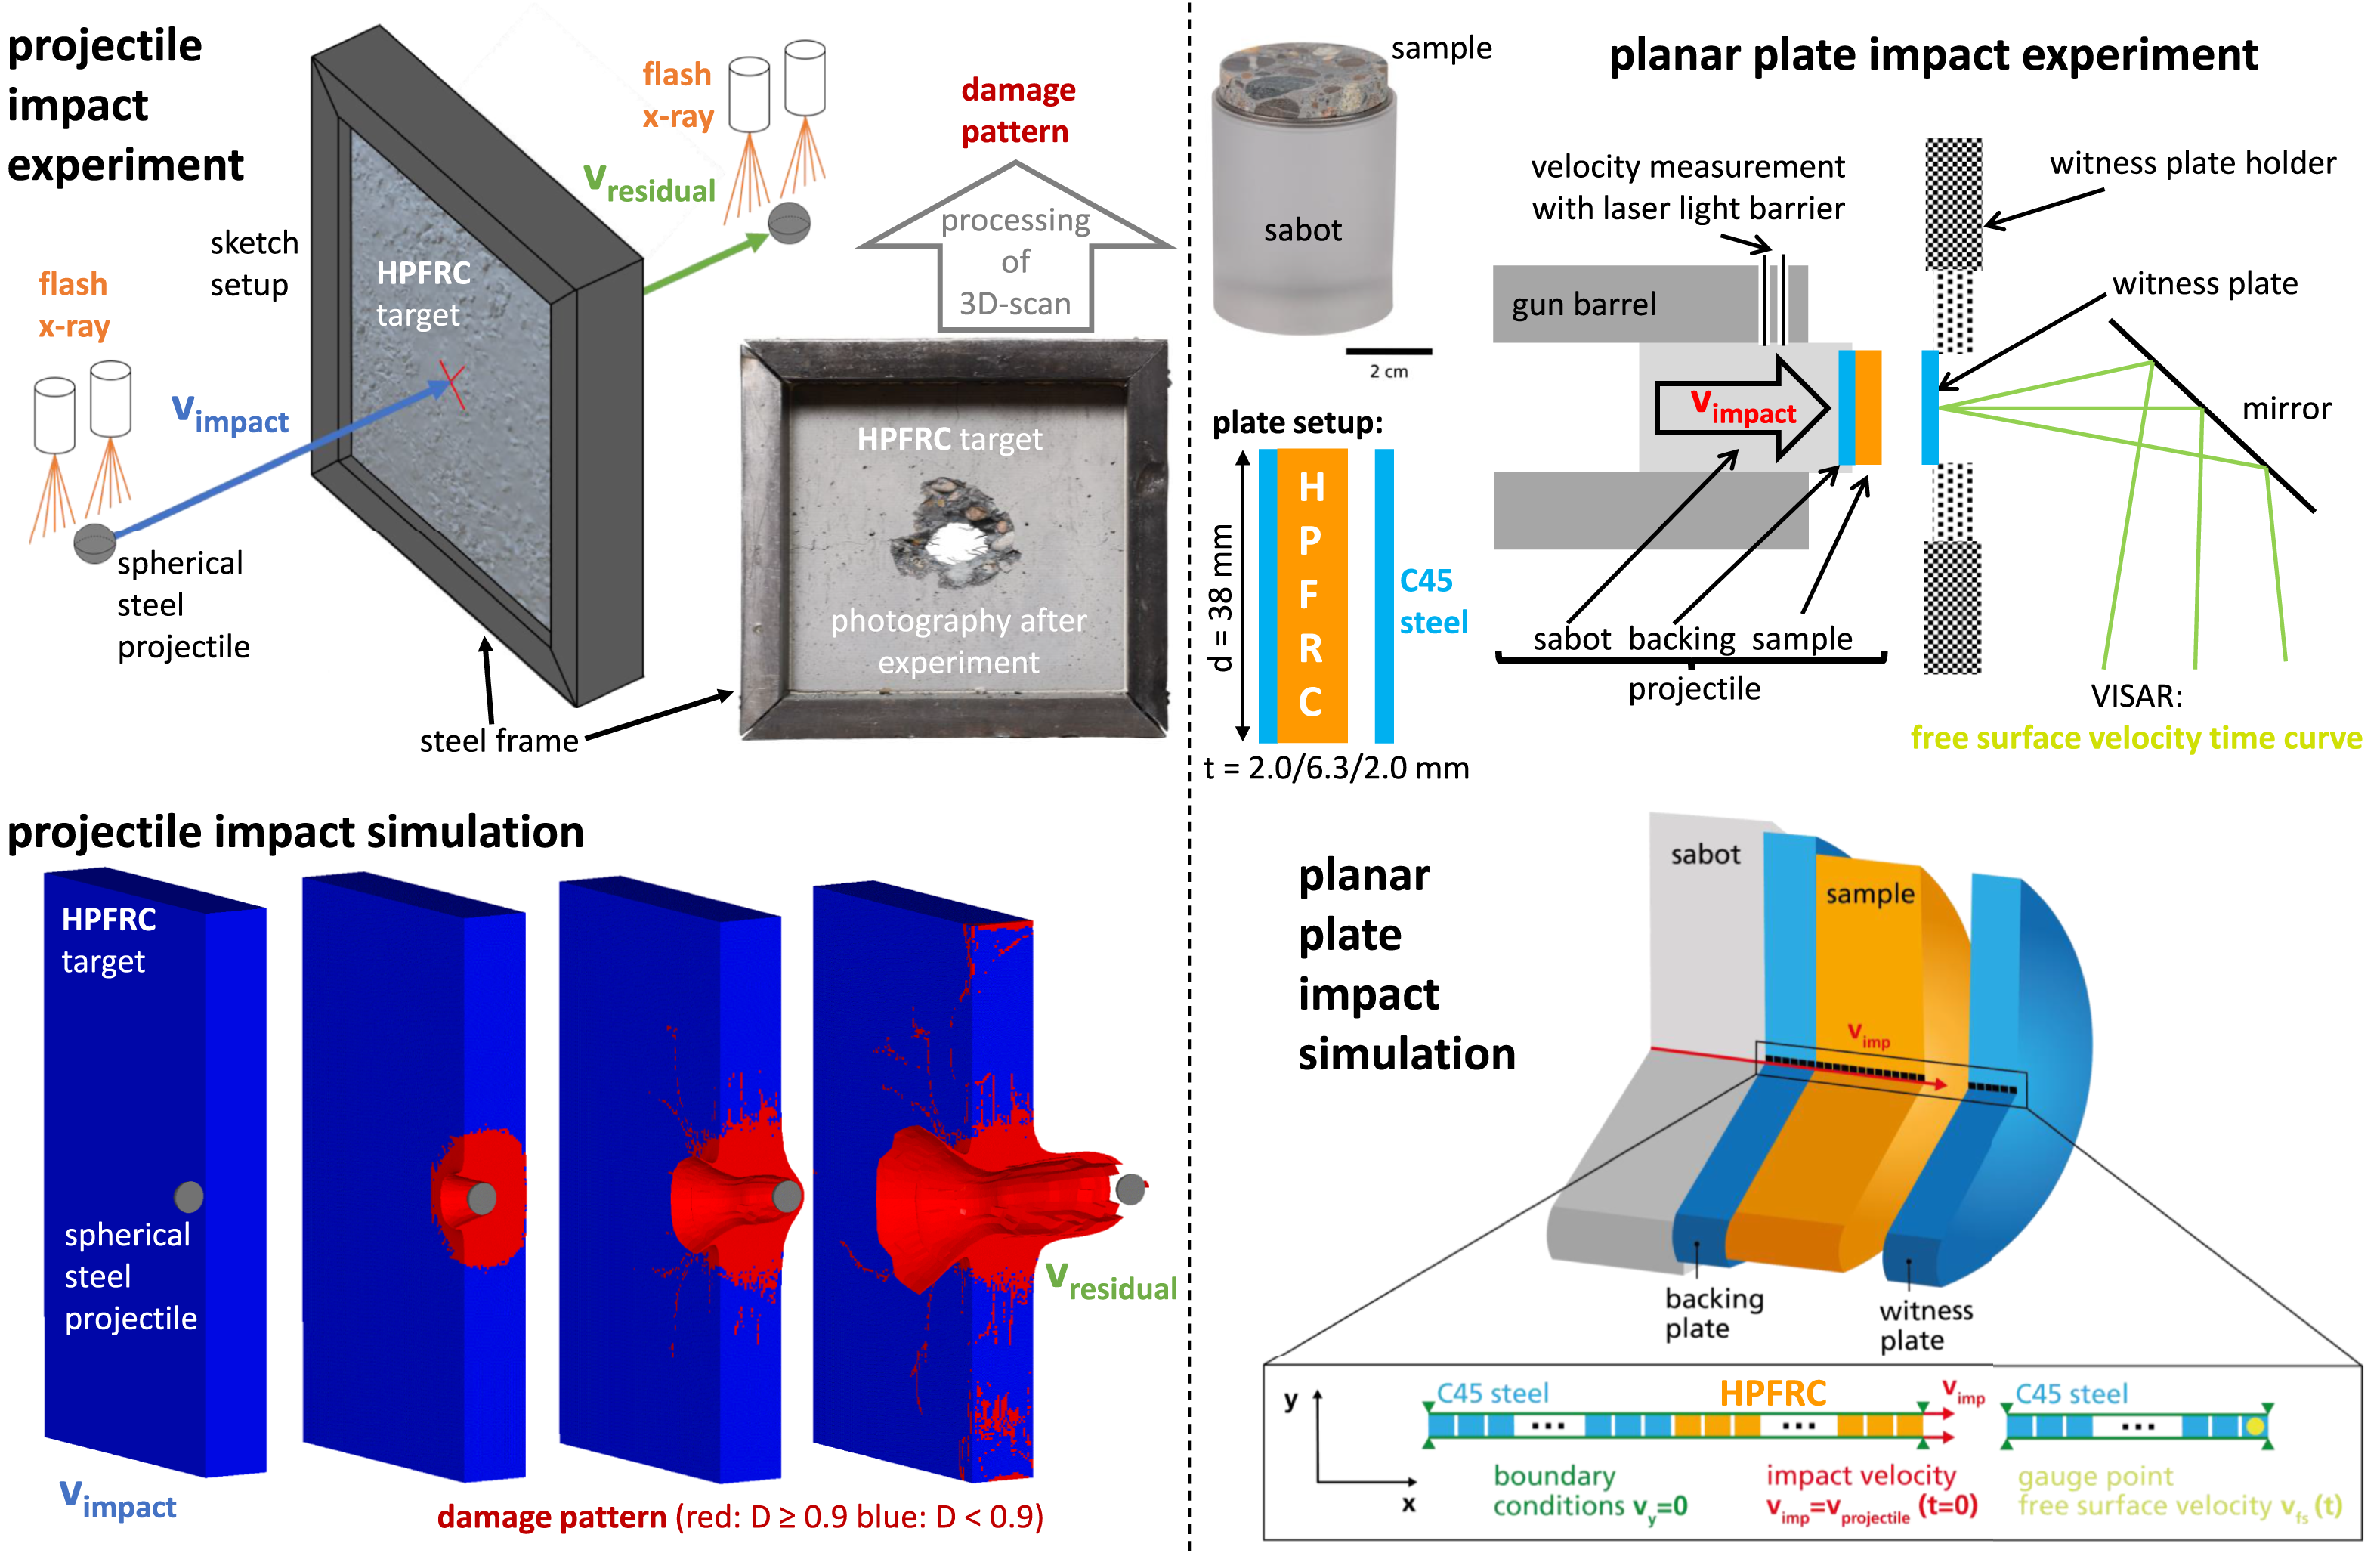
In the test series of the ballistic impact of spherical steel projectiles on HPFRC targets, a projectile with a diameter of 13.5 mm and a mass of 10 g was used. The sphere was chosen because this projectile is as generic as possible. This allows us to focus on the behavior of the target material. Therefore, it was also important to use a steel that experiences minimal deformation during impact. Due to this requirement, a very hard bearing steel with a hardness value of 820HV20 was used, which leads to very small plastic deformations of the projectile at impact velocities above 1000 m/s. Fragmentation occurs at the highest impact velocity realized in this work. An additional advantage of the sphere is that it cannot exhibit an impact angle in the experiment. Further information on the behavior of this projectile is provided in reference (Sauer et al., 2024b). The targets of these tests consisted of HPFRC plates of the above given dimensions with eight tests being conducted with a single plate and one test with a double plate target, in which the two plates were in direct contact to one another. As shown in the upper left of Figure 1, these plates are confined in a matching steel frame. In each test, both the impact and the residual velocity were measured with doubly exposed flash X-ray pictures with known delay times between the flashes. After the experiments, the perforated targets were digitized with 3D-scanning and the resulting digital 3D-targets were further processed to display crater outlines and cracks on their surfaces. Details on this procedure are given in reference (Sauer et al., 2024b).
In the upper right of Figure 1, the setup of the PPI experiments is displayed. In the performed indirect PPI tests, a sample plate attached to a backing plate of C45 steel impacts a witness plate of C45 steel. All plates exhibited a diameter of d = 38 mm. The thickness of the witness and the backing plate was t = 2.0 mm, while the sample plate had a thickness of t = 6.3 mm. As depicted in the upper left of the PPI setup, the backing and the sample plate were mounted onto a sabot, which was accelerated in a laboratory gun. In each test, the impact velocity of the projectile was measured with a laser light barrier. During the experiment, the free surface velocity was measured in a spot of approximately 0.5 mm diameter in the center of the rear surface of the witness plate with a VISAR interferometer (Barker and Hollenbach, 1972; Barker and Schuler, 1974; Hemsing, 1979).
In the bottom left and right of Figure 1, the setups of the hydrocode simulations are illustrated. In such a hydrocode simulation, a set of partial differential equations is solved numerically (Zukas, 2004). For all materials, general equations are derived from the conservation relations of mass, momentum, and energy. In addition, each material is described with a specific constitutive model and equation of state (EOS). The EOS describes the relation between hydrostatic pressure, density, and internal energy, while the constitutive model relates deviatoric stresses and strains. For all hydrocode simulations in this work, the commercial hydrocode ANSYS Autodyn (Version 19.1) was utilized (AUTODYN, 2005). In this software, we used structured Lagrangian meshes for all projectiles and targets. Moreover, all HPFRC targets and samples were described with the RHT concrete model (Grunwald et al., 2017; Riedel 2009; Riedel et al., 2009), which is implemented in the ANSYS Autodyn software. This material model has been successfully used for the description of highly dynamic loading of concrete (Grunwald et al., 2017; Riedel 2009). Details on this model are given in the original journal publication (Riedel et al., 2009), a recent summary (Sauer et al., 2017a), and a presentation of its implementation in the software LS-DYNA (Grunwald et al., 2017).
The setup of the projectile impact simulations is presented in the bottom left of Figure 1 with snap shots of an exemplary hydrocode simulation. All dimensions were retained from the corresponding experiments. However, the lateral surfaces of the target were not constrained by any boundary conditions. This means that in these simulations, the confinement of the steel frame was not taken into account. The application of rigid boundary conditions to the lateral surfaces of the targets has no significant influence on the simulated residual velocities but would hinder the experimentally observed extent of cracks to the edges of the targets. For these targets, a homogenous mesh consisting of cubes with an edge length of 1.0 mm was utilized, and the mesh resolution of the spherical projectile was adopted to this size. To confirm this mesh resolution, a sensitivity study was conducted. In reference (Sauer et al., 2017a), details on the material model for this projectile are discussed and the parameters for the applied Johnson-Cook strength model (Johnson and Cook, 1983) are given. This numerical model properly describes the small plastic deformation observed in high-velocity impact experiments with this projectile impacting a variety of different building materials (Sauer et al., 2017a, 2019, 2020, 2024a). In these references and in this work, only cases without projectile failure were considered. Hence, failure modelling was not included in the numerical model for the projectile. Furthermore, the measured impact velocities of the experimental series were applied as initial conditions for the projectiles in the different simulations. Results from the simulations were extracted for comparisons to corresponding experimental values when no further significant change with time was observed. For the mean velocity of the projectile and the damage pattern, this extraction time is usually different, since the latter still evolves after full perforation by the projectile is achieved. The obtained damage pattern is displayed in a two-color code, like in the snap shots displayed in the bottom left of Figure 1. The red color is chosen for cells with an RHT-model damage variable (Riedel, 2009; Riedel et al., 2009) of D ≥ 0.9 and the blue color for those with D < 0.9.
The setup for the PPI simulations is presented in the bottom right of Figure 1. Since during a PPI test with the chosen setup, the assumption of a one-dimensional strain state constitutes a good approximation, the simulation can be effectively reduced to one dimension. Explicitly, this means that the setup of the plates consisted of chains of two-dimensional square elements with an edge length of 0.01 mm. Additionally, the axial symmetric, two-dimensional simulation was effectively reduced to one dimension with boundary conditions that prohibit motion in the y-direction. From the geometry of the plates in the PPI tests, the thickness was retained as the length of the chains in x-direction. In this setup, only motion in x-direction takes place, so that the simulated process consists of perfectly one-dimensional strain states. In this simulation, the free surface velocity was recorded as a function of time in a gauge point placed in the rear cell of the chain that represents the witness plate. For the C45 steel, the material model is described in reference (Sauer et al., 2022). In order to account for a possible difference in the Hugoniot elastic limit of the particular lot of steel, the corresponding signal in the PPI curves was checked. In this work, a good reproduction of the elastic pre-cursor in the curves was achieved with a value of 720 MPa for the yield stress of C45 steel. Hence, for C45 steel, the parameter set in reference (Sauer et al., 2022) updated with this value was used.
With the setups given in Figure 1, several corresponding results were obtained from experiments and simulations to be directly compared in the parameter derivation process. In the case of PPI, the compared results were the free surface velocity time curves. For those, the measured and simulated pairs with the same impact velocity were plotted together and the characteristic features in these curves were directly compared. For projectile impact experiments and simulations, the series of obtained residual velocities and damage patterns were directly compared. For the former, this comparison is trivial, while an adequate direct comparison of the damage patterns required appropriate choices for the presentation of the results. As described above, the simulated damage pattern was reduced to a two-color code. In this presentation, the red-colored pattern of damaged cells with D ≥ 0.9 is interpreted as visible damage. Accordingly, the damage pattern of craters and cracks on the surfaces of the experimentally obtained digital 3D-target was colored in red and the undamaged part of the surfaces in blue. A presentation of the steps toward this direct comparison of damage patterns is provided in reference (Sauer et al., 2024a). This type of presentation of the simulated and experimental post mortem targets allows an unambiguous and direct comparison of qualitative damage.
Origin of RHT-model parameters
Material parameter set used for HPFRC in Autodyn implementation (Riedel et al., 2009; AUTODYN, 2005). For information on the RHT-model in LS-DYNA implementation, see reference (Grunwald et al., 2017).
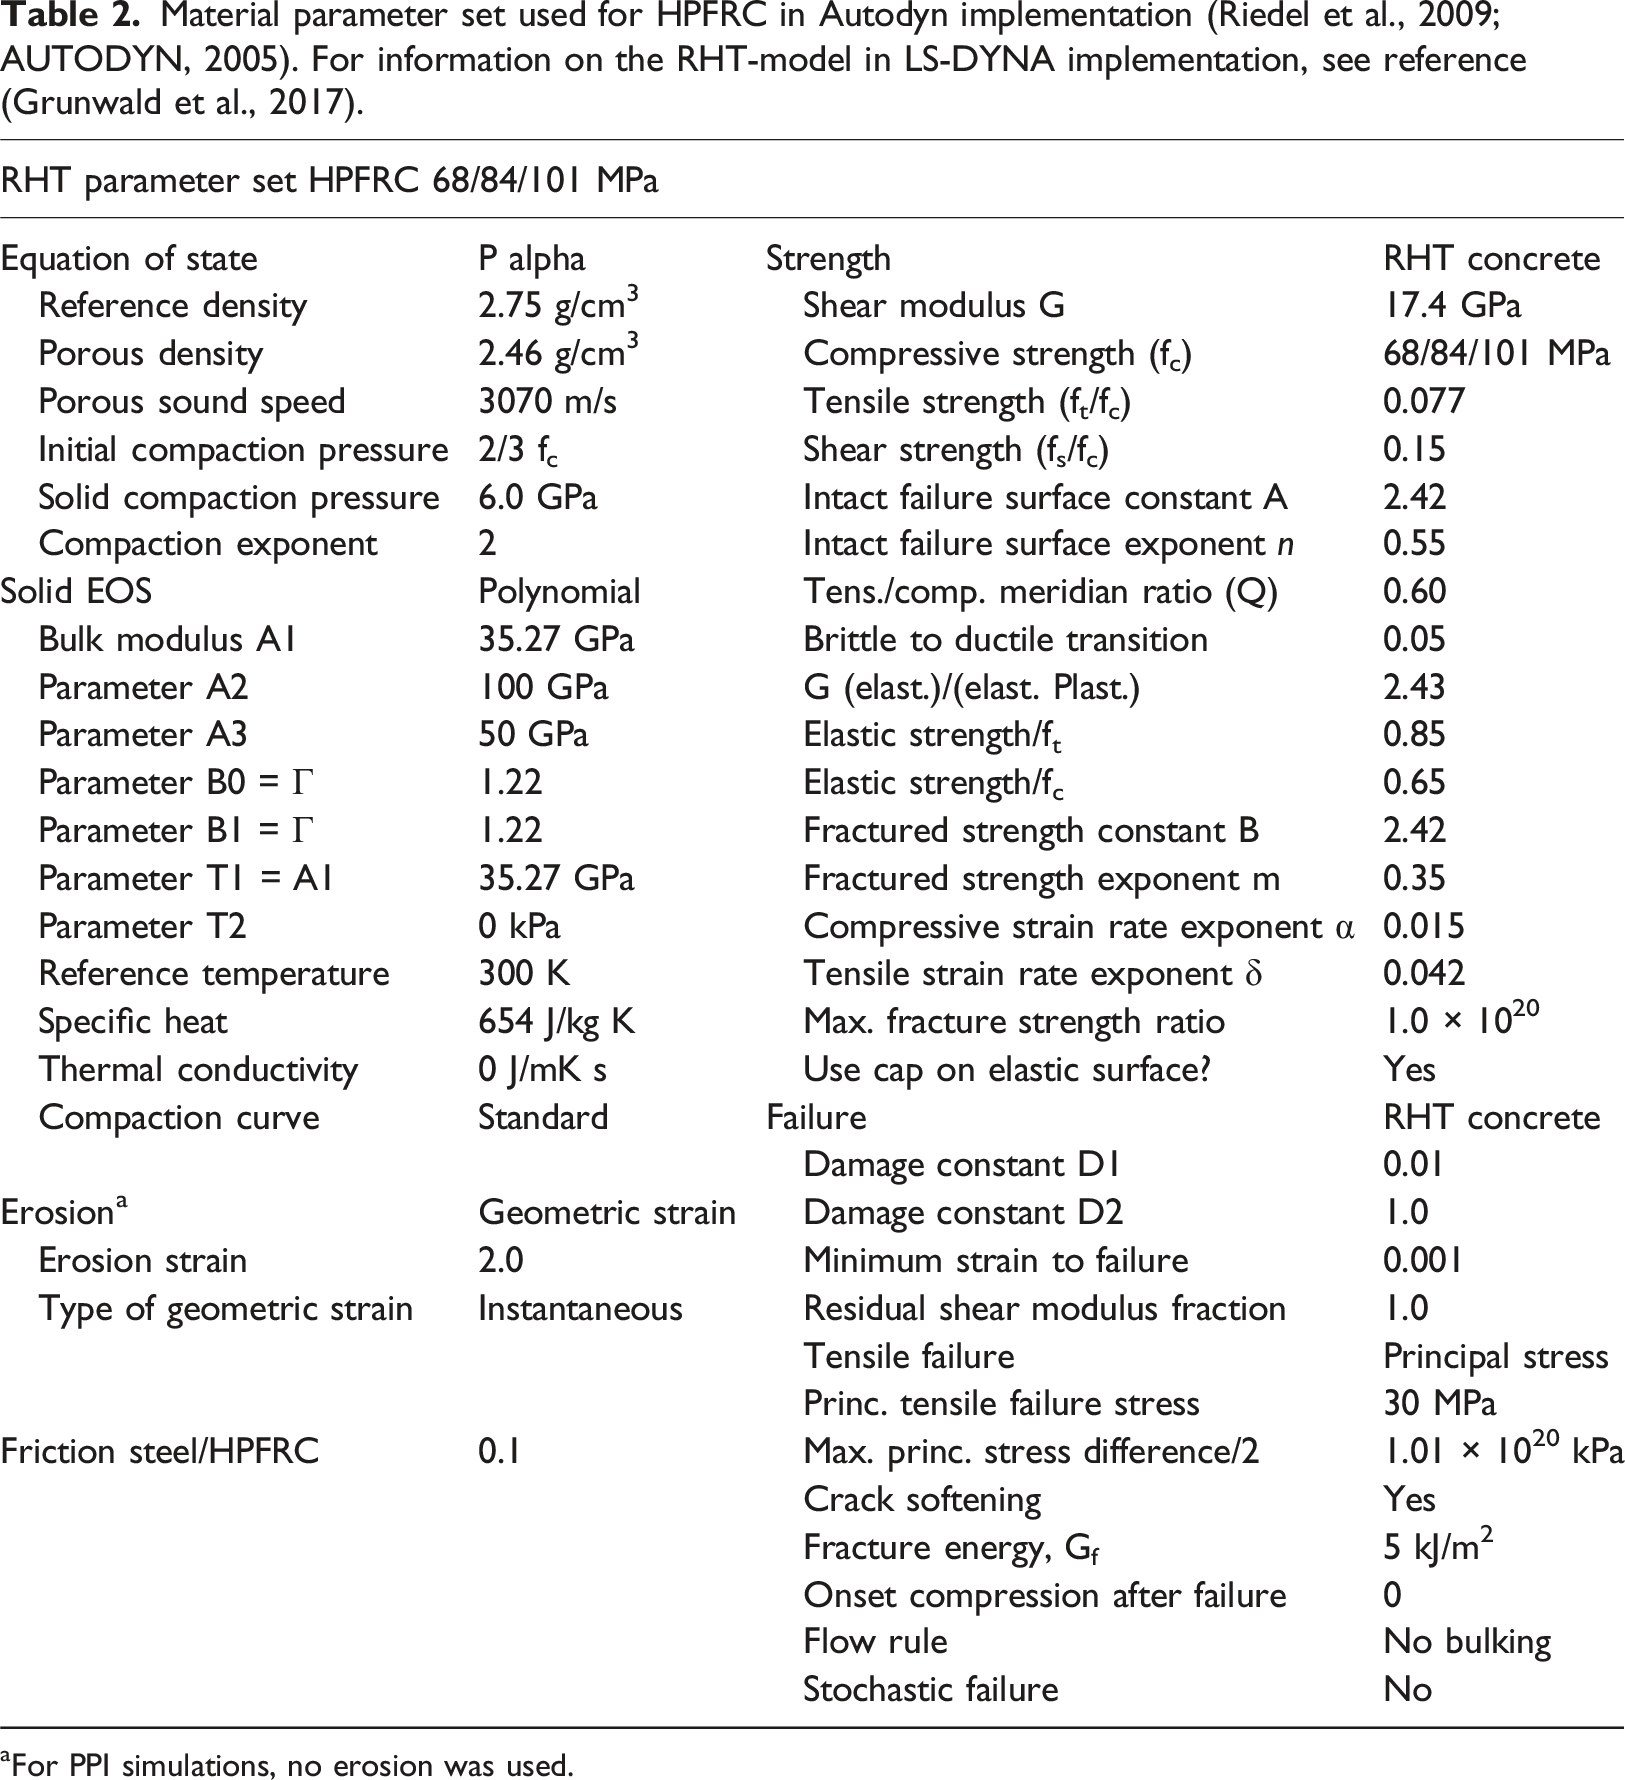
aFor PPI simulations, no erosion was used.
From the cylindrical samples of the material characterization, a porous density of 2.46 g/cm3 was determined that is used for the corresponding parameter in Table 2. Moreover, the compressive strength fc was measured in cylinder compression tests. With the particular value for fc, the initial compaction pressure is calculated with 2/3 fc, which is the usual assumption in the framework of the RHT model (Grunwald et al., 2017; Riedel, 2009; Riedel et al., 2009). Similarly, the compressive strain rate exponent α is calculated with the formula of the RHT framework (Grunwald et al., 2017; Riedel, 2009; Riedel et al., 2009) using the value of fc = 84 MPa. The tensile strength ratio ft/fc is calculated with ft = 6.45 MPa and fc = 84 MPa resulting in ft/fc = 0.077. With this value and considering the ratio of tensile and shear strength of normal concrete, the shear strength ratio fs/fc is estimated to be 0.15. Additionally, using the measured longitudinal sound speed cL = 4120 m/s and a Poisson’s ratio of ν = 0.20, the porous sound speed in Table 2 is calculated. Similarly, the shear modulus G is calculated with the values of cL and ν. For the determination of the tensile strain rate exponent δ, the formula for the DIF in tension of the RHT framework in references (Grunwald et al., 2017; Riedel, 2009; Riedel et al., 2009; Sauer et al., 2017a) is used. With the derived mean values from the SHB tests of DIF = 2.0 at a strain rate of 60 1/s, the value of δ given in Table 2 is obtained.
Since the parameter set for HPC in reference (Riedel et al., 2011) constitutes a starting point for the simulations of this work, some parameters of this parameter set are retained for the one of HPFRC in Table 2. These parameters are the normalized elastic strengths (tension and compression), the fracture energy Gf, and the damage constant D2. For the intact failure surface constant A, the intact failure surface exponent n, the tensile/compressive meridian ratio Q, the parameter for the brittle to ductile transition, and the parameter G (elast.)/(elast. plast.), the parameter values of reference (Grunwald et al., 2017) are chosen. Applying those parameters for the description of the failure surface is motivated by the good performance of the parameter set for a variety of different loading cases in reference (Grunwald et al., 2017). Most importantly, the intact failure surface parameters from reference (Grunwald et al., 2017) were determined by a fit to triaxial compression (TXC) data given in references (Dahl, 1992; Riedel et al., 2009; Sauer et al., 2024a; Speck and Curbach, 2010) and are hence based on experimental results in the pressure range up to approximately 500 MPa. Moreover, from the EOS study in reference (Sauer et al., 2022), several EOS parameters are retained. These are the reference density, the solid compaction pressure, the bulk modulus A1, as well as the parameters T1, B0, and B1. Additionally, the residual shear modulus fraction is also retained from reference (Sauer et al., 2022).
As for ultra-high-performance concrete in reference (Sauer et al., 2024a), several key parameters for HPFRC originate from parameter studies that use a comparison to data from impact experiments for an assessment of the performance of the parameter set. This type of derivation process is only used when the necessary experimental information for obtaining the particular parameters is not available. Parameters determined from such parameter studies are the fractured strength constant B, the fractured strength exponent m, the damage constant D1, the minimum strain to failure, the principle tensile failure stress, the compaction exponent N, and the solid EOS parameters A2 and A3. The parameter studies are an iterative process that uses the reproduction of the experimentally determined residual velocities, the damage patterns, and the free surface velocity time curves in simulations corresponding to the particular experiments to find parameters that lead to a good agreement. The final parameter set is reached when it simultaneously reproduces all of these criteria with a reasonable accuracy.
Obtaining fractured failure surface parameters from a comparison to ballistic data is justified by the systematic gap of experimental information on the intact failure surface above 500 MPa and the fractured failure surface in general. For the projectile target interaction in this work, a relevant pressure range of 1000 to 4000 MPa can be estimated from the simulations, which is very similar to the range found in reference (Sauer et al., 2024a). Applying the methodology of reference (Sauer et al., 2024a), the intact failure surface constant A = 2.42 and the intact failure surface exponent n = 0.55 (Grunwald et al., 2017), derived from TXC experiments below 500 MPa (Dahl, 1992; Riedel et al., 2009; Sauer et al., 2024a), are assumed to be appropriate in the given relevant pressure range. The fractured strength constant B = 2.42 and the fractured strength exponent m = 0.35, however, originate from the conducted parameter studies. In the end, the combination of these parameters determines the performance of the parameter set with respect to all aspects that depend on a proper failure surface treatment. Considering the mentioned lack of data, the extrapolation of the intact failure surface from pressures below 500 MPa to the relevant range of 1000 to 4000 MPa and adjusting the fractured failure surface to obtain measured results over the entire pressure range appears to be a reasonable compromise. Allowing the parameters of the fractured failure surface to be smaller than the ones of the intact failure surface dismisses the assumption of A = B and m = n usually applied in the RHT-model frame work (Grunwald et al., 2017; Riedel, 2009; Riedel et al., 2009). However, in order to achieve a strength modelling that obtains appropriate results for impact loading at pressures of several GPa, the chosen approach is necessary. This issue is discussed in further detail in reference (Sauer et al., 2024a).
Although the criteria considered in the parameter studies may depend on many different parameters, a tendency for the origin of the derived parameters can be given. The fractured failure surface parameters B and m mainly stem from the reproduction of the residual velocities. Even though the fractured strength constant B remained unchanged from the failure surface constant A in the end, it was varied in intermediate studies. Furthermore, the damage parameters (damage constant D1, minimum strain to failure, principle tensile failure stress) mainly originate from the reproduction of the damage pattern, while the EOS parameters (compaction exponent N, solid EOS parameters A2 and A3) are mainly derived from the reproduction of the free surface velocity time curves. The remaining parameters remain unchanged from the parameter set in reference (Sauer et al., 2024a).
Experimental impact data and performance of simulation model
The experimental results presented in this section consist of residual velocities, qualitative damage, and surface velocity time curves. The latter are the result of the PPI tests, while the former two originate from projectile impact experiments. The performance of the derived simulation model is demonstrated by its capability to simultaneously reproduce this impact data, which has been used in the parameter derivation process.
Residual projectile velocities
Experimental and simulated residual velocities of the ballistic impact of spherical steel projectiles on finite HPFRC targets. Simulated values are only provided for cases with intact projectiles after the perforation.
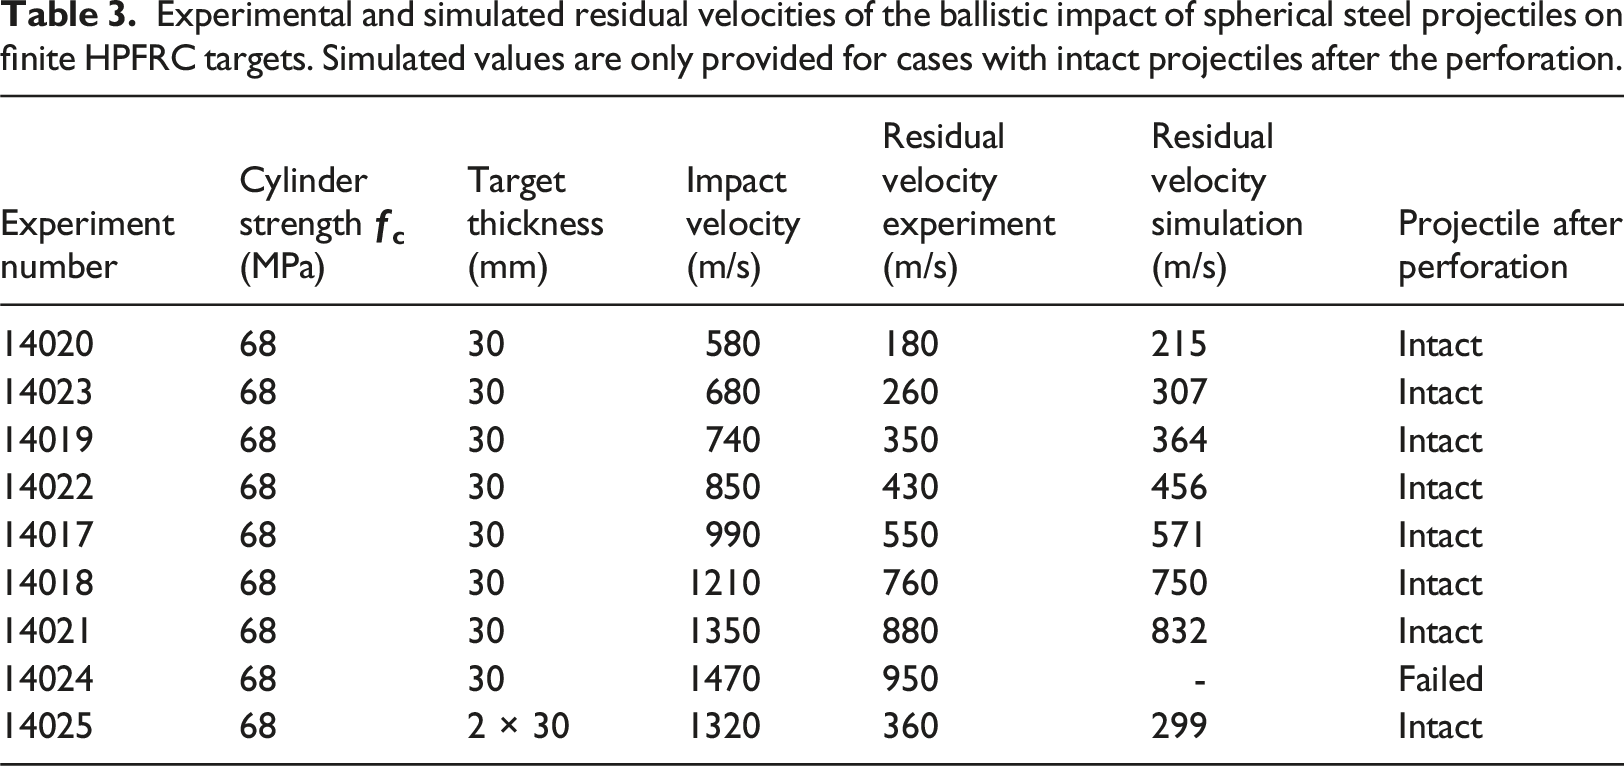
In Figure 2, the residual velocities given in Table 3 are depicted as a function of impact velocity. In this presentation, the experimental residual velocities are directly compared to the values from corresponding hydrocode simulations. Over the comparatively large impact velocity range with intact projectiles in the experiment, an overall good agreement between experiments and simulations can be observed in Figure 2. With closer inspection of the results for the 30 mm thick targets, there seems to be a small tendency towards an overestimation of the residual velocities by the simulation for smaller impact velocities. Similarly, the simulated value for the largest impact velocity slightly underestimates the experimental result. However, these observed deviations remain comparatively small. Overall, the relative deviations of the measured and the simulated velocity loss of the projectile for the cases with 30 mm thick targets in Table 3 are in the range of 2 – 11 %. Comparison of experimentally obtained and simulated residual velocities as a function of impact velocity. In all experiments and corresponding simulations, a spherical steel projectile with a diameter of 13.5 mm was used.
Since only the results for the single plate targets have been employed in the parameter derivation process, the comparison of the residual velocities of the double plate targets constitutes some form of model application. Although the perforation of a single and a double plate target by the same projectile might be a quite similar situation, the significantly longer interaction with the target and the pre-damage by overlapping waves create some differences. Examples for actual application scenarios would be the penetration by projectiles with significantly different geometries, as in references (Sauer et al., 2017b, 2019, 2020). In any case, the experimental velocity loss of the projectile after the perforation of the double plate target is 960 m/s and the corresponding simulated velocity decrease is 1021 m/s. This means the simulated result deviates from the experimental one by 6.0 %, which constitutes a good performance of the numerical model with respect to the reproduction of the residual velocity.
Qualitative damage of perforated targets
A direct comparison of visible qualitative damage for the perforated HPFRC targets with a thickness of 30 mm is presented in Figure 3. In the digital 3D post mortem targets, which have been processed as in reference (Sauer et al., 2024a), some tendencies can be found for the experimentally observed damage patterns (denoted “exp.”). Generally, a little more visible damage can be observed on the back surface with respect to the front. Particularly, the number of cracks is larger on the back surface. These cracks are present for all impact velocities in Figure 3 and become more numerous with increasing impact velocity on both the front and the back. With closer inspection, the crater sizes on both surfaces appear a little larger on the back, while on both sides, only a small tendency of growing crater sizes with increasing impact velocity seems to exist. Comparison of experimentally obtained and simulated damage patterns of perforated HPFRC targets with a thickness of 30 mm. For the simulated targets, contour plots of the RHT damage variable (D ≥ 0.9: red, D < 0.9: blue) are displayed. Moreover, they are tilted by 30° in order to enable an unobscured view of the surfaces. In all cases, a spherical steel projectile with a diameter of 13.5 mm was used.
These observed trends in the experimental damage patterns are adequately reproduced in the corresponding simulated damage patterns (denoted “sim.”) in Figure 3. Consequently, the experimental phenomenology of material damage is properly captured by the simulation model. This conclusion is, at this point, solely based on a qualitative comparison. In the next section, the discussion of the reproduction of target damage by the derived simulation model will be extended towards a quantitative study.
From the comparisons of experimental data and simulation results in Figures 2 and 3, we can conclude that the derived simulation model provides a reasonably accurate strength and damage modelling of HPFRC. In the RHT-model, these are closely linked (Grunwald et al., 2017; Riedel, 2009; Riedel et al., 2009), so an assessment of the performance of the strength and damage parameters should be given for the entire ensemble of parameters. Hence, the good reproduction of the experimental results in Figures 2 and 3 by the simulations shows that the ensemble of strength and damage parameters in Table 2 properly describes the impact response of HPFRC.
Surface velocity time curves from planar plate impact
In Figure 4, the free surface velocity time curves obtained by experiments and simulations of PPI with the setups presented in Figure 1 are depicted. The experimental PPI curves originate from the tests with the experiment numbers “ma-1275” to “ma-1282” (internal designations) and are recorded at the center of the rear surface of the witness plate. More information on indirect PPI with a sandwich configuration is available in references (Riedel et al., 2008; Sauer et al., 2018, 2022). This information includes the wave propagation in the sample and the witness plate, the corresponding stress-particle velocity plots, and the origin of the characteristic features in the surface velocity time curves. In the following, we only briefly summarize the issues important for the parameter derivation with PPI curves and the consequences for applications of the derived simulation model. Comparison of simulated and experimentally determined free surface velocity time curves from PPI with HPFRC samples and C45 steel plates. The results originate from a standard sandwich geometry with diameters of 38 mm for all plates. Thicknesses are: backing plate 2.0 mm/sample 6.3 mm/witness plate 2.0 mm.
In PPI with the sandwich configuration utilized in this work, the HPFRC sample impacts a C45 steel witness plate. At the impact surface between witness plate and HPFRC sample, a shock wave is created that travels through both the sample and the witness plate. Each time a wave is reflected at the rear surface of the latter, the free surface velocity increases. This leads to characteristic features in the recorded free surface velocity time curve, which can be used to extract highly dynamic material properties of the sample material. In the current work, all material parameters are obtained through a direct comparison of those features in the PPI experiments and simulations. All curves in Figure 4 show the expected characteristic features, which consist of a series of plateaus in the earlier time period followed by a comparatively steep increase towards the final velocity. The first plateau is produced by the initial shock wave and its height results from the momentum conservation under shock. The subsequent plateaus are a consequence of release waves reflected at the interface between witness plate and sample, which then arrive at the free surface as compression waves. These plateaus are at some point followed by the arrival of the initial shock wave that has been reflected at the backing plate. Consequently, the arrival time of this so-called backing reflection carries information on the propagation speed of waves in the shocked, compacted and released material. Moreover, the reached final velocity is affected by the energy absorbed during the compaction of the sample material.
The comparison of measured and simulated free surface velocity time curves in Figure 4 shows an overall good agreement. The heights of the plateaus, the arrival times of the backing reflections, and the reached final velocities are all very similar in the experimental and simulated curves. Most of the remaining small deviations between experiment and simulation can be attributed to the expected experimental scattering in PPI curves of tests with an inhomogeneous material like HPFRC. The only trend for a consistently recognizable mismatch between simulated and measured curves in Figure 4 can be observed for the higher release plateaus. For these, the simulation appears to underestimate their heights for most of the measured curves. This trend has also been found in reference (Sauer et al., 2022) for an ultra-high-performance concrete and is most probably of secondary concern for the desired applications. Anyway, the overall good agreement of the features in the curves in Figure 4 leads to the conclusion that the initial shock, the sample compaction, and the general wave propagation are properly treated in the simulation model for HPFRC. For the application of this simulation model to impact and localized blast scenarios, these are the important issues. Consequently, the parameter set in Table 2 is capable of treating the important EOS properties for the desired applications in an adequate way.
Additional experimental impact data and applications of simulation model
The experimental data discussed in this section has not been used for the parameter derivation of the simulation model for HPFRC. Hence, the comparisons of the experimentally determined damage quantities of the perforated targets and the measured depths of penetration into semi-infinite targets with corresponding simulation results constitute applications of the simulation model.
Quantitative damage of perforated targets
Experimental and simulated damage quantities of the impact of spherical steel projectiles on finite HPFRC targets. The breakthrough, crater, and bulge diameters after perforation are provided. The simulated values are given in parentheses after the corresponding experimental ones.
The minimum breakthrough diameter is determined as the inner circle of the breakthrough of the experimental and the simulated target. Hence, this quantity is a consequence of ejected or compacted material which is a very similar situation in experiment and simulation. However, some difference between the experimental and the simulated breakthrough might occur due to the deviation of the shape of the hole in the target from the assumed circular symmetry.
For the maximum crater diameter, an outer circle including the determined crater area is chosen for both the experiment and the simulation. While for the experiment, this crater area is determined by missing material on the target surface, in the simulation, the visible damage, i.e. cells with a damage variable D ≥ 0.9, defines this area. For that, lines of visible damage emerging from the central damaged area towards the edges of the targets are interpreted as cracks and the remaining visible damage is interpreted as the crater area. The simulated maximum crater diameter corresponds to the smallest circle that includes this crater area.
In the experiment, the maximum bulge diameter is defined as the smallest circle including an asymmetrically shaped edge on the surface of the target at which the concrete material is lifted upwards. This bulge area is explained by the occurrence of a spallation plane above which a bridging effect of the steel fibers partially inhibits target material from breaking away (Sauer et al., 2024b; Wang et al., 2016; Zhong et al., 2021). For the determination of the corresponding simulated quantity, the spallation plane itself is identified and evaluated in the same way as the crater area. This is achieved by removing a few element layers from the target surface until the plane with the largest area of visible damage in the vicinity of this surface is found. Hence, the determination of the simulated maximum bulge diameter is consistent with the explanation of the corresponding experimental damage quantity.
The results for the experimental and simulated damage quantities given in Table 4 are depicted in Figure 5. Panel (a) presents an exemplary target in cross section view with the different damage quantities represented by double arrows in the color of the particular damage quantity. In each remaining panel, an icon of the plotted damage quantity is shown that includes a dashed circle of this particular color. Throughout the presentation of the damage quantities as a function of impact velocity in Figure 5, the experimentally determined values are given as black symbols, while the simulated ones are shown in red. In the supplemental material (available online), all experimentally obtained 3D post mortem targets are presented in front, back, and cross section view with the derived damage quantities for the particular target. Comparison of experimentally obtained and simulated values for the minimum breakthrough diameter (in panel b), the maximum crater diameter (front in panel c) and (back in panel e), and the maximum bulge diameter (front in panel d) and (back in panel f) of perforated HPFRC targets with a thickness of 30 mm. In all experiments and simulations, a spherical steel projectile with a diameter of 13.5 mm was used.
From the comparison of the measured and simulated minimum breakthrough diameter in Figure 5(b)), a good agreement is observed. Both the experimental and simulated values increase with increasing impact velocity, but the experimental values exhibit a somewhat steeper increase. In panel (c), an underestimation of the maximum front crater diameter by the simulation is found. The same observation can be made for the quantities in panels (d, e, and f). However, this underestimation is smaller in those cases. For the maximum front bulge diameter in panel d), this deviation is so small that the experimental and simulated values almost agree with each other, while all simulated values remain slightly below the experimental ones. Additionally, all pairs of values in Figure 5(c–f) increase with a similar slope with increasing impact velocity with only a slight increase for the maximum back crater diameter in panel (e). Thus, the observed underestimation by the simulation can be characterized as an offset of different magnitudes in panels (c to f). Despite the discussed deviations, an overall acceptable agreement between experiment and simulation can be concluded from the comparison of damage quantities in Figure 5. This means that the simulation model for HPFRC can be used for reasonably accurate predictions of quantitative target damage by localized high rate loading. In some cases, a moderate underestimation of damage can be expected for the accuracy of these predictions.
Depths of penetration
Experimental and simulated depths of penetration of the ballistic impact of spherical steel projectiles on semi-finite HPFRC targets.
The experimental values given in Table 5 are determined by measuring the depth of the crater in the target after the impact experiment. Hence, the obtained experimental value originates from the length of the penetration path of the projectile into the target plus the additional crater depth due to comminuted and broken target material that is subsequently ejected. The latter component of the measured depth of penetration is only present for projectiles which are reflected by the target. Thus, the comparison between experimental and numerical projectile penetration depths in concrete is conceptually not as straightforward as for ductile target materials. In contrast, the behavior of the brittle semi-infinite concrete target somewhat exhibits certain phenomena known for ceramic armor materials (Shockey et al., 1990). Consequently, such phenomena need to be treated appropriately in order to obtain agreement between experiments and simulations.
In the corresponding simulations, the projectile is also reflected for all impact velocities. However, obtaining the value for the depth of penetration from these simulations which properly mimics the situation of the experimental determination is, as mentioned, not straightforward in this case. Simply neglecting the contribution of the ejecta and only considering the maximum of the path of projectile penetration is one possibility. The values obtained by this approach are denoted as “projectile penetration only” in Table 5. The other possibility is to find a way to determine the amount of ejected target material in the simulation and use the depth of the resulting crater. Since we do not know of a validated approach for such a determination of ejecta, a method for a rough estimate is used and the corresponding values are denoted as “projectile penetration + estimate for ejecta” in Table 5.
In Figure 6, the values for the depth of penetration summarized in Table 5 are depicted as a function of impact velocity and the method for estimating the amount of ejected target material in a simulation is explained for an exemplary case. At the top of Figure 6, snap shots for this exemplary simulation are presented, which demonstrate the reflection of the projectile after a maximum value of projectile penetration was reached. For a simulation time at which the projectile and some of the concrete material are both already moving in negative z direction (opposite to the impact direction), a zoom is presented in the bottom right. The upper half of this zoom retains the presentation of the damage variable D of the RHT-model (Riedel, 2009; Riedel et al., 2009), while in the lower half, velocity vectors are shown for the grey HPFRC. These vectors are depicted in red for absolute values exceeding a threshold value of vz = 5 m/s and in blue for smaller absolute values. This threshold value of 5 m/s constitutes a rough estimate for a transition velocity at which fully damaged cells are ejected from the target. In this estimated scenario, elements with smaller velocities remain attached to the target due to a bridging effect of the steel fibers or other possible mechanisms. The corresponding depth of penetration with this estimate for the ejecta is obtained at the point of the velocity transition in the middle of the target. This point is marked with a black dot and a dashed white line in the zoom of the presented example. In the direct comparison of the two white lines in this zoom, the difference between the simulated penetration depth with (white dashed line) and without this estimate for the ejecta (while straight line) becomes clearly visible. The values plotted in the lower left of Figure 6, which are obtained with (orange) and without estimated ejecta (olive) are thus significantly different. Comparison of experimentally obtained and simulated depths of penetration. Bottom left: All values are given as a function of impact velocity. For an exemplary simulation, snap shots (top) and a zoom depicting the method for obtaining values that include an estimate for the ejecta (bottom right) are displayed. In all experiments and corresponding simulations, a spherical steel projectile with a diameter of 13.5 mm was used.
In the comparison of the experimental and simulated values of the depth of penetration in Figure 6, the simulated values determined with the estimate for the ejecta (orange) are in good agreement with the experimental ones (black). In contrast, the simulated penetration depths obtained only from the projectile penetration (olive) are situated significantly below the experimental ones for the entire range of impact velocities. Hence, neglecting the ejecta, the simulation model for HPFRC underestimates the depth of penetration into semi-infinite targets of this material. In this scenario, the deviation between experiment and simulation in Figure 6 ranges from approximately 5 – 16 mm which corresponds to 0.4 – 1.2 projectile diameters. In terms of relative deviation, a range of 28 – 38 % can be calculated from the values in Table 5. This significant mismatch with the experimental values suggests that some estimate for the ejecta has to be made for the evaluation of the simulation results in order to determine a value that corresponds to the experimental situation whenever the projectile is reflected by a concrete target. We would like to emphasize at this point that the chosen absolute value for the transition velocity of the ejecta of 5 m/s is only a rough estimate and not based on any data. It is, however, within a reasonable range for a fiber concrete material. The method for the determination of the ejecta with this estimated transition velocity is hence not validated. Still, performing this method of evaluation for obtaining depths of penetration from our simulation results demonstrates that a good reproduction of the experimental data can be reached with our simulation model when a reasonable estimate for the ejected target material is considered.
Conclusions
In this work, we provide a large data set obtained from impact experiments, which consist of projectile impact and planar plate impact (PPI) with targets and samples of a high-performance fiber reinforced concrete (HPFRC). For the same material, three different lots with compressive cylinder strengths of fc = 68, 84, and 101 MPa were investigated. Projectile impact experiments with finite targets and spherical steel projectiles were performed with an impact velocity range of 580 to 1470 m/s. From these tests, residual projectile velocities as well as the qualitative and quantitative target damage were obtained. The damage results originate from digital 3D targets produced by 3D-scanning and subsequent processing. This results in the qualitative damage information of damage patterns consisting of craters and cracks and in five damage quantities. The derivation process leading to this data is applied from reference (Sauer et al., 2024b). In additional tests with the same projectile impacting semi-infinite targets, depths of penetration in an impact velocity range of 530 to 1230 m/s were measured. Moreover, we present free surface velocity time curves of PPI tests in an impact velocity range of 270 to 1420 m/s. This large set of high-velocity impact data can be used to validate numerical, analytical, and empirical models.
We further used quasi-static and low rate material characterization tests, literature sources, and part of the presented impact data for the derivation of a simulation model, which in this work is a parameter set for the established RHT-concrete model (Grunwald et al., 2017; Riedel, 2009; Riedel et al., 2009). The model parameter derivation was performed with the same methodology as in reference (Sauer et al., 2024a). The good performance of the derived simulation model is demonstrated with a simultaneous reproduction of the measured residual velocities, qualitative damage patterns, and characteristic features in the free surface velocity time curves. Moreover, the derived simulation model is applied to a study of quantitative damage using the methodology of reference (Sauer et al., 2024a). The comparison of experimental and simulated damage quantities reveals an acceptable agreement. In a second application of the derived simulation model, the penetration into semi-infinite targets was investigated. In a comparison of the simulated and measured depths of penetration, a good agreement could be achieved. However, this good match required a reasonable estimate of the ejected concrete material, which was performed in order to mimic the observed situation of the experiment. Such an evaluation method of penetration depths appears to be necessary whenever the projectile is reflected by the target. This phenomenon was observed for all conducted experiments and simulations with semi-infinite targets in this work.
From the comprehensive combined experimental and numerical study conducted in this work, we conclude that the derived simulation model should possess predictive capabilities for applications of localized high rate loading scenarios of HPFRC with a compressive strength around 70 to 100 MPa. This conclusion is based on the good performance of the model for the comparatively large data set originating from production lots with compressive strengths of 68, 84 and 101 MPa. Hence, around this range, we expect reasonably accurate predictions of results for projectile impact, contact detonation, and close-in detonation by the provided simulation model.
Supplemental Material
Supplemental Material - Experimental and numerical high-velocity impact studies of high-performance fiber reinforced concrete
Supplemental Material for Experimental and numerical high-velocity impact studies of high-performance fiber reinforced concrete by C Sauer, J Burtsche, F Bagusat, C Roller, A Heine and W Riedel in International Journal of Protective Structures.
Footnotes
Acknowledgements
We thank the involved technicians at EMI for the production of HPFRC and performing the experiments. Moreover, we thank C. Grunwald, M. Sauer, and S. Signetti for stimulating discussions. Furthermore, we would like to thank H. Sohn for his kind support.
Declaration of conflicting interests
The author(s) declared no potential conflicts of interest with respect to the research, authorship, and/or publication of this article.
Funding
The author(s) disclosed receipt of the following financial support for the research, authorship, and/or publication of this article: We acknowledge funding by the Federal Office of Bundeswehr Equipment, Information Technology and In-Service Support (BAAINBw) and by the Federal Ministry of Defence (BMVg).
Data availability statement
Simulations are performed with the commercial hydrocode software ANSYS-AUTODYN (Version 19.1).
Supplemental Material
Supplemental material for this article is available online.
References
Supplementary Material
Please find the following supplemental material available below.
For Open Access articles published under a Creative Commons License, all supplemental material carries the same license as the article it is associated with.
For non-Open Access articles published, all supplemental material carries a non-exclusive license, and permission requests for re-use of supplemental material or any part of supplemental material shall be sent directly to the copyright owner as specified in the copyright notice associated with the article.