
Abstract
Background:
Liver cirrhosis, characterized by chronic inflammation, is frequently complicated by malnutrition. Nutritional indices, such as the prognostic nutritional index (PNI) and the skeletal muscle index (SMI), calculated as the muscle area quantified via CT scans at the third lumbar vertebra level divided by the square of the patient’s height in meters (cm2/m2), are associated with outcomes in inflammatory diseases.
Objectives:
We aimed to evaluate the diagnostic efficacy of the PNI both independently and in combination with the SMI for identifying malnutrition in cirrhosis and to explore their prognostic implications.
Design:
A single-center retrospective cohort study of 262 hospitalized cirrhotic patients (2018–2023). Malnutrition was assessed using PNI, PNI-SMI, and Global Leadership Initiative on Malnutrition (GLIM) criteria, respectively.
Methods:
Nutritional status was defined by PNI (<28.85), PNI-SMI (either reduced PNI or SMI), and GLIM criteria. SMI was quantified via third lumbar vertebra CT scans. Diagnostic performance was evaluated using sensitivity, specificity, and area under the curve (AUC). Cox regression and Kaplan–Meier analyses assessed associations with 1-year mortality.
Results:
The prevalence of malnutrition, as determined by various criteria, was considerably heterogeneous: 26.72% by the PNI, 56.11% by the PNI-SMI, and 51.14% by the GLIM criteria. Patients classified as malnourished demonstrated inferior clinical parameters and a higher 1-year mortality rate. The PNI-SMI combination exhibited favorable diagnostic performance in detecting malnutrition, with a sensitivity of 75.51%, specificity of 80%, along with an area under the curve of 0.774. Multivariate Cox analysis indicated that all three malnutrition criteria were independently associated with 1-year all-cause mortality, with hazard ratios of 2.56, 4.20, and 7.20, respectively.
Conclusion:
The PNI, particularly when integrated with the SMI, offers a streamlined yet moderately accurate tool for nutritional and prognostic assessment in decompensated cirrhosis. This combined approach may serve as a practical supplement to GLIM criteria in select clinical contexts, potentially improving outcomes through targeted nutritional interventions.
Keywords
Introduction
Liver cirrhosis, an advanced stage of chronic liver disease, is intrinsically linked to chronic inflammation, characterized by permanent activation of immune pathways and cytokine dysregulation, which exacerbates hepatic damage and systemic complications. 1 This inflammatory milieu not only accelerates disease progression but also profoundly disrupts metabolic homeostasis, contributing to malnutrition and muscle wasting—critical determinants of clinical outcomes.2,3 Emerging evidence implicates the interplay between nutritional status, inflammatory markers, and prognosis in cirrhosis, highlighting the need for robust risk-stratification tools.4–8
Sarcopenia is recognized as a core component of malnutrition in cirrhotic patients, representing a musculoskeletal disorder characterized by reduced skeletal muscle mass, strength, and functionality. 3 The American Association for the Study of Liver Diseases (AASLD) Practice Guidelines define it concisely as the loss of muscle mass. 3 The prevalence of sarcopenia has been estimated to be approximately 14%–55%.3,9 Sarcopenia can be assessed using handgrip strength (HGS) and skeletal muscle index (SMI), with the third lumbar vertebra-SMI (L3-SMI) established as a reliable metric for defining sarcopenia and evaluating nutritional status. 10 Accordingly, sarcopenia has been consistently associated with poor prognosis and reduced survival. 11
The Prognostic Nutritional Index (PNI) is an explicit and objective indicator reflecting underlying inflammation and nutritional status, derived from serum albumin and lymphocyte count, initially conceived as a predictive factor concerning nutritional status associated with surgical risk.12,13 In recent years, PNI has emerged as an independent prognostic predictor for a variety of diseases, including autoimmune diseases, cardiac conditions, renal diseases, type 2 diabetes, and gastrointestinal tumors,14–21 while studies have also highlighted its relation to liver disease prognosis.6–8 However, PNI relies solely on laboratory parameters and lacks anthropometric input. Consequently, we hypothesize that combining PNI with SMI—two objective and reproducible biomarkers—could yield a more accurate and comprehensive assessment of nutritional status in decompensated cirrhosis, by capturing inflammatory burden, nutritional deficits, and muscle depletion in a synergistic manner.
This study adopts the Global Leadership Initiative on Malnutrition (GLIM) criteria as the gold standard for diagnosing malnutrition, 22 evaluating the diagnostic value of PNI as a single indicator and in combination with SMI-defined sarcopenia to identify malnourished patients, and exploring its impact on prognostication.
Subjects and methods
Study cohort
This single-center retrospective study enrolled patients with cirrhosis hospitalized in the Department of Gastroenterology and Hepatology at Tianjin Medical University General Hospital (TJMUGH) from 2018 to 2023. Eligibility for inclusion was contingent upon the following criteria: (1) Adult patients with cirrhosis diagnosed based on medical history, laboratory examinations, imaging data, and/or liver biopsy; (2) hospitalization due to cirrhosis-related complications, such as ascites, hepatic encephalopathy (HE), or gastroesophageal varices; (3) availability of abdominal CT scans within 3 months prior to or during hospitalization. Patients who met any of the following exclusion criteria were ruled out: (1) acute-on-chronic liver failure (ACLF) upon admission; (2) primary hepatocellular carcinoma or extrahepatic malignancies; (3) severe cognitive impairment or HE precluding GLIM assessment23,24; (4) refusal to engage in regular follow-ups. A total of 262 hospitalized patients were included in the final analysis (Figure 1).
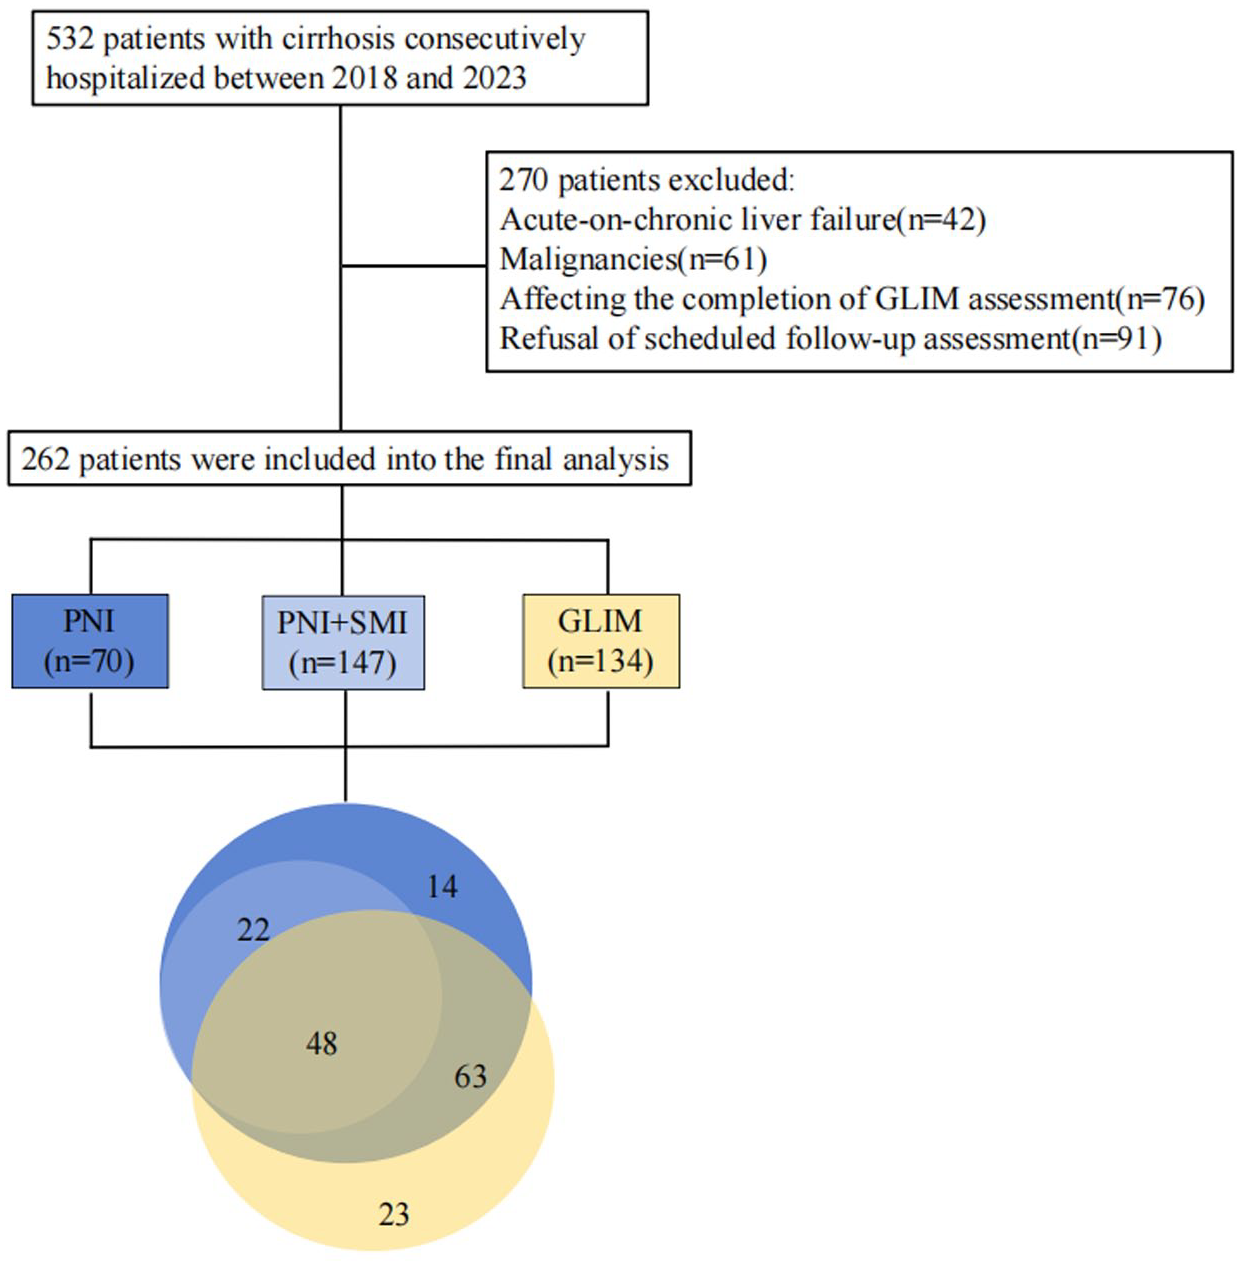
The flowchart and Venn diagram showing the overlap of malnutrition assessment in cirrhotic patients using three criteria: Blue (PNI, n = 70), patients identified as malnourished by PNI alone. Light blue (PNI + SMI, n = 147), patients identified as malnourished by the combination of PNI and SMI. Yellow (GLIM, n = 134), patients identified as malnourished by GLIM criteria.
Study variables
Upon hospital admission, a comprehensive dataset was systematically collected, encompassing demographic characteristics (gender, age), etiological determinants of cirrhosis, clinical manifestations of decompensation, and laboratory profiles including complete blood count, hepatic function tests, renal function tests, coagulation studies, and electrolytes. The Child-Turcotte-Pugh (CTP) score was employed as the standard metric for evaluating liver dysfunction severity. Given that a subset of the enrolled cirrhotic patients exhibited ascites, their dry weight was estimated by applying differential weight reductions based on the severity of ascites: 15% for large, 10% for moderate, and 5% for mild ascites. Patients presenting with peripheral edema were subject to an additional 5% weight deduction to account for fluid retention. 25
PNI calculation
The PNI is calculated using the following formula: 10 × serum albumin (g/L) + 5 × total lymphocyte count (109/L).12,13 Serum albumin values were extracted from hepatic function tests, and total lymphocyte counts were obtained from complete blood counts. We calculated the PNI for each participant.
Assessment of muscle mass reduction
In our prior research, we delineated the protocols for assessing body composition. 26 Cirrhotic patients underwent abdominal CT scans using a spectral CT scanner (Discovery 750 HD 64-row; General Electric Company, Boston, Massachusetts, USA) with standardized protocols to ensure consistency in image acquisition. An open-source MATLAB-based software (version R2010a; MathWorks Inc, Natick, Massachusetts, USA) was employed for analyzing the images. 27 The software utilizes a three-step analytical pipeline: beginning with preprocessing to remove background elements from CT images by applying Hounsfield unit (HU) thresholds and morphological operations; followed by a boundary detection phase where the muscle-inner organ boundary is delineated semiautomatically using the active contour method, optimizing internal forces related to curve smoothness and external forces related to boundary position, applied to intensity-transformed images with a range of +10 to +100 HU; and finally, in the tissue identification phase, subcutaneous fat, muscle, and visceral fat are segmented using fuzzy c-means clustering algorithms in conjunction with region-specific thresholds. The muscle is identified within an HU range of −29 to 150, while visceral fat is identified within an HU range of −300 to −50. The SMI was ascertained by calculating the muscle area at the third lumbar vertebra (cm2) and dividing it by the square of the patient's height in meters (m2) (Supplemental Figure 1). To ensure analytical consistency, two trained researchers (B.B.P and J.L), blinded to clinical outcomes, independently performed all measurements, with any discrepancies resolved through consensus discussion. Given the lack of globally recognized cutoff values for muscle mass depletion across different ethnicities, we applied prognostic SMI cutoffs from our previous work, classifying reduced muscle mass as an SMI of less than 46.96 for males and less than 32.46 for females. 28
Combined PNI and SMI assessment for nutritional evaluation
Prior empirical evidence has underscored the superior prognostic efficacy of the conjoint assessment of PNI and SMI for nutritional assessment with respect to disease prognosis. 29 In this study, we have integrated the radiographic parameter SMI as an adjunct to the serologic marker PNI, delineating malnutrition as the presence of either a reduced PNI or SMI.
GLIM criteria application
The diagnosis of malnutrition adheres to the GLIM criteria, following a two-step approach. Initially, healthcare professionals deployed the Royal Free Hospital-Nutritional Prioritizing Tool (RFH-NPT) for a preliminary nutritional risk screening. Numerous studies have validated the clinical significance and utility of the RFH-NPT, detailing its procedures. 30 In brief, the RFH-NPT assesses parameters including tube feeding, baseline body mass index (BMI) levels, the presence of fluid overload (ascites/edema), involuntary weight loss, food intake, and the impact of excessive fluid on food intake. Patients with an RFH-NPT score of ⩾1 underwent further nutritional assessment. Subsequently, malnutrition was identified by applying the GLIM criteria, which necessitates the fulfillment pertinent to at least one phenotypic and one etiologic criterion. Phenotypic criteria encompass involuntary weight loss of > 5% within the past 6 months or >10% over 6 months; low BMI (kg/m2); and reduced muscle mass. For Asian subjects, a reduced BMI is defined as <18.5 kg/m² for those under 70 years and <20 kg/m² for those 70 years or older. 31 Muscle mass assessment adhered to the criteria predicated on the same criteria based on SMI as defined earlier. Etiologic criteria include reduced food intake, which is discernible from answers in the RFH-NPT. For the identification of inflammatory activity, a neutrophil-to-lymphocyte ratio (NLR) >5 was selected, an indicator associated with various adverse outcomes. 32
Study outcome
The primary endpoint of this investigation was the quantification of all-cause mortality over a 1-year surveillance period. Outcome data were collected through direct testimonials from patients or their kin, including survival verification via telephonic follow-ups or in-clinic consultations, and subsequently authenticated by a thorough review of the citywide electronic health records, which provided specifics regarding the date and etiology of mortality. For subjects who remained alive at the 1-year timepoint, data collection was terminated, with the ultimate follow-up date documented as December 2024.
Statistical analysis
Continuous variables are presented as median values with corresponding interquartile ranges, whereas categorical variables are expressed as frequencies (proportions, %). Differences in continuous variables were analyzed using the Mann–Whitney U test. Categorical data comparisons were executed utilizing Fisher's exact test or the chi-square test, as appropriate. For the assessment of 1-year all-cause mortality, time-dependent receiver operating characteristic (ROC) curves were generated for each nutritional criterion. The Youden index was used to determine the optimal PNI cutoff value. Patients were stratified into high and low PNI groups based on this threshold. Kaplan–Meier analysis and the log-rank test compared 1-year all-cause mortality rates between malnourished and well-nourished groups across nutritional metrics. A trilogy of multivariate Cox proportional hazards models was meticulously constructed to evaluate the hazard ratios (HRs) for PNI in isolation, PNI in conjunction with SMI, and GLIM criteria for malnutrition. Cohen's | statistic was engaged to quantify the diagnostic agreement between PNI and GLIM criteria for malnutrition, as well as between PNI combined with SMI and GLIM criteria. A two-tailed p-value threshold of < 0.05 was designated to denote statistical significance. The statistical analyses were executed utilizing Zstats; Hangzhou, Zhejiang Province, China (https://www.medsta.cn/software) and SPSS version 21.0 (IBM; New York, NY, USA) software.
Results
Demographic and clinical profiles stratified by malnutrition status
Following the application of the predefined inclusion and exclusion criteria, this study initially enrolled a cohort of 532 hospitalized cirrhotic patients. Of these, 262 individuals successfully completed the requisite data collection, nutritional evaluation, and subsequent follow-up protocols. The cohort was predominantly male (53.44%), with a median age of 63 years. Etiologies of cirrhosis included alcohol-related liver disease/nonalcoholic steatohepatitis (32.44%), chronic viral hepatitis (23.66%), immune-mediated disease (26.34%), and cryptogenic causes (17.56%). Decompensation features were common: ascites (65.65%), HE (8.4%), gastroesophageal varices (70.99%), and infection (19.08%). The median Child-Turcotte-Pugh (CTP) score was recorded as 8.
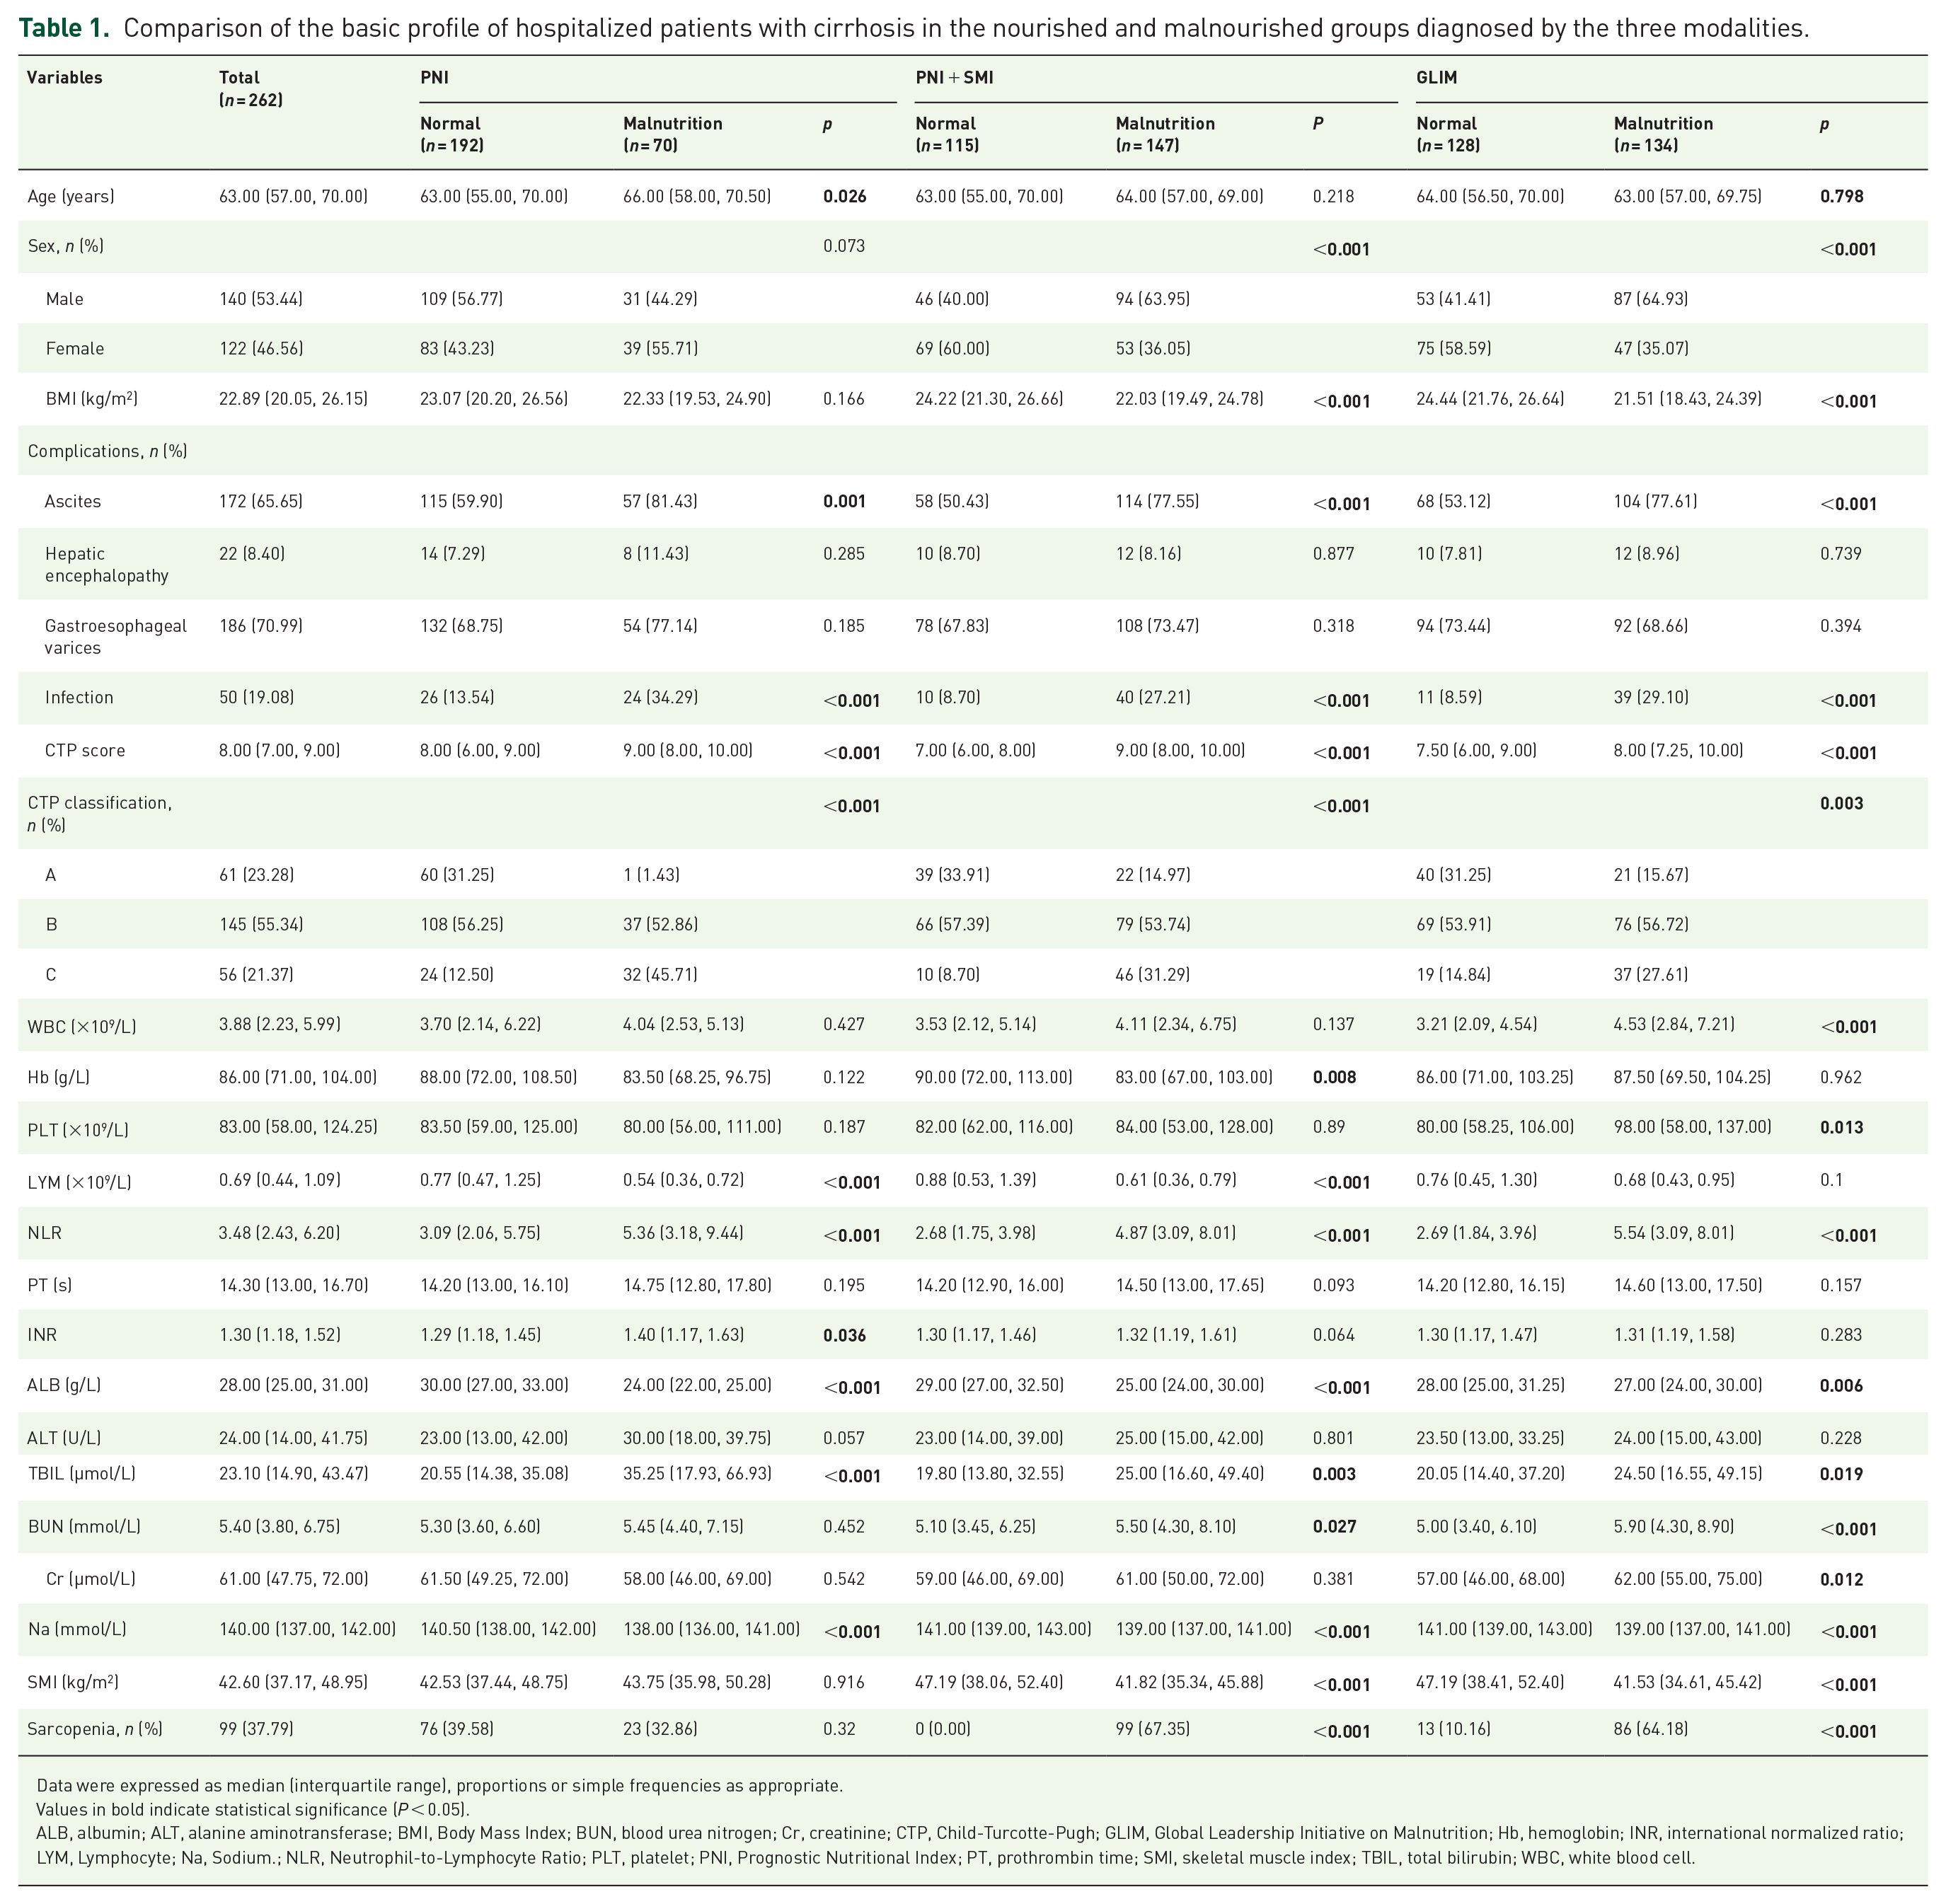
The area under the ROC curve for the PNI, predicated on the binary outcomes of death or survival, was ascertained to be 0.611. This figure corresponds to a sensitivity of 79.1% and a specificity of 45.9%. The discriminative threshold for PNI, below which malnutrition is diagnosed, was established at 28.85, accounting for 26.72% of the total cases. When malnutrition was appraised via the conjoint criteria of PNI and SMI, it accounted for 147 instances, representing 56.11% of the cohort. Utilizing the RFH-NPT for preliminary nutritional risk assessment, followed by the GLIM criteria for definitive diagnosis, malnutrition was identified in 134 cases, which corresponds to a prevalence of 51.14% (Figure 1). In CTP A patients (n = 61), malnutrition rates were markedly lower compared to advanced stages: PNI: 1.43% (1/61); PNI + SMI: 14.97% (22/61); GLIM: 15.67% (21/61). In contrast, for CTP B + C patients (n = 201), malnutrition prevalence increased substantially: PNI: 26.87% (69/201); PNI + SMI: 62.19% (125/201); GLIM: 56.22% (113/201; Table 1).
Comparison of the basic profile of hospitalized patients with cirrhosis in the nourished and malnourished groups diagnosed by the three modalities.
Data were expressed as median (interquartile range), proportions or simple frequencies as appropriate.
Values in bold indicate statistical significance (P < 0.05).
ALB, albumin; ALT, alanine aminotransferase; BMI, Body Mass Index; BUN, blood urea nitrogen; Cr, creatinine; CTP, Child-Turcotte-Pugh; GLIM, Global Leadership Initiative on Malnutrition; Hb, hemoglobin; INR, international normalized ratio; LYM, Lymphocyte; Na, Sodium.; NLR, Neutrophil-to-Lymphocyte Ratio; PLT, platelet; PNI, Prognostic Nutritional Index; PT, prothrombin time; SMI, skeletal muscle index; TBIL, total bilirubin; WBC, white blood cell.
Comparative clinical attributes of malnourished versus well-nourished patients across nutritional assessment modalities
Table 1 delineates the clinical parameter discrepancies between the malnourished and well-nourished patient cohorts, as ascertained by three distinct nutritional assessment methodologies. Relative to the well-nourished group, patients categorized as malnourished via PNI, PNI in combination with SMI, and GLIM demonstrated a heightened prevalence of ascites and infections, coupled with markedly adverse NLR, serum albumin, and total bilirubin levels (p < 0.05). Furthermore, the incidence of malnutrition was notably higher among male patients identified by PNI in conjunction with SMI or GLIM criteria, and this was correlated with an augmented frequency of sarcopenia (p < 0.05). Notably, patients identified as malnourished exclusively by PNI were of advanced age, while those deemed malnourished by the combined PNI-SMI or GLIM criteria presented with significantly reduced BMI values (p < 0.05).
Concordance with GLIM criteria
Table 2 presents a comparative analysis of the diagnostic metrics for PNI and the PNI-SMI composite in the context of malnutrition as defined by GLIM criteria. This analysis encompasses sensitivity, specificity, positive predictive value, negative predictive value, positive likelihood ratio, negative likelihood ratio, and the area under the receiver operating characteristic curve (AUC). The PNI-SMI composite exhibited commendable diagnostic accuracy, characterized by a sensitivity of 82.84%, specificity of 71.87%, and an AUC of 0.774. Notably, the κ coefficient, which measures agreement with the GLIM criteria, was robust at 0.850 (p < 0.001). In contrast, the diagnostic efficacy of PNI as a solitary indicator was suboptimal.
Cross tabulation of the results of PNI, PNI + SMI, and GLIM diagnostic criteria for the diagnosis of malnutrition.

AUC, area under the curve; GLIM, Global Leadership Initiative on Malnutrition; PNI, Prognostic Nutritional Index; SMI, skeletal muscle index.
Influence of nutritional assessment strategies on 1-year survival in cirrhotic patients
Kaplan–Meier survival analysis revealed significantly higher 1-year all-cause mortality in malnourished patients across all three criteria (Figure 2). Stratified Kaplan–Meier analysis by CTP class demonstrated significant differences in 1-year all-cause mortality among patients classified as malnourished by all three nutritional assessment criteria in the CTP B + C groups, whereas no such differences were observed in the CTP A group (Supplemental Figure 2). Univariate analysis indicated that HE, gastroesophageal varices, infections, leukocyte count, hemoglobin levels, platelet (PLT) count, serum albumin, total bilirubin, creatinine, CTP score, and malnutrition were correlated with extended-term mortality (Table 3). Multivariate analysis confirmed that these nutritional criteria were independently predictive of 1-year all-cause mortality, with HRs escalating in an orderly sequence (Table 4). In the univariate Cox regression analysis (Model 1), the risk of all-cause mortality was heightened in the low PNI group (HR 2.56, 95% CI 1.58–4.34, p < 0.001), the PNI combined with SMI malnutrition group (HR 3.56, 95% CI 1.89–6.70, p < 0.001), and the GLIM malnutrition group (HR 7.62, 95% CI 3.62–12.04, p < 0.001). Model 2 incorporated adjustments for age, gender, and BMI, while Model 3 expanded these adjustments to include gastroesophageal varices, infections, CTP score, leukocyte count, PLT, urea, creatinine, and serum sodium. Both Model 2 and Model 3 demonstrated an increased risk of all-cause mortality in the low PNI group (Model 2: HR 2.88, 95% CI 1.59–5.22, p < 0.001; Model 3 HR 2.56, 95% CI 1.19–5.51, p = 0.016), the PNI-SMI malnutrition group (Model 2 HR 3.88, 95% CI 1.85–8.10, p < 0.001; Model 3: HR 4.20, 95% CI 1.77–9.96, p = 0.001), and the GLIM malnutrition group (Model 2: HR 7.13, 95% CI 3.57–13.48, p < 0.001; Model 3: HR 7.20, 95% CI 2.95–14.90, p < 0.001). Furthermore, time-dependent ROC curve analysis unveiled the areas under the curve for the three nutritional assessment criteria as 0.625 (sensitivity: 79.1%, specificity: 45.9%), 0.658 (sensitivity: 80.3%, specificity: 51.2%), and 0.733 (sensitivity: 86.9%, specificity: 59.7%), respectively, indicating a progressive enhancement (Figure 3).

Kaplan–Meier survival curves illustrating the 1-year all-cause mortality rates in hospitalized cirrhotic patients with and without malnutrition as assessed by three different malnutrition criteria: PNI, PNI + SMI, and GLIM. The curves demonstrate that patients identified as malnourished by all three criteria exhibited significantly higher mortality rates compared to their well-nourished counterparts. Log-rank tests indicated statistically significant differences in survival outcomes between the malnourished and nourished groups across all three assessment modalities.
Comparison of baseline characteristics between 1-year survival and mortality in hospitalized patients with liver cirrhosis.

Data were expressed as median (interquartile range), proportions or simple frequencies as appropriate.
Values in bold indicate statistical significance (P < 0.05).
ALB, albumin; ALT, alanine aminotransferase; BMI, Body Mass Index; BUN, blood urea nitrogen; Cr, creatinine; CTP, Child-Turcotte-Pugh; GLIM, Global Leadership Initiative on Malnutrition; Hb, hemoglobin; INR, international normalized ratio; LYM, Lymphocyte; Na, Sodium.; NLR, Neutrophil-to-Lymphocyte Ratio; PLT, platelet; PNI, Prognostic Nutritional Index; PT, prothrombin time; SMI, skeletal muscle index; TBIL, total bilirubin; WBC, white blood cell.
Multivariate Cox regression analysis of independent risk factors for 1-year all-cause mortality among the hospitalized patients with cirrhosis.

Model 1: Crude. Model 2: Adjust: age, sex, BMI. Model 3: Adjust: age, sex, BMI, gastroesophageal varices, infection, CTP score, WBC, PLT, BUN, Cr and Na.
Values in bold indicate statistical significance (P < 0.05).
BMI, Body Mass Index; BUN, blood urea nitrogen; CI, confidence interval; Cr, creatinine; CTP, Child-Turcotte-Pugh; GLIM, Global Leadership Initiative on Malnutrition; HR: hazard ratio; Na, Sodium; PLT, platelet; PNI, prognostic nutritional index; SMI, skeletal muscle index; WBC, white blood cell.

Time-dependent ROC curves depicting the predictive accuracy of the three malnutrition criteria (PNI, PNI + SMI, and GLIM) for 1-year all-cause mortality in hospitalized cirrhotic patients. The AUCs are provided for each criterion, with the GLIM criteria demonstrating the largest AUC (0.733), followed by PNI + SMI (0.658) and PNI alone (0.625). These results indicate that the GLIM criteria have the strongest predictive ability for mortality, followed by the combined PNI + SMI assessment, and then PNI alone.
Discussion
The deterioration of nutritional status in cirrhotic patients is closely linked to the progression of hepatic insufficiency and the comorbidities attributable to cirrhosis, including ascites, HE, and infection.33,34 In decompensated cirrhosis, the incidence of malnutrition is notably high, potentially exceeding 50%, 35 and it stands as an independent prognostic marker for mortality. 34 Consequently, the precise identification of malnourished patients is essential for the implementation of targeted therapeutic strategies.
Within this investigation, three distinct modalities assessed nutritional status: PNI alone, PNI combined with SMI, and GLIM criteria. Respectively, 26.72%, 56.11%, and 51.14% of patients were categorized as malnourished. These findings are consistent with the existing literature, yet reveal critical nuances. The GLIM-defined malnutrition prevalence (51.14%) aligns closely with prior reports in decompensated cirrhosis.35,36 Conversely, our PNI-based malnutrition rate (26.72%) was lower than the 29.47% to 57.01% reported in earlier liver disease studies. This discrepancy likely stems from our stringent mortality-optimized cutoff (PNI < 28.85) rather than traditional thresholds (e.g., PNI < 40).12,13 Recent studies in cirrhosis report optimal PNI cutoffs for mortality prediction as around 35 (Ref. 7), suggesting that the profound inflammatory milieu of advanced liver disease, hepatic synthetic dysfunction-induced hypoalbuminemia, and immune dysregulation featured by lymphopenia require lower PNI thresholds for accurate prognosis when compared to populations without significant hepatic impairment. While the traditional cutoff of 40 indicates general nutritional risk, a lower threshold around 30 is more specific for identifying cirrhotic patients at high mortality risk. Our results confirm that PNI < 28.85 significantly predicts mortality despite classifying fewer patients as malnourished, enhancing its prognostic utility in decompensated cirrhosis.
Regarding prognostic value, our multivariate analysis revealed that malnutrition, defined by PNI alone, the PNI-SMI composite, or GLIM criteria, was significantly and independently correlated with a 2 to 7-fold heightened mortality risk. The PNI emerges as a simple and objective metric for capturing inflammatory and nutritional parameters. In our investigation, a PNI value below 28.85 served as the diagnostic threshold for malnutrition, exhibiting a diagnostic sensitivity of 79.1%, specificity of 45.9%, and an AUC of 0.611 concerning 1-year mortality. Notably, the joint PNI and sarcopenia indicators also exhibited robust predictive capabilities for prognosis in cirrhotic patients, achieving an AUC of 0.658. These findings are consistent with other studies emphasizing the incremental value of integrating SMI with PNI.29,37,38 Beyond 1-year mortality, both PNI and sarcopenia may have broader prognostic implications for long-term outcomes in liver transplantation.39,40 While our study focused on 1-year mortality, evidence suggests that these nutritional indicators could serve as valuable tools for identifying patients at risk for adverse long-term outcomes, which warrants further investigation into their sustained prognostic utility in cirrhosis.
To be more precise, the primary goal of detecting malnutrition is to improve patient outcomes. Among patients with relatively preserved liver function, the 1-year mortality rate for those identified as malnourished was around 20%, in stark contrast to the absence of deaths among patients who received appropriate nutritional support within the same timeframe. 41 When employing the GLIM criteria as the reference standard, the diagnostic agreement achieved by PNI alone was suboptimal. Conversely, joint effects of PNI and SMI yielded a significant enhancement in diagnostic agreement. This suggests that, while PNI is proficient in reflecting prognostic trends, it may not fully capture the minor fluctuations of nutritional status. For patients exhibiting low PNI scores, it is prudent to anticipate potential improvements with targeted nutritional interventions. The combined use of PNI and SMI for nutritional assessment corresponds with the malnutrition criteria dictated by the GLIM criteria, positioning this integrated approach as a potent strategy for optimizing patient outcomes through nutritional interventions. In this context, the PNI-SMI combination presents a more straightforward and objective alternative to the intricate and multifaceted application of the GLIM framework in cirrhotic patients. We propose that it can serve as a streamlined supplement to GLIM, particularly in specific scenarios such as resource-constrained settings inaccessible to specialized nutritional assessments or during the serial surveillance of high-risk patients during decompensation episodes where its objective and reproducible nature reduces assessment burden. The PNI-SMI composite is more available for rapid screening and prognostication in decompensated cirrhosis, especially where routine CT enables SMI quantification. Conversely, GLIM remains optimal for a comprehensive diagnosis in complex cases requiring etiological detail. This synergy balances efficiency with diagnostic rigor, allowing clinicians to select the most appropriate tool to facilitate nutritional interventions.
The PNI-SMI combination enhances diagnostic accuracy by capturing both systemic inflammation and muscle-specific catabolism, key factors involved in cirrhosis-related malnutrition. PNI reflects inflammatory and nutritional dysregulation through serum albumin, a marker of hepatic synthetic function and protein-energy status, and lymphocyte count, a proxy for immune competence and chronic inflammation.6–8 In cirrhosis, hypoalbuminemia arises from hepatic insufficiency and systemic inflammation driven by pro-inflammatory cytokines such as IL-6 and TNF-α, which accelerate protein catabolism and suppress albumin synthesis.42,43 Concurrently, lymphopenia—a hallmark of cirrhosis-related immune dysfunction—correlates with bacterial translocation, endotoxemia, and sustained inflammation, further exacerbating malnutrition. 44 Sarcopenia in cirrhosis, driven by hyperammonemia, insulin resistance, and mitochondrial dysfunction as mechanisms that impair muscle protein synthesis and promote proteolysis,45,46 leads to reduced SMI-measured muscle mass. SMI not only serves as a phenotypic marker of malnutrition but also contributes to metabolic derangements, since muscle wasting releases amino acids for subsequent hepatic gluconeogenesis and ureagenesis, perpetuating a catabolic state.46,47 The PNI-SMI combination bridges laboratory-based inflammation markers and structural muscle depletion, demonstrating high concordance with GLIM criteria (κ = 0.85), which require both phenotypic muscle loss and etiologic inflammation to establish diagnosis. As highlighted in the 2021 practice guidance by the American Association for the Study of Liver Diseases, nutritional support is essential for patients with cirrhosis. 3 Patients with low PNI and reduced SMI may benefit from dual interventions: anti-inflammatory strategies such as Omega-3 supplementation or immunonutrition to modulate cytokine-driven catabolism, and muscle-preserving therapies such as combined protein and exercise, which significantly improve muscle mass.48,49 In contrast, sole low PNI may indicate early inflammation, prompting preemptive nutritional support before muscle wasting becomes irreversible. Future efforts should refine these interventions to optimize clinical practice through accumulating evidence.
The present study is not devoid of limitations, which warrant elucidation. First, the single-center, observational design of the study, without sample size calculation, inherently predisposes it to selection bias and limits the generalizability of the findings. Second, including only hospitalized cirrhotic patients, who typically exhibit advanced disease, may overestimate the malnutrition prevalence and mortality risk, curtailing interpretation to community-dwelling or early-stage patients. Third, the absence of a universally accepted optimal cutoff value for PNI remains a challenge; although our threshold of 28.85 was derived from ROC curve analysis and aligned with prior survival studies,6,7 further validation across diverse populations is required to obtain generalizability. Fourth, the survival analysis may have been confounded by variations in therapeutic interventions for cirrhosis during follow-up, amplified by a lack of long-term follow-up data to comprehensively assess dynamic prognostic trajectories. Fifth, our findings are constrained by insufficient representation of heterogeneous populations, particularly regarding dietary habits influenced by socioeconomic and geographic factors such as income and urbanization, population-specific genetic predispositions, and multi-center cohorts, limiting the extrapolation of results.50,51 Finally, while PNI and SMI demonstrated robust prognostic utility in decompensated cirrhosis, their therapeutic potential and the role of nutritional interventions need validation in dedicated trials. To address these gaps, future multi-center prospective studies with extended follow-up are imperative to validate cutoff values across diverse demographics, elucidate the long-term effects of nutritional interventions, and refine prognostic models through integrated analyses of genetic, dietary, and clinical variables. Such endeavors will clarify the therapeutic potential of nutritional optimization in improving outcomes for this vulnerable population.
Conclusion
In summary, the identification and diagnosis of malnutrition in the context of chronic liver disease necessitate a multifaceted approach, underscoring the potential impact of specialized tools to advance nutritional assessment. It is tempting that these tools are both objective and readily implementable within clinical settings. The PNI emerges as a robust predictor of 1-year survival among cirrhotic patients. Its combination with the SMI not only augments prognostic accuracy but also refines the precision of nutritional assessment. Advancing patient outcomes and improving their quality of life necessitates recognizing nutritional assessment and therapy as indispensable issues of liver disease management in daily practice.
Supplemental Material
sj-docx-1-taj-10.1177_20406223251369763 – Supplemental material for Joint effects of prognostic nutritional index and skeletal muscle index on prognosis of decompensated cirrhosis: a retrospective cohort study
Supplemental material, sj-docx-1-taj-10.1177_20406223251369763 for Joint effects of prognostic nutritional index and skeletal muscle index on prognosis of decompensated cirrhosis: a retrospective cohort study by Shuangzhe Yao, Binbin Peng, Jia Li, Ziyi Yang and Chao Sun in Therapeutic Advances in Chronic Disease
Footnotes
Acknowledgements
The authors would like to express their sincere gratitude to the patients and their families for their participation and support in this study. We are also deeply appreciative of the nursing staff and medical technicians at the Department of Gastroenterology and Hepatology, Tianjin Medical University General Hospital, for their invaluable assistance in patient care and data collection. Special thanks go to Dr. Chao Sun for his insightful advice on statistical analysis and manuscript preparation.
Declarations
Supplemental material
Supplemental material for this article is available online.
References
Supplementary Material
Please find the following supplemental material available below.
For Open Access articles published under a Creative Commons License, all supplemental material carries the same license as the article it is associated with.
For non-Open Access articles published, all supplemental material carries a non-exclusive license, and permission requests for re-use of supplemental material or any part of supplemental material shall be sent directly to the copyright owner as specified in the copyright notice associated with the article.