
Abstract
Objective
Patient nutritional status is an independent and crucial prognostic predictor; however, it is often overlooked in clinical practice. This study aimed to evaluate the value of three nutritional risk screening tools—Geriatric Nutritional Risk Index, Prognostic Nutritional Index, and Nutritional Risk Screening 2002—in predicting postoperative prognosis and recurrence in patients with chronic subdural hematoma.
Method
According to the inclusion and exclusion criteria, a total of 153 patients with chronic subdural hematoma who were hospitalized and underwent surgical treatment at our hospital between December 2017 and October 2022 were retrospectively enrolled. General clinical data and laboratory test results were collected. The Nutritional Risk Screening 2002, Geriatric Nutritional Risk Index, and Prognostic Nutritional Index scores were assessed. Based on the modified Rankin scale scores, patients were divided into poor prognosis (score ≥3) and good prognosis (score <3) groups. According to the presence or absence of recurrence within 6 months of surgery, patients were classified into recurrence and nonrecurrence groups. General clinical data, laboratory results, and scores of three nutritional risk screening tools were evaluated. Receiver operating characteristic curves were plotted, and multivariate logistic regression analysis was performed.
Results
Among the 153 patients, 13 (8.5%) had a poor prognosis. Compared with the good prognosis group, patients in the poor prognosis group were older, had higher fibrinogen levels, and had lower serum albumin and hemoglobin levels (p < 0.05). In total, 33 (21.6%) patients experienced recurrence. Compared with the nonrecurrence group, patients in the recurrence group had a higher percentage of monocytes (p < 0.05) and lower body mass index, serum albumin levels, and hemoglobin levels (p < 0.05). In the poor prognosis group, the rates of nutritional risk determined using the Geriatric Nutritional Risk Index, Prognostic Nutritional Index, and Nutritional Risk Screening 2002 were 46.2%, 69.2%, and 92.3%, respectively, which were significantly higher than those in the good prognosis group (p < 0.05). In the recurrence group, the nutritional risk rates determined using the abovementioned three tools were 42.4%, 51.5%, and 78.8%, respectively, all significantly higher than those in the nonrecurrence group (p < 0.05). Receiver operating characteristic curve analysis indicated that the Geriatric Nutritional Risk Index, Prognostic Nutritional Index, and Nutritional Risk Screening 2002 are predictive markers for both surgical prognosis and postoperative recurrence of chronic subdural hematoma. Moreover, multivariate logistic regression analysis identified the three tools as risk factors for poor prognosis and recurrence after surgery for chronic subdural hematoma (p < 0.05).
Conclusion
Three nutritional risk screening tools—the Geriatric Nutritional Risk Index, Prognostic Nutritional Index, and Nutritional Risk Screening 2002—were independently associated with both poor prognosis and recurrence of chronic subdural hematoma. Among them, the Geriatric Nutritional Risk Index showed the highest specificity in predicting poor prognosis, while the Nutritional Risk Screening 2002 demonstrated the highest specificity in predicting postoperative recurrence.
Keywords
Introduction
Chronic subdural hematoma (CSDH) is a common age-related condition. Owing to factors such as brain atrophy and the increasing use of anticoagulant and antiplatelet medications, 1 older populations face a growing risk of developing CSDH, with an annual rise in the associated mortality and morbidity rates.2,3 Older adults are also more susceptible to malnutrition, which has been identified as a significant independent predictor of poor clinical outcomes in conditions such as stroke, heart failure, and cancer.4–6 Nutritional status assessment should be regarded as an essential component of patient management because it can influence clinical outcomes, complication risks, and treatment response. Therefore, early nutritional risk screening deserves greater emphasis in clinical practice. This is particularly relevant for older CSDH patients, who are at higher risk of malnutrition. Preoperative nutritional risk screening, comprehensive assessment, and nutritional guidance are critical for predicting clinical prognosis and optimizing patient care.
The Geriatric Nutritional Risk Index (GNRI) is a screening tool for nutritional risk, calculated using the patient’s height, body weight, and serum albumin (ALB) level. 7 It is strongly associated with malnutrition-related mortality and other adverse outcomes and has been established as a reliable predictor of clinical prognosis in various types of cancer. The GNRI has been validated as an important method for estimating survival in cancer patients, 8 assessing prognosis in those with heart failure, 9 and predicting postoperative complications among older trauma patients. 10 The Nutritional Risk Screening 2002 (NRS 2002) is an evidence-based nutritional risk screening tool developed by the European Society for Clinical Nutrition and Metabolism in 2003; it is recommended for routine use in clinical practice.11,12 Furthermore, it has proven useful in predicting postoperative complications, 13 predicting adverse clinical outcomes in hospitalized adults, 14 and guiding nutritional support strategies for intensive care unit patients. 15 The Prognostic Nutritional Index (PNI) was originally developed by the Japanese researcher Onodera as a novel nutritional indicator for predicting disease progression. 16 It has been reported to be closely associated with prognosis in numerous malignant tumors and has been validated in gastrointestinal cancer, 17 breast cancer, 18 and advanced malignancies. 19 The PNI remains highly valuable in predicting postoperative outcomes for lung cancer, spinal surgeries, and cranial procedures.20–22
CSDH occurs most frequently in older patients, a population that also exhibits a high prevalence of nutritional risk. Previous studies have indicated that a low PNI is associated with postoperative recurrence of CSDH; 23 however, the potential of the GNRI and NRS 2002 in predicting postoperative prognosis and recurrence of CSDH has not yet been thoroughly investigated. Therefore, this study aimed to evaluate and compare the predictive value of these three nutritional risk screening tools (GNRI, PNI, and NRS 2002) by analyzing their correlations with surgical prognosis and recurrence rates of CSDH in older patients.
Methods
Patients
This retrospective study enrolled 153 consecutive patients with CSDH who were admitted to our hospital and underwent concurrent surgical treatment from December 2017 to October 2022. We conducted this study in accordance with the Helsinki Declaration of 1975, as revised in 2024. All procedures were approved by the Ethics Committee of the Affiliated Hospital of Chengde Medical University. Written informed consent was not required for this retrospective study. The reporting of this study conforms to the Strengthening the Reporting of Observational Studies in Epidemiology (STROBE) guidelines. 24 Patients were recruited if they met the following inclusion criteria: (a) age 60–90 years; (b) preoperative craniocerebral computed tomography (CT) establishing a clear diagnosis of CSDH; (c) underwent minimally invasive puncture and drainage for subdural hematoma; and (d) available for postoperative follow-up. Patients were excluded if they met the following exclusion criteria: (a) transfusion of blood products such as human ALB before admission; (b) presence of infectious diseases; (c) history of chronic diseases such as liver cirrhosis, hyperlipidemia, and anemia; or (d) missing clinical data and inability or unwillingness to attend postoperative follow-up.
Data collection
Within 24 h after admission, the patients’ demographic characteristics and clinical information were recorded, including age, sex, height, weight, smoking history, alcohol consumption history, medical history (including hypertension and diabetes), use of anticoagulant and antiplatelet medications, and hematoma location. Nutritional risk screening was performed using the GNRI, PNI, and NRS 2002 scoring systems. Laboratory data were collected to obtain preoperative serum ALB, hemoglobin (HB), cholesterol, triglyceride, and fibrinogen levels, peripheral lymphocyte and neutrophil counts, and peripheral monocyte percentage. Information about the use of urokinase before, during, and after the surgery was obtained from the medical record documentation system. In addition, all patient details have been deidentified.
Operative procedure
The patient was placed in the supine position with the head tilted toward the healthy side. The puncture site was selected at the thickest region of the hematoma. Under local anesthesia, an adjusted YL-1 type puncture needle was vertically advanced into the cranium in a single motion using an electric drill. The dura was carefully ground in situ until perforation was achieved. The needle stylet was then withdrawn, and dark red liquid was observed flowing out. The hematoma cavity was irrigated with saline until the effluent became clear. An external anti-reflux sterile drainage device was connected, the drainage tube was clamped, and the surgical site was dressed with a sterile bandage.
Prognostic score
According to the modified Rankin scale (mRS) score (Table 1) at discharge, participants were categorized into the poor prognosis (score ≥3) and good prognosis (score <3) groups. 25
The modified Rankin scale (mRS).

Follow-up procedure and criteria for recurrence
Patients were followed up at the neurosurgery outpatient clinic 1 month after discharge, and head CT was performed. Recovery status, presence of reported symptoms, and neurological deficits were documented. From months 2 to 6 after discharge, follow-ups were conducted via telephone or at the neurosurgery outpatient clinic to record recovery progress, reported symptoms, and neurological deficits. Recurrence was defined as the re-accumulation of a subdural hematoma on the operative side (CT attenuation values >20 HU), showing an increase in volume compared with the imaging findings at discharge, accompanied with new neurological deficits such as headache, gait disturbance, or hemiparesis, within 6 months postoperatively. 26
NRS 2002
All patients were screened for nutritional risk using the NRS 2002 (Table 2); the total score was calculated using the following formula: total score = (highest score obtained from the nutritional status indicator) + (highest disease severity score obtained) + (age score). A score ≥3 was considered to indicate nutritional risk.
The NRS 2002 scoring criteria.
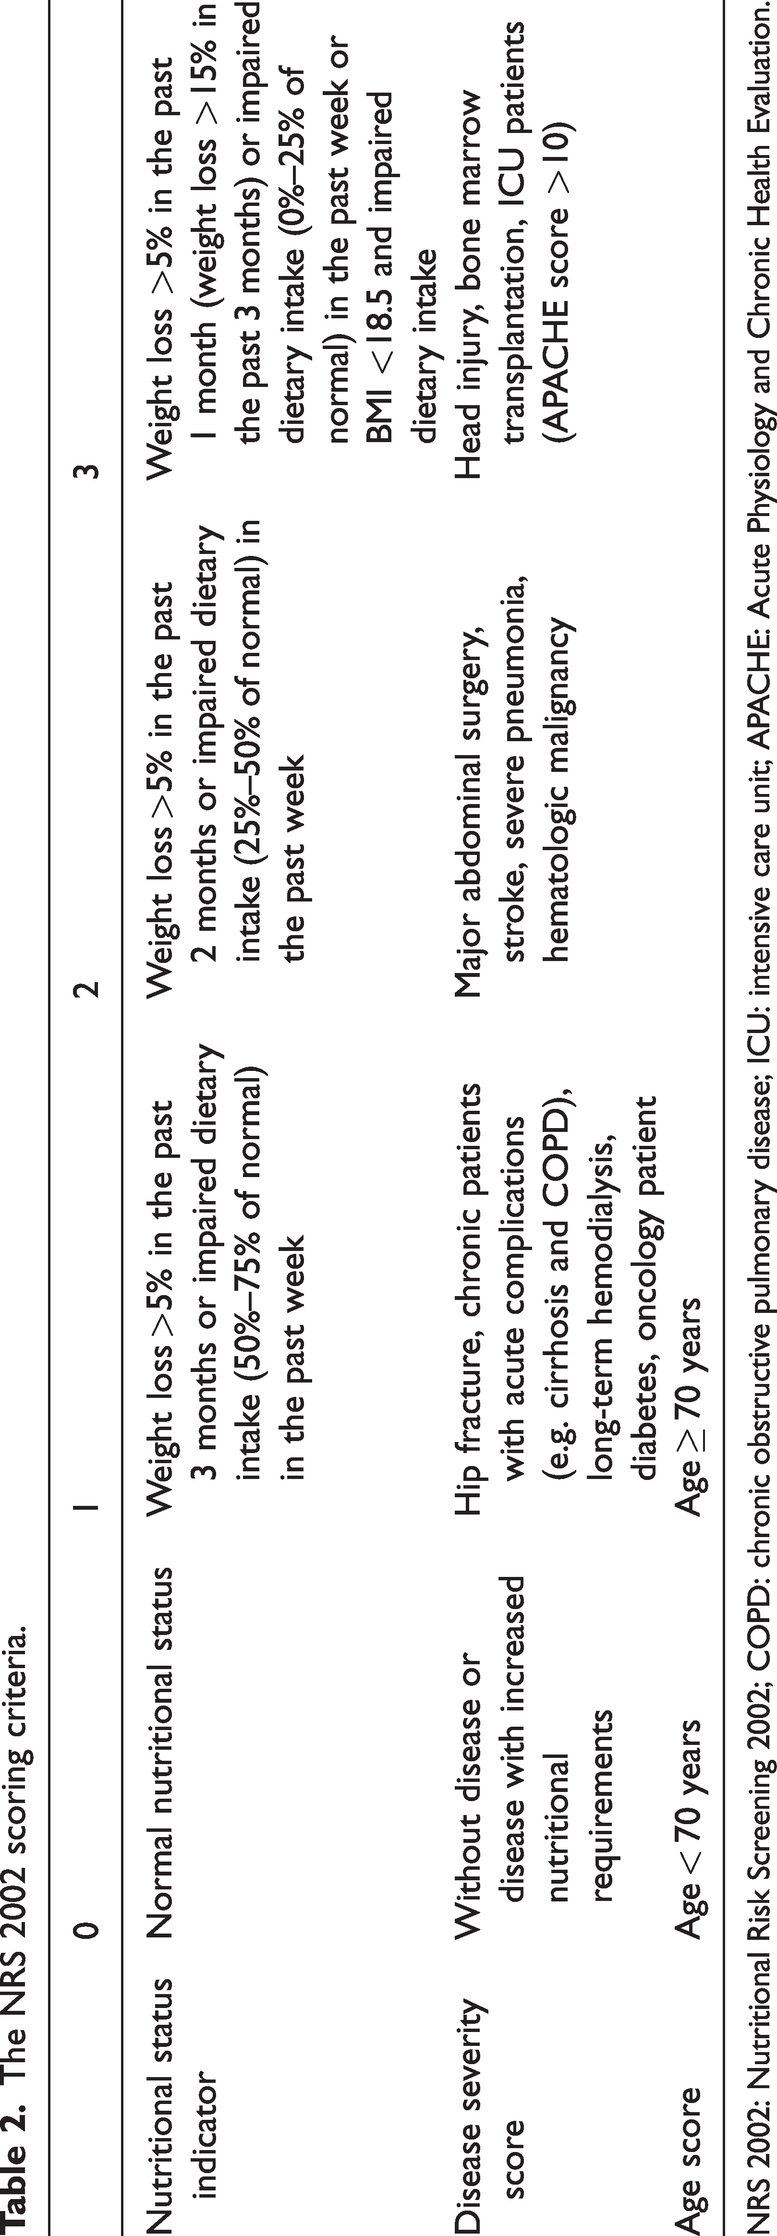
NRS 2002: Nutritional Risk Screening 2002; COPD: chronic obstructive pulmonary disease; ICU: intensive care unit; APACHE: Acute Physiology and Chronic Health Evaluation.
GNRI
The GNRI was calculated as follows: GNRI = 1.489 × serum ALB (g/L) + 41.7 ×(actual body weight/ideal body weight). 7 Ideal body weight = patient’s height (m) 2 ×22 (body mass index (BMI)). When the actual preoperative body weight was higher than the ideal weight, the ratio was set to 1. GNRI ≥98 indicated no nutritional risk, while GNRI <98 indicated the presence of nutritional risk.
PNI
The PNI was calculated using the formula: PNI = ALB (g/L) + 5 × lymphocyte count (×109/L). 27 According to the criteria established by Onodera et al., 16 PNI ≥45 indicated no nutritional risk, while PNI <45 indicated the presence of nutritional risk.
Statistical analyses
Continuous variables were presented as mean or median (interquartile range), and categorical variables were presented as frequencies (percentages).
We used t-test to determine differences between the poor and good prognosis groups as well as between the recurrence and nonrecurrence groups when the data were distributed normally. Analysis of baseline characteristics was performed using Student’s t-test or Mann–Whitney U test for continuous variables and chi-square test or Fisher exact test for categorical variables. In cases where the data exhibited a hierarchical distribution, the rank-sum test was applied to assess differences between the groups. Receiver operating characteristic (ROC) curves were generated to evaluate the value of the NRS 2002, GNRI, and PNI in predicting postoperative prognosis and recurrence in patients with CSDH. Additionally, multivariate logistic regression analyses were performed to identify risk factors associated with CSDH. A p-value <0.05 was considered statistically significant.
Results
Comparison of clinical data
In total, 153 patients with CSDH who were aged ≥60 years were included; of these, 13 (8.50%) had a poor prognosis and 140 (91.5%) had a good prognosis. Patients with a poor prognosis were significantly older than those with a good prognosis (p < 0.05). Thirty-three (21.6%) patients experienced recurrence within 6 months, while 120 (78.4%) did not; the average BMI of the recurrence group was significantly lower than that of the nonrecurrence group (p < 0.05) (Tables 3 and 4).
Comparison of clinical data between the good and poor prognosis groups.

BMI: body mass index; IQR: interquartile range.
Comparison of clinical data between the recurrence and nonrecurrence groups.

BMI: body mass index; IQR: interquartile range.
Comparison of laboratory indicators
Compared with the good prognosis group, ALB and HB levels decreased and fibrinogen level increased in the poor prognosis group (p < 0.05); compared with the nonrecurrence group, ALB and HB levels decreased, and percentage of monocytes increased in the recurrence group (p < 0.05) (Tables 5 and 6).
Comparison of laboratory indicators between the good and poor prognosis groups.
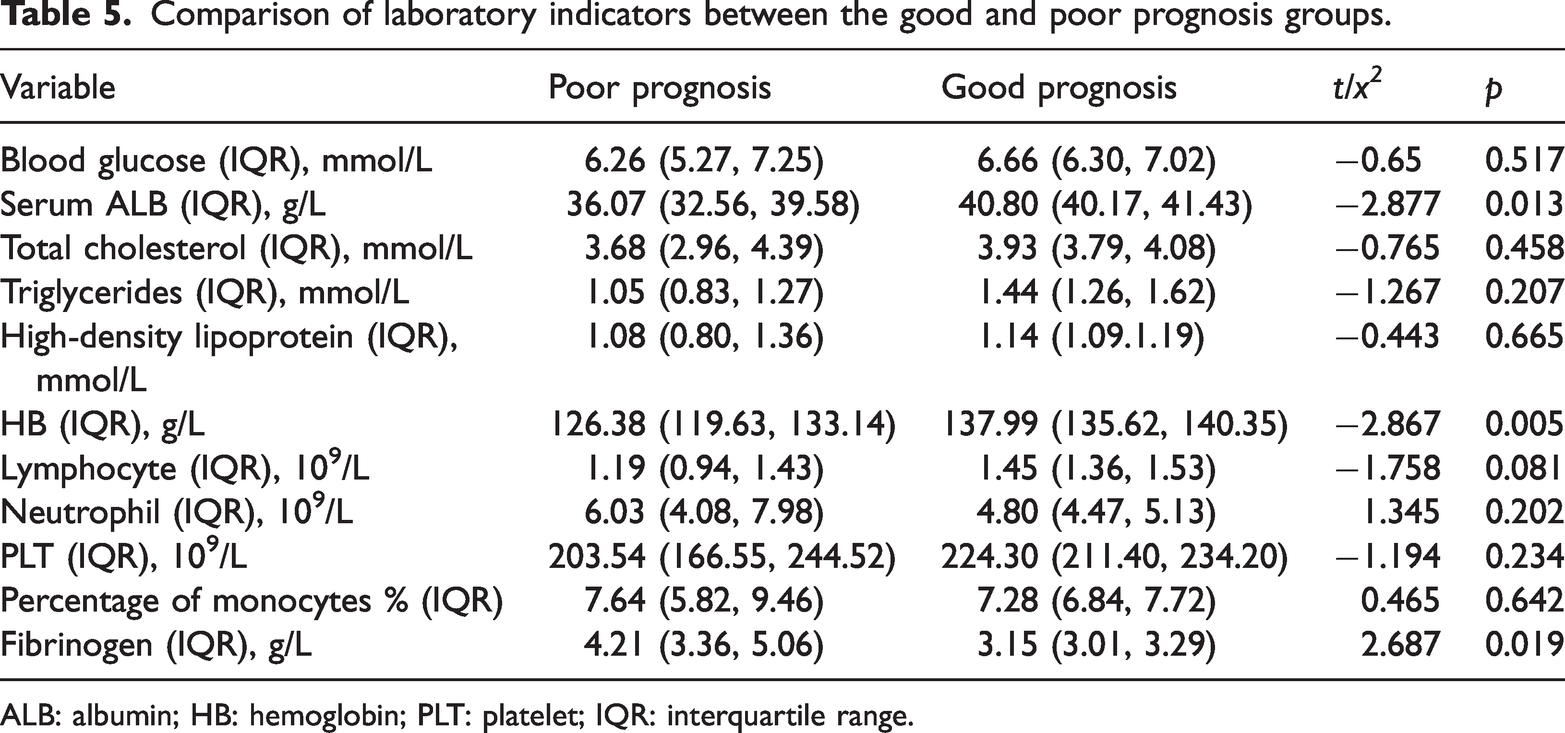
ALB: albumin; HB: hemoglobin; PLT: platelet; IQR: interquartile range.
Comparison of laboratory indicators between the recurrence and nonrecurrence groups.
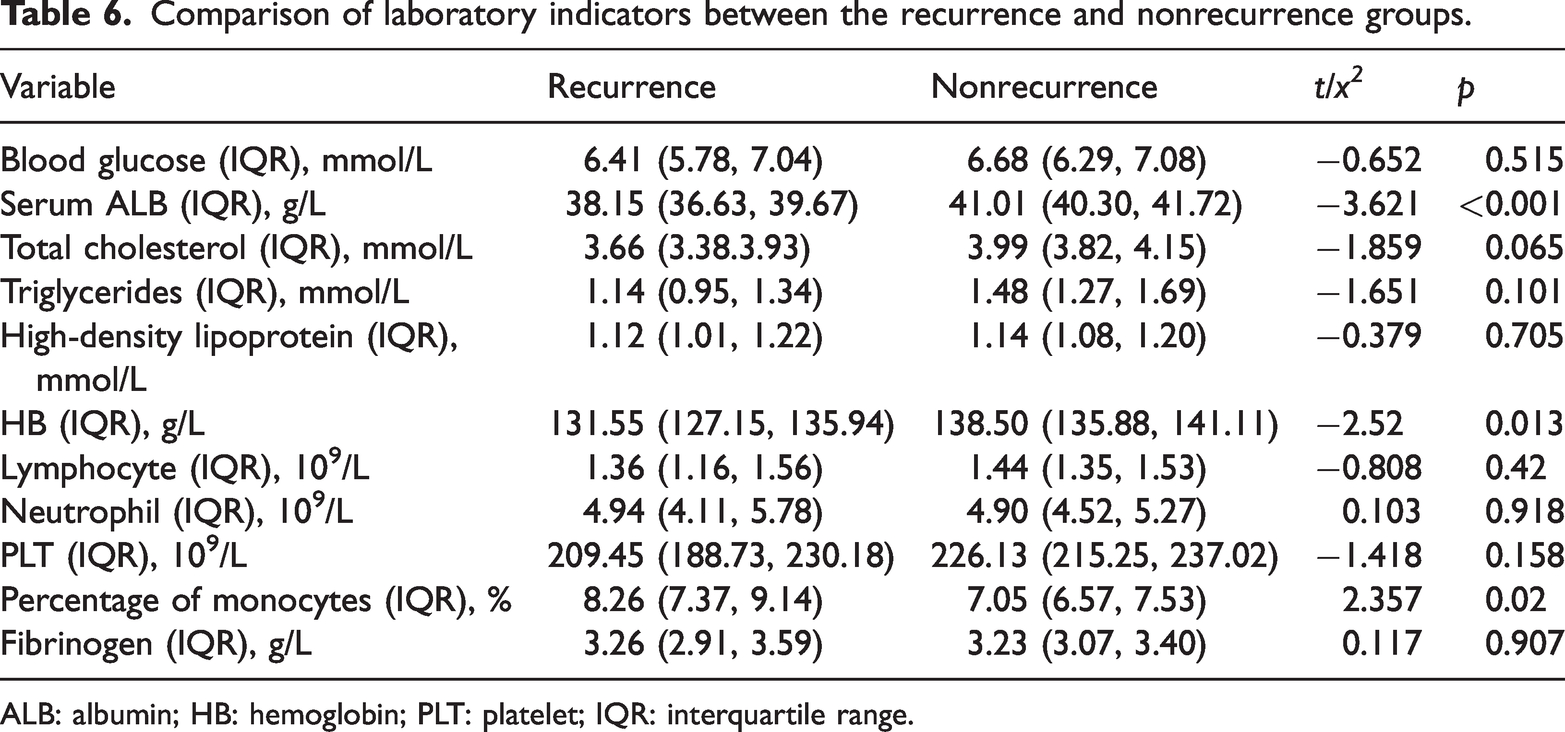
ALB: albumin; HB: hemoglobin; PLT: platelet; IQR: interquartile range.
Value of GNRI, PNI, and NRS 2002 in predicting the postoperative prognosis of CSDH
ROC analysis 28 showed that the area under the curve (AUC) of the GNRI for predicting postoperative prognosis of CSDH was 0.768 (95% confidence interval (CI): 0.637–0.899, p = 0.047). The maximum Youden’s index 29 was achieved at a GNRI cutoff value of 98.59, yielding a sensitivity of 79.3% and specificity of 69.2%. Regarding the PNI, the AUC was 0.762 (95% CI: 0.619–0.904, p = 0.002), with an optimal cutoff value of 42.93, corresponding to a sensitivity of 87.1% and specificity of 61.5%. The NRS 2002 yielded an AUC of 0.803 (95% CI: 0.687–0.920, p < 0.001) for predicting surgical prognosis, with a maximum Youden’s index achieved at a score of 2.5, demonstrating a sensitivity of 92.3% and specificity of 65.0%. Among the three indices, the GNRI demonstrated the highest specificity and lowest false-positive rate (Figure 1 and Table 7).
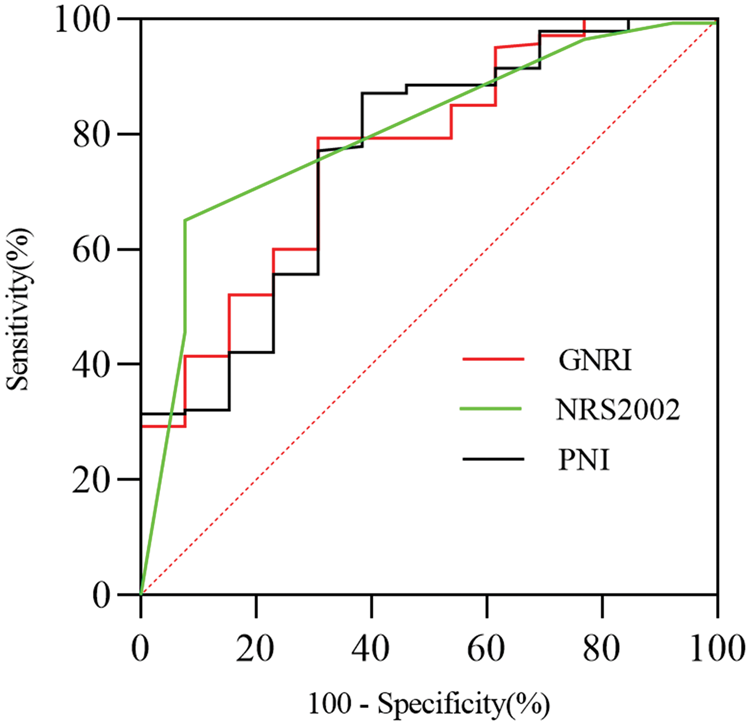
ROC curves for the GNRI, NRS 2002, PNI to predict postoperative prognosis of CSDH.
Comparison of sensitivity, specificity, false-positive rate, and false-negative rate among three nutritional risk screening methods for predicting prognosis.

GNRI: Geriatric Nutritional Risk Index; PNI: Prognostic Nutritional Index; NRS 2002: Nutritional Risk Screening 2002.
Multivariate analysis of poor prognosis after surgery for CSDH
Nutrition-related factors with a significance level of p < 0.1 in the univariate analysis of clinical information and laboratory tests, including age, ALB and HB levels, lymphocyte count, GNRI, PNI, and NRS 2002, were incorporated into a multivariate logistic regression analysis. After adjusting for age, ALB and HB levels, and lymphocyte count, the multivariate logistic regression analysis indicated that the GNRI (odds ratio (OR) = 1.141, 95% CI: 1.008–1.292), PNI (OR = 1.286, 95% CI: 1.001–1.651), and NRS 2002 (OR = 14.878, 95% CI: 1.766–125.349) were predictors of poor prognosis after surgery for CSDH (Tables 8 to 10).
Multivariate logistic regression analysis of the association between GNRI and prognosis.

ALB: albumin; HB: hemoglobin; GNRI: Geriatric Nutritional Risk Index; OR: odds ratio; CI: confidence interval; SE: standard error.
Multivariate logistic regression analysis of the association between NRS 2002 and prognosis.

ALB: albumin; HB: hemoglobin; NRS 2002: Nutritional Risk Screening 2002; OR: odds ratio; CI: confidence interval; SE: standard error.
Multivariate logistic regression analysis of the association between PNI and prognosis.

ALB: albumin; HB: hemoglobin; PNI: Prognostic Nutritional Index; OR: odds ratio; CI: confidence interval; SE: standard error.
Value of GNRI, PNI, and NRS 2002 in predicting postoperative recurrence of CSDH
ROC analysis indicated that the AUC of the GNRI for predicting postoperative recurrence of CSDH was 0.753 (95% CI: 0.659–0.847, p < 0.001). The maximum Youden’s index was achieved at a GNRI cutoff value of 100.05, resulting in a sensitivity of 75.8% and specificity of 69.7%. Regarding the PNI, the AUC was 0.666 (95% CI: 0.560–0.772, p = 0.001), with an optimal cutoff value of 44.41, corresponding to a sensitivity of 80.0% and specificity of 51.5%. The NRS 2002 yielded an AUC of 0.734 (95% CI: 0.636–0.832, p < 0.001) for predicting recurrence, with the highest Youden’s index achieved at a score of 2.5, showing a sensitivity of 78.8% and specificity of 70.8%. Among the three tools, the NRS 2002 exhibited the highest specificity and lowest false-positive rate (Figure 2 and Table 11).

ROC curve for the GNRI, NRS 2002, PNI to predict postoperative recurrence of CSDH.
Comparison of sensitivity, specificity, false-positive rate, and false-negative rate among three nutritional risk screening methods for predicting postoperative recurrence.

GNRI: Geriatric Nutritional Risk Index; PNI: Prognostic Nutritional Index; NRS 2002: Nutritional Risk Screening 2002.
Multivariate analysis of postoperative recurrence in CSDH
Nutrition-related factors with a significance level of p < 0.1 in the univariate analysis of clinical information and laboratory tests, including age, total cholesterol, BMI, ALB and HB levels, PNI, NRS 2002, and GNRI, were included in the multivariate logistic regression analysis. After adjusting for age, total cholesterol, BMI, and ALB and HB levels, the multivariate logistic regression analysis showed that the GNRI (OR = 0.167, 95% CI: 0.059–0.475), PNI (OR = 1.142, 95% CI: 1.024–1.275), and NRS 2002 (OR = 7.751, 95% CI: 2.672–22.485) were predictors of postoperative recurrence of CSDH (Tables 12 to 14).
Multivariate logistic regression analysis of the association between GNRI and recurrence.

BMI: body mass index; ALB: albumin; HB: hemoglobin; GNRI: Geriatric Nutritional Risk Index; OR: odds ratio; CI: confidence interval; SE: standard error.
Multivariate logistic regression analysis of the association between NRS 2002 and recurrence.

BMI: body mass index; ALB: albumin; HB: hemoglobin; NRS 2002: Nutritional Risk Screening 2002; OR: odds ratio; CI: confidence interval; SE: standard error.
Multivariate logistic regression analysis of the association between PNI and recurrence.

BMI: body mass index; ALB: albumin; HB: hemoglobin; PNI: Prognostic Nutritional Index; OR: odds ratio; CI: confidence interval; SE: standard error.
Discussion
CSDH is a common neurological condition. With progressive aging of the population, its current incidence ranges from 1.7 to 20.6 per 100,000 people and is increasing annually.1,30 As the hematoma expands and the disease progresses, clinical manifestations vary widely and may include nausea, vomiting, dizziness, headache, limb motor deficits, speech disturbances, seizures, impaired consciousness, and even death. For patients with severe symptoms, burr-hole drainage is currently the most frequently performed surgical intervention. 31 However, high recurrence rates, which can range from 5% to 30%, pose a significant clinical challenge. Recurrence often leads to prolonged hospitalization or readmission, increases the economic burden on patients, and is associated with poor clinical outcomes. Postoperative recurrence of CSDH is influenced by multiple factors, including patient characteristics, choice of anesthesia, surgical technique, and medication-related issues.32–34 Previous studies have demonstrated a strong correlation between nutritional status (and associated scores) and clinical outcomes across various neurosurgical conditions, including traumatic craniofacial injuries, gliomas,35,36 spinal surgery in older adults, and subarachnoid hemorrhage.37,38 Both CSDH and malnutrition are common clinical conditions among the older population. In a prospective study, Scerrati et al. 39 identified a correlation between malnutrition and poor postoperative prognosis in patients undergoing surgery for CSDH, as assessed through detailed micronutritional evaluation. Therefore, this study conducted a retrospective analysis of clinical data obtained from patients with CSDH at our hospital in recent years, aiming to investigate the risk factors for surgical prognosis and recurrence of CSDH and explore the association of the GNRI, PNI, and NRS 2002 with poor postoperative outcomes and recurrence in these patients.
Serum ALB level is commonly used in clinical practice as a laboratory indicator to assess patient nutritional status. In recent years, it has been recognized that serum ALB levels can serve as a predictor of postoperative complications and mortality following surgical procedures. 40 Malnutrition may exacerbate neuroinflammatory responses by inhibiting the expression of axonal terminal proteins, thereby impairing brain functional recovery. 41 This study confirmed that serum ALB levels were significantly lower in the recurrence group than in the nonrecurrence group. These findings suggest that lower serum ALB levels are associated with a higher nutritional risk and an increased rate of postoperative recurrence. Among 153 patients who underwent surgery for CSDH in this study, 33 (21.6%) experienced recurrence within 6 months. According to GNRI assessments, 42.4% of patients in the recurrence group and 15% in the nonrecurrence group were classified as malnourished. Well-nourished patients exhibited a lower recurrence rate than malnourished or at-risk patients. In the poor prognosis group, six patients (46.2%) exhibited nutritional risk, whereas only twenty-six patients (18.6%) in the good prognosis group exhibited nutritional risk. These differences were statistically significant, indicating that malnourished nutritional status is associated with a higher rate of poor prognosis.
The PNI is a nutritional indicator that reflects the body’s inflammatory and immune status. It is calculated using serum ALB levels and lymphocyte counts, both of which can be easily obtained from routine laboratory tests, making PNI a simple and practical tool. Inflammation plays a critical role in CSDH formation, and the PNI has been shown to possess prognostic value in several diseases. 23 HB, as the primary oxygen-carrying molecule in the body, has also been reported to have prognostic significance; elevated HB levels have been associated with improved outcomes in malignant tumors.42,43 Although the predictive value of the PNI and HB levels in recurrence and prognosis following CSDH has not been widely reported, our study revealed several significant findings. According to PNI-based nutritional assessment, malnutrition was identified in 51.5% of the patients in the recurrence group, compared with 22.5% in the nonrecurrence group, suggesting that malnourished patients are at higher risk of recurrence after CSDH surgery. Furthermore, nutritional risk was observed in 69.2% of patients in the poor prognosis group versus 25% in the good prognosis group, indicating that malnutrition is associated with a higher likelihood of poor postoperative outcomes. Additionally, HB levels were significantly lower in both recurrence and poor prognosis groups than in their respective control groups. This suggests that higher HB levels exert a protective effect against postoperative recurrence of CSDH.
Sensitivity and specificity are widely utilized for comparing diagnostic tests, assessing the validity of methods, and conducting clinical evaluations. The results of this study demonstrated that the GNRI, NRS 2002, and PNI exhibit high sensitivity in nutritional risk screening among patients hospitalized for surgical treatment of CSDH. In predicting postoperative prognosis, the GNRI showed the highest specificity (69.2%) and lowest false-positive rate (30.8%). In contrast, the PNI and NRS 2002 were associated with higher false-positive rates, indicating a greater likelihood of misdiagnosis in nutritional risk screening. Furthermore, the NRS 2002 yielded the largest AUC in the ROC analysis, suggesting a strong correlation between nutritional risk identified using the NRS 2002 and poor prognosis in CSDH patients. The NRS 2002 demonstrated the highest specificity (70.8%) among the three tools in predicting postoperative recurrence, while the PNI showed a high false-positive rate (48.5%), implying a considerable misdiagnosis rate. The GNRI achieved the largest AUC value in the ROC curve, supporting its utility in establishing a strong association between nutritional risk and recurrence in CSDH patients. Furthermore, multivariate analysis indicated that the GNRI, PNI, and NRS 2002 are independent predictors of both prognosis and recurrence.
Malnutrition represents a systemic state of frailty that compromises a patient’s fundamental physiological capacity to cope with disease and trauma, including surgery; it is more likely to affect older patients. 44 It is primarily characterized by diminished tissue repair and healing ability, impaired immune function accompanied with chronic inflammation, decreased plasma ALB levels that disrupt internal homeostasis and metabolic waste clearance, and reduced colloidal osmotic pressure leading to cerebral edema, which may impede postoperative brain re-expansion and hinder closure of the hematoma cavity.45,46 Through these mechanisms, malnutrition collectively contributes to an increased risk of hematoma recurrence and poorer overall prognosis in CSDH patients who have undergone surgery. The three nutritional risk screening scores (GNRI, PNI, and NRS 2002) can be obtained using admission clinical data and laboratory tests. These tools are suitable for routine nutritional risk screening in hospitalized patients; they help determine whether the nutritional status of a patient is adequate to tolerate surgery and provide a basis for nutritional support therapy. Those identified at nutritional risk warrant enhanced perioperative surveillance and systematic follow-up. Perioperative nutritional support (including protein supplementation or enteral feeding) should be considered in malnourished patients to improve outcomes and reduce recurrence. Further studies are needed to establish the effectiveness of tailored nutritional interventions in this population.
Limitations of the study
This study has several limitations, including a relatively small sample size, single-center design, and constraints inherent to a retrospective study. These factors may have introduced selection bias, made the conclusions vulnerable to extreme values, and led to an underestimation of risk among lost-to-follow-up cases. Additionally, the study did not assess other markers related to immune–nutritional status, such as C-reactive protein or globulin levels. Only a single assessment of the PNI, NRS 2002, and GNRI was conducted at admission, without tracking dynamic changes. This may have compromised accurate evaluation of their impact on outcomes. The relatively short follow-up period also restricts prognostic evaluation, hindering the assessment of long-term efficacy, determination of whether the observed positive outcomes persist over time, or evaluation of potential long-term recurrence risks. Furthermore, although objective assessment tools such as PNI and GNRI offer certain advantages in nutritional risk screening, they should be combined with subjective measures such as the NRS 2002 to comprehensively evaluate nutritional risk in patients with CSDH. The analysis of recurrence risk is limited by the omission of several pertinent pre- and postoperative radiographic factors, such as hematoma density and the extent of postoperative subdural air, which are potential predictors of recurrence. Additionally, the accurate assessment of nutritional status is inherently constrained by the retrospective study design; precise evaluation would require prospective cohort studies implementing standardized nutritional risk screening protocols. Therefore, future research should involve larger sample sizes, multicenter prospective designs, and long-term follow-ups to validate the findings of this study and further refine the methods and indicator system for nutritional risk screening in this patient population.
Conclusion
Admission GNRI, PNI, and NRS 2002 scores are closely associated with poor postoperative prognosis and recurrence in CSDH patients. This facilitates the early identification of nutritional risk in CSDH patients and enables subsequent implementation of personalized enteral or parenteral nutrition support protocols to reduce the rates of poor postoperative outcomes and recurrence.
Footnotes
Acknowledgements
We are deeply grateful to our colleagues for contributing to this thesis in various ways.
Authors’ contribution
Yu Tian: Conceived and designed the study, performed the analysis, wrote the manuscript, and verified the accuracy of the study.
Ling Li: Reviewed and provided final approval of the manuscript.
Shuang Sun, Hui Jiang, and Huisong Chu: Contributed to conceptual design of the study, edited the manuscript, collected and compiled the data, and provided final approval of the manuscript.
Data availability statement
The dataset presented in the study is available on request from the corresponding author during submission or after publication.
Declaration of conflicting interests
The authors declare that they have no competing interests.
Ethical approval
This study was approved by the Ethics Committee of the Affiliated Hospital of Chengde Medical University (NO.CYFYLL2023415).
Funding
This study was supported by the Medical Science Research Project of Hebei (NO:20242041).