
Abstract
Background:
The occurrence of adverse events after immunochemotherapy in patients with diffuse large B-cell lymphoma (DLBCL) frequently affects the course of chemotherapy, leading to a further decline in quality of life and survival.
Objectives:
The primary objective of this study was to investigate the association between Chinese visceral adiposity index (CVAI), lipid accumulation product (LAP) index and skeletal muscle mass index (SMI) at initial diagnosis and the risk of haematological toxicity following immunochemotherapy in patients with DLBCL.
Design:
Retrospective, single-centre study.
Methods:
CVAI, LAP and SMI were calculated by combining clinical data of the patients. This study included 213 patients, of whom 117 (55%) patients experienced grades 3–4 haematological toxicity after immunochemotherapy. Participants were divided into four groups (Q1, Q2, Q3, Q4) based on the quartiles of CVAI, LAP and SMI.
Results:
In the fully adjusted model, the risk of grades 3–4 haematological toxicity in group with the highest CVAI and LAP was reduced by 75.1% (OR: 0.249, 95% CI: 0.102–0.606, p = 0.002) and by 77.3% (OR: 0.227, 95% CI: 0.095–0.542, p = 0.001) compared to the group with the lowest CVAI and LAP. For SMI, the risk of grades 3–4 haematological toxicities in the group with the highest SMI was reduced by 62.9% compared with the lowest SMI group in the unadjusted model. The multivariable-adjusted restricted cubic spline curves and subgroup interaction analyses further confirmed the robustness of these findings.
Conclusion:
The results indicate that DLBCL patients with relatively high CVAI, LAP and SMI at initial diagnosis have a lower risk of severe haematological toxicity following chemotherapy. Therefore, CVAI, LAP and SMI at initial diagnosis are reliable and effective biomarkers for predicting severe haematological toxicity after immunochemotherapy in DLBCL patients.
Trial registration:
This is a retrospective study, and no registration on ClinicalTrials.gov.
Keywords
Introduction
Diffuse large B-cell lymphoma (DLBCL) is the most prevalent subtype of non-Hodgkin’s lymphoma. The first-line standard treatment for DLBCL is R-CHOP (anti-CD20 monoclonal antibody in combination with cyclophosphamide, doxorubicin, vincristine and prednisone). This regimen has been shown to achieve a 5-year survival in 60%–70% of patients. 1 However, the occurrence of adverse events after immunochemotherapy often results in dose reductions, treatment delays or discontinuation of chemotherapy, which can lead to prolonged hospitalization, and a further decline in patients’ the quality of life and survival. 2 The toxicities associated with the administration of chemotherapeutic agents include haematological toxicities (anaemia, leucopenia, neutropenia, thrombocytopenia) and non-haematological toxicities (neurotoxicity, gastrointestinal toxicity, hepatotoxicity, nephrotoxicity, cardiotoxicity). 3 Identifying indicators related to the occurrence of these toxicities after immunochemotherapy is critical for improving patient outcomes.
It is well established that the vast majority of chemotherapeutic agents currently in use are administered based on body surface area (BSA). 2 This method assumes that all patients with the same BSA exhibit similar pharmacokinetics. However, as early as 2008, the study demonstrated that patients with identical BSA or body mass index (BMI) can differ significantly in the amount and distribution of adipose and skeletal muscle tissue. 4 The distribution of adipose and skeletal muscle tissue can be measured by dual-energy X-ray absorptiometry (DXA), bioelectrical impedance analyses, computed tomography (CT) or magnetic resonance imaging (MRI). However, processing these image methods is in a clinical setting can be challenging. To facilitate a quicker assessment of adipose and skeletal muscle tissue distribution, several indicators have been developed based on gender, age, waist circumference (WC), height, weight and blood lipid levels. These indicators include the Chinese visceral adiposity index (CVAI), 5 lipid accumulation product (LAP), 6 skeletal muscle mass index (SMI), 7 a body shape index, body roundness index and conicity index. CVAI and LAP, respectively, reflect the visceral adipose content 8 and the degree of abdominal lipid accumulation, respectively. 6 SMI serves as a diagnostic criteriion for sarcopenia 7 and is also used in the assessment of cachexia, 9 reflecting the weight and function of muscles throughout the body. These indicators can predict the occurrence of metabolic syndrome 10 and cardiovascular events11,12 in the older adults and are also closely related to diabetes occurrence and outcomes.13,14 As the limitations of BSA as the sole metric for dose calculation have become increasingly apparent,15,16 there is growing interest in the role of body composition-particularly adipose and skeletal muscle-in oncology. Previous studies have shown that variations in adipose and skeletal muscle composition are closely linked to the tumour prognosis, chemotherapy efficacy and associated toxicities.17–19 However, the nature of the correlations between these factors remains unclear.20,21
Previous studies in DLBCL have predominantly focused on lower adipose and skeletal muscle tissue as adverse outcomes and prognosis factors, correlating with increased treatment-related adverse events.22–24 This association may stem from lower levels of adiposity and skeletal muscle tissue indicating poorer nutritional status and muscle strength, which can negatively impact a patient’s physical resilience following chemotherapy and subsequently affect prognosis. However, no study has yet investigated the association of CVAI, LAP and SMI, which are calculated by sex, age, WC, height, weight and blood lipid levels, with the occurrence of haematological toxicity after immunochemotherapy in DLBCL patients. This retrospective study aims to collect clinical data from patients with DLBCL to explore the association of CVAI, LAP and SMI with the risk of haematological toxicity following immunochemotherapy. Additionally, it will analyse the relationship of these indices with several common haematological adverse events.The findings are expected to provide an evidence-based fountdation for developing strategies to reduce immunochemotherapy-related toxicities and improve patient survival rates.
Material and methods
Patients
A retrospective study was conducted on patients with newly diagnosed DLBCL who received R-CHOP therapy – rituximab combined with anthracyclines (doxorubicin, pirarubicin, epirubicin), alkaloids (vinorelbine, vincristine), cyclophosphamide and prednisone – at the Second Affiliated Hospital of Nanchang University between July 2017 and November 2023. All patients completed four cycles of immunochemotherapy. Patients who met one of the following criteria were excluded:
(1) Lack of clinical data such as blood lipid and imaging at the initial diagnosis;
(2) Central nervous system invasion;
(3) Eastern Cooperative Oncology Group (ECOG) score > Grade 2;
(4) Grade 5 adverse events (death);
(5) Combination with pre-existing serious and irreversible liver and kidney diseases at the initial diagnosis;
(6) Second primary tumour and HIV infection at the initial diagnosis.
Finally, 213 patients were included in the study and their medical records were reviewed.
Toxicity grading and follow-up
The toxicity was defined as the occurrence of at least one of the most severe post-immunochemotherapy toxicities, based on the clinical data of the included patients within four cycles of standard immunochemotherapy. The haematological toxicity defined by at least one episode of the most severe immunochemotherapy-related toxicities. Various toxicities were classified according to the National Cancer Institute Common Toxicity Criteria for Adverse Events (NCI-CTCAE) (Version 5.0). The haematological toxicities included in this study were anaemia, leucopenia, neutropenia and thrombocytopenia.
Body composition index
Abdominal cross-sectional imaging of CT at initial diagnosis was processed using ImageJ software 1.48v (National Institutes of Health Image program) to obtain WC data of the study subjects (Figure 1). The following indexes were calculated by gender, age, WC, height, weight and blood lipid. The calculation formula is as follows:


Abdominal cross-sectional imaging of CT at initial diagnosis were processed using ImageJ software. (a) and (b) are CT planes and selections for waist circumference measurement in abdominal CT of one patient. ① and ② define line lengths based on the ruler in the image. ③ Outline the range of waist circumference. 88.009 in ④ is the length of waist circumference. (c) and (d) are the waist circumference measurement procedures of another patient, where 77.612 is the waist circumference length of this patient.
Statistical analysis
Our study aimed to examine 9–11 variables potentially associated with the occurrence of severe haematological toxicity following chemotherapy in patients with DLBCL. Based on the principle recommended by Peduzzi et al., at least 10 events per predictor variable are needed to achieve reliable regression estimates and avoid overfitting.25,26 Accordingly, a minimum sample size of approximately 90–110 cases with severe hematological toxicity was required. In our study, 117 patients experienced severe hematological toxicity post-chemotherapy, which meets the minimum sample size requirement for a robust analysis of the selected variables. Statistical analyses were performed using SPSS software version 27.0 (SPSS, Inc., Chicago, IL, USA) and R statistical software version 4.2.2 (R Foundation for Statistical Computing, Vienna, Austria). The ‘rms’ package was employed to complete restricted cubic splines (RCSs). For data that exhibited a normal distribution, results are presented as mean ± standard deviation (SD). For data that did not exhibit a normal distribution, the median and interquartile range (IQR) was used, while percentages described the categorical variables. Continuous variables conforming to a normal distribution were reported as means ± SDs, while those not normally distributed were expressed as medians and IQRs. The chi-square test, rank-sum test and t test were employed to calculate p values for categorical variables, continuous variables without normal distribution and continuous variables with normal distribution, respectively. All participants were classified into four groups according to quartiles (Q1–Q4) of CVAI, LAP and SMI. A logistic regression model was employed to estimate the odds ratio (OR) and 95% confidence interval (95% CI) for haematological toxicity, using CVAI, LAP and SMI as both categorical variables (quartiles) and continuous variables (SD increase), respectively.
To evaluate the OR and 95% CI of the occurrence of haematological toxicities in relation to CVAI, LAP and SMI as continuous (per SD increment) or categorical (quartiles) variables, three logistic regression models were implemented. Model 1 depicted the crude associations between CVAI, LAP, SMI and the occurrence of haematological toxicities. Model 2 incorporated further adjustments for age, gender, Ann Arbor stage and International Prognostic Index (IPI) score; Model 3 encompassed adjustments from Model 2, along with additional factors such as extranodal involvement, lactate dehydrogenase (LDH), anthracyclines 27 and alkaloids. An adjusted RCS analysis was undertaken to investigate potential linear associations and illustrate dose–response relationships between CVAI, LAP, SMI and haematological toxicities. This analysis incorporated three knots at the 10th, 50th and 90th percentiles of CVAI, LAP and SMI. Finally, subgroup and interaction analyses to assess the modulation of demographic characteristics and disease stage. These analyses were based on gender, age (<60 years old or ⩾60 years old), Ann Arbor stage (I/II or III/IV), IPI score (0–2 or 3–5), extranodal involvement (0–1 or ⩾2) and LDH (<250 or ⩾250). A p value of less than 0.05 was considered statistically significant. The reporting of this study conforms to the STROBE statement. 28
Results
Baseline characteristics of participants with/without grades 3–4 haematological toxicity
The baseline characteristics of the study population are presented based on the presence or absence of grades 3–4 haematological toxicity (Table 1). A total of 213 participants were enrolled in the study with a median age of 60 years. Of those, 106 were male (49.8%), and 107 were female (50.2%). Among the participants, 117 (55%) experienced grades 3–4 haematological toxicity, while the remaining 96 (45%) did not. The results indicated significant differences in gender, LDH levels and BMI. Notably, patients with DLBCL who exhibited decreasing baseline levels of CVAI, LAP and SMI were found to have an increased risk of developing grades 3–4 haematological toxicity.
Baseline characteristics of participants with/without grades 3–4 haematological toxicity.
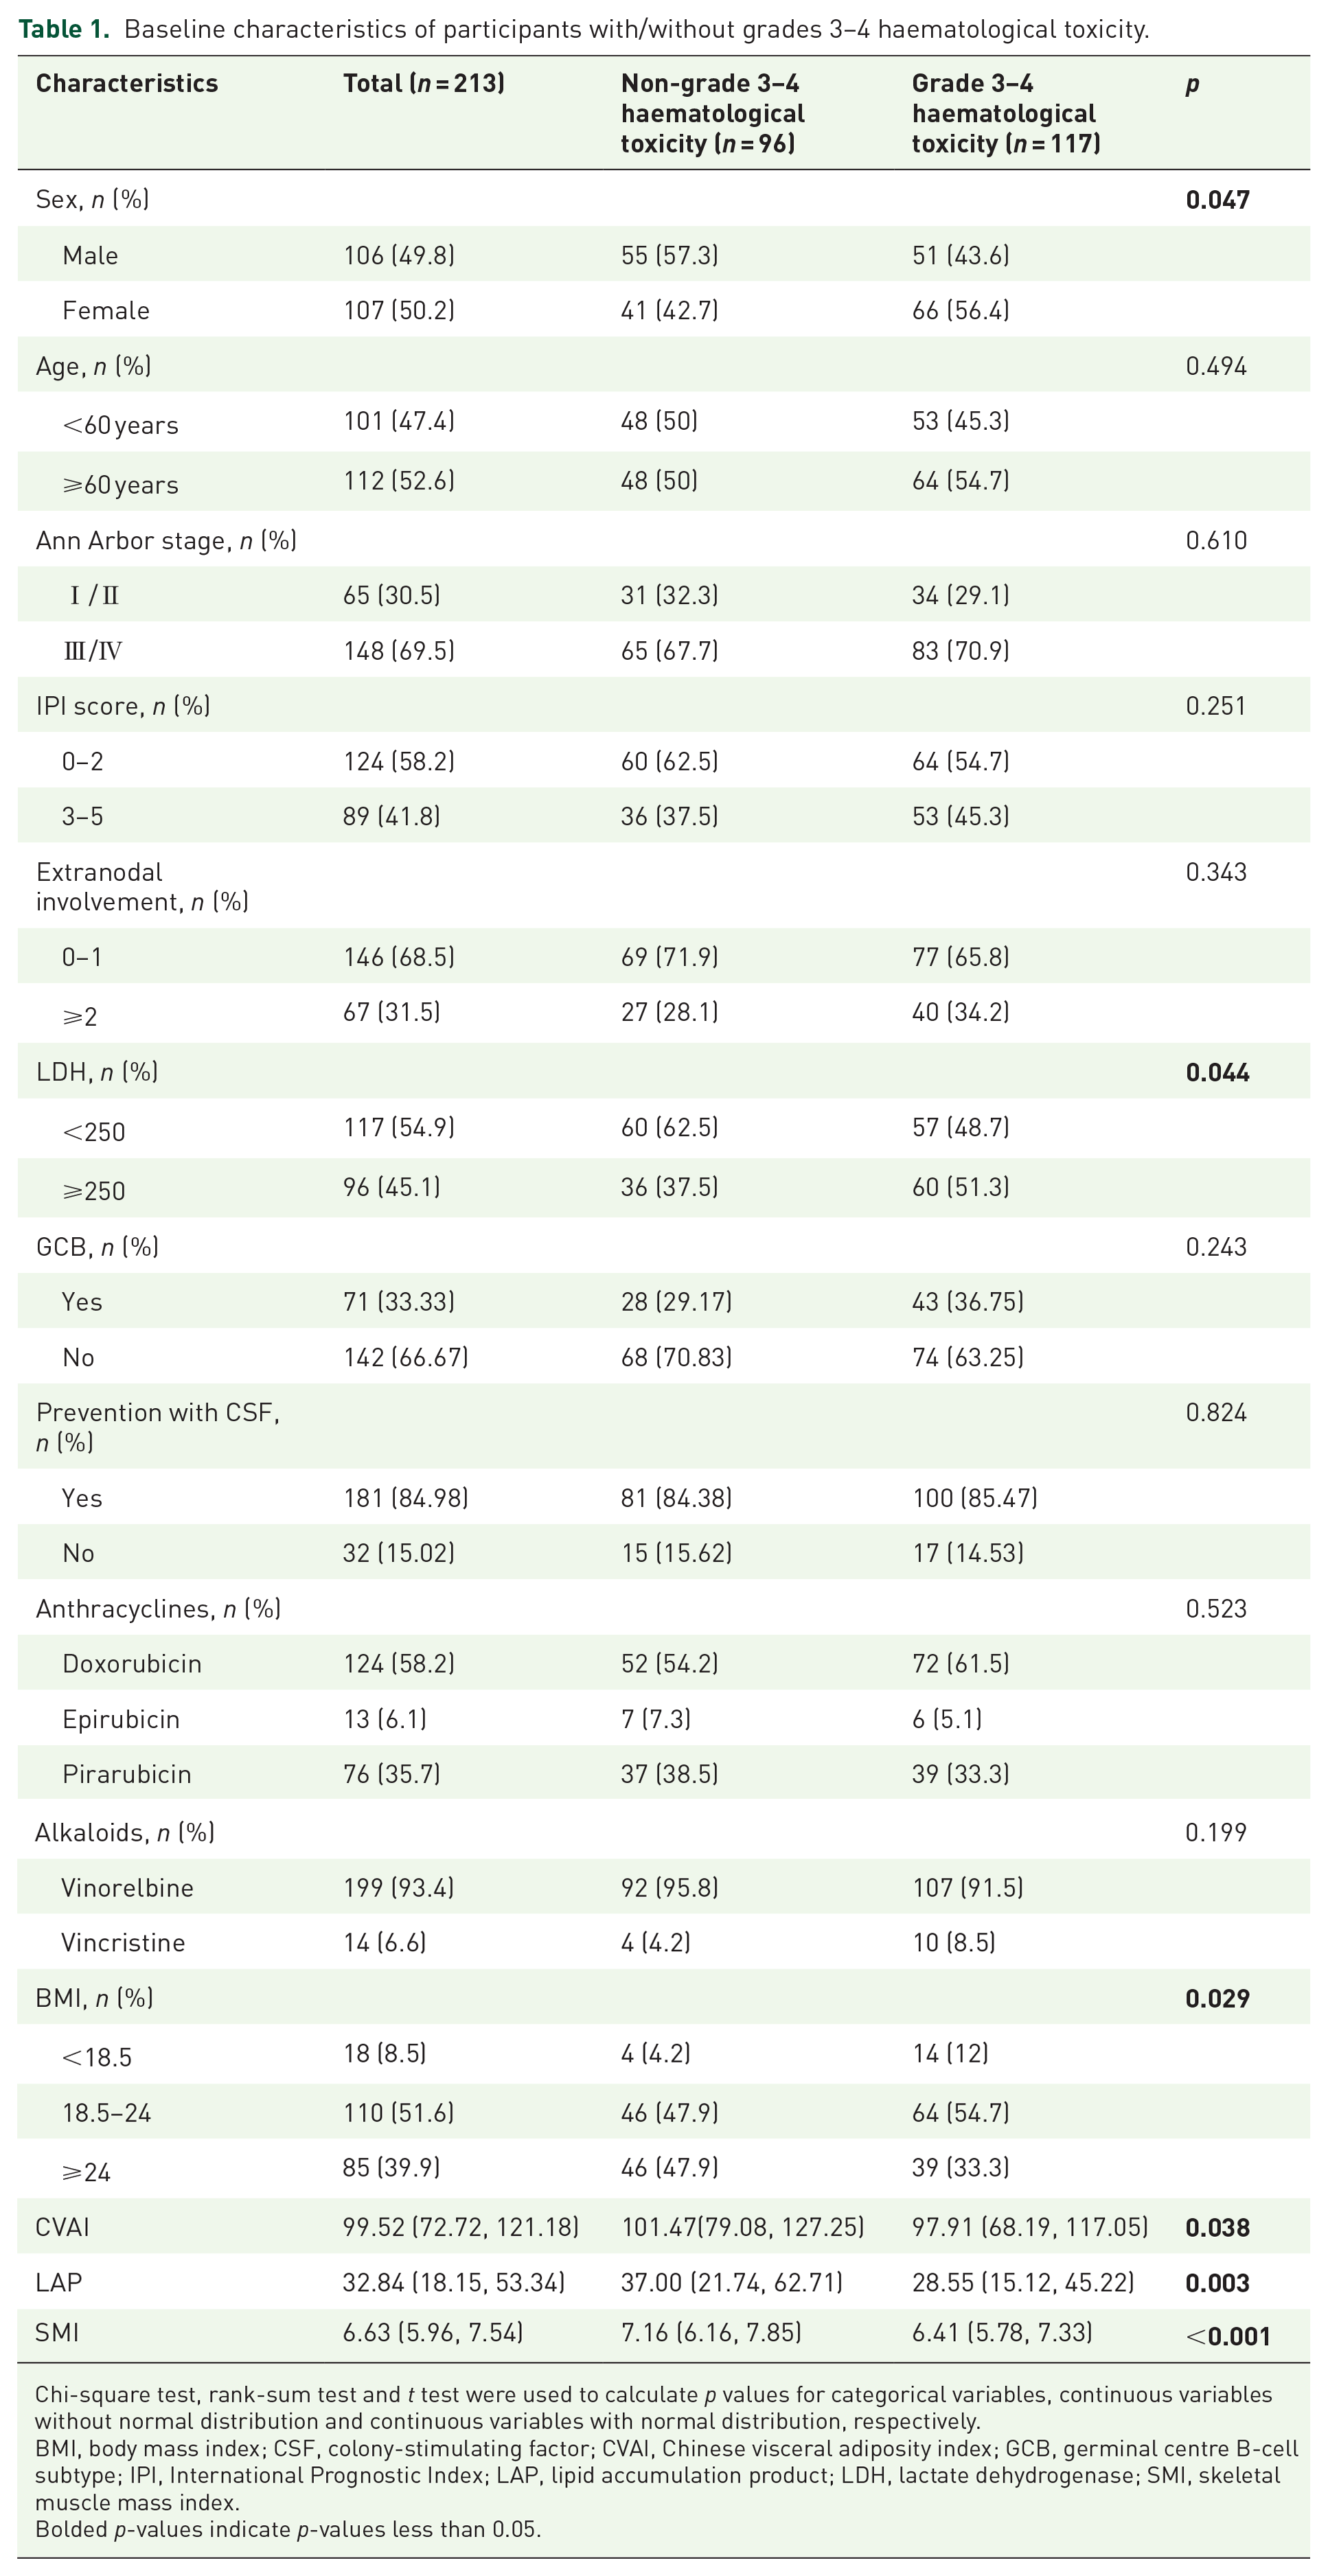
Chi-square test, rank-sum test and t test were used to calculate p values for categorical variables, continuous variables without normal distribution and continuous variables with normal distribution, respectively.
BMI, body mass index; CSF, colony-stimulating factor; CVAI, Chinese visceral adiposity index; GCB, germinal centre B-cell subtype; IPI, International Prognostic Index; LAP, lipid accumulation product; LDH, lactate dehydrogenase; SMI, skeletal muscle mass index.
Bolded p-values indicate p-values less than 0.05.
Distribution of CVAI, LAP and SMI in various haematological toxicities
Figure 2 shows the distribution of CVAI, LAP and SMI across various haematological toxicities. When analysed as a continuous variable, there was a significant difference in the distribution of CVAI between groups with and without severe haematological toxicity (p < 0.05; Figure 2(a)).The distribution of LAP also showed significant differences in the presence or absence of severe haematological toxicity (p < 0.01), as well as in cases of anaemia (p < 0.01), and leucopenia (p < 0.05; Figure 2(b)). As can be seen in Figure 2(c), the difference in the distribution of SMI was statistically significant in the presence or absence of severe haematological toxicity (p < 0.001), anaemia (p < 0.001), leucopenia (p < 0.05) and neutropenia (p < 0.01). It shows a preliminary correlation between CVAI, LAP and SMI at the time of initial diagnosis and severe haematological toxicity after chemotherapy.

Distribution of CVAI (a), LAP (b) and SMI (c) in the occurrence of whether or not serious haematological toxicities.
Association between CVAI, LAP, SMI and grades 3–4 haematological toxicity
To further explore the association between CVAI, LAP and SMI, and grades 3–4 haematological toxicities, all participants were classified into four groups according to quartiles (Q1–Q4) of CVAI, LAP and SMI. In CVAI, Q1 is CVAI ⩽ 72.72; Q2 is CVAI > 72.72, but ⩽99.52; Q3 is CVAI > 99.52, but ⩽121.18; Q4 is CVAI > 121.18. In LAP, Q1 is LAP ⩽ 18.15; Q2 is LAP > 18.15, but ⩽32.84; Q3 is LAP > 32.84, but ⩽53.34; Q4 is LAP > 53.34. In SMI, Q1 is SMI ⩽ 5.96; Q2 is SMI > 5.96, but ⩽6.63; Q3 is SMI > 6.63, but ⩽7.54; Q4 is SMI > 7.54. Table 2 highlights the correlation between grades 3–4 haematological toxicity and the quartiles of CVAI, LAP and SMI. The analysis showed a significant reduction in the risk of grades 3–4 haematological toxicity with higher quartiles of CVAI and LAP, even after adjusting for confounding factors such as age, gender, Ann Arbor stage, IPI score, extranodal involvement, LDH levels, anthracyclines and alkaloids. Specifically, the risk of grades 3–4 haematological toxicity in Q4 of CVAI and LAP was reduced by 75.1% (OR: 0.249, 95% CI: 0.102–0.606, p = 0.002) and 77.3% (OR: 0.227, 95% CI: 0.095–0.542, p = 0.001) compared with Q1. Furthermore, each SD increase in CVAI reduced the risk by 42.6% (OR: 0.574, 95% CI: 0.412–0.800) in the fully adjusted model (Model 3), and each SD increase in LAP reduced the risk by 50.7% (OR: 0.493, 95% CI: 0.345–0.705). For SMI, the risk reduction in Q4 compared to Q1 was 62.9% (OR: 0.371, 95% CI: 0.170–0.811) with p for trend of 0.007. This association weakened after adjusting for confounders. When assessed as a continuous variable, the risk reduction per SD increase in SMI was 61.8% in Model 3 (OR: 0.382, 95% CI: 0.221–0.658). Additionally, multivariable-adjusted RCS demonstrated a significant dose–response relationship between CVAI, LAP, SMI and grades 3–4 haematological toxicity, with p values for overall significance at 0.004 and 0.002 for CVAI and SMI, respectively, and less than 0.001 for LAP, while the p values for non-linearity were 0.576 for CVAI, 0.855 for LAP and 0.522 for SMI (a, b, c in Figure 3).
The associations between CVAI, LAP, SMI and grades 3–4 haematological toxicity.
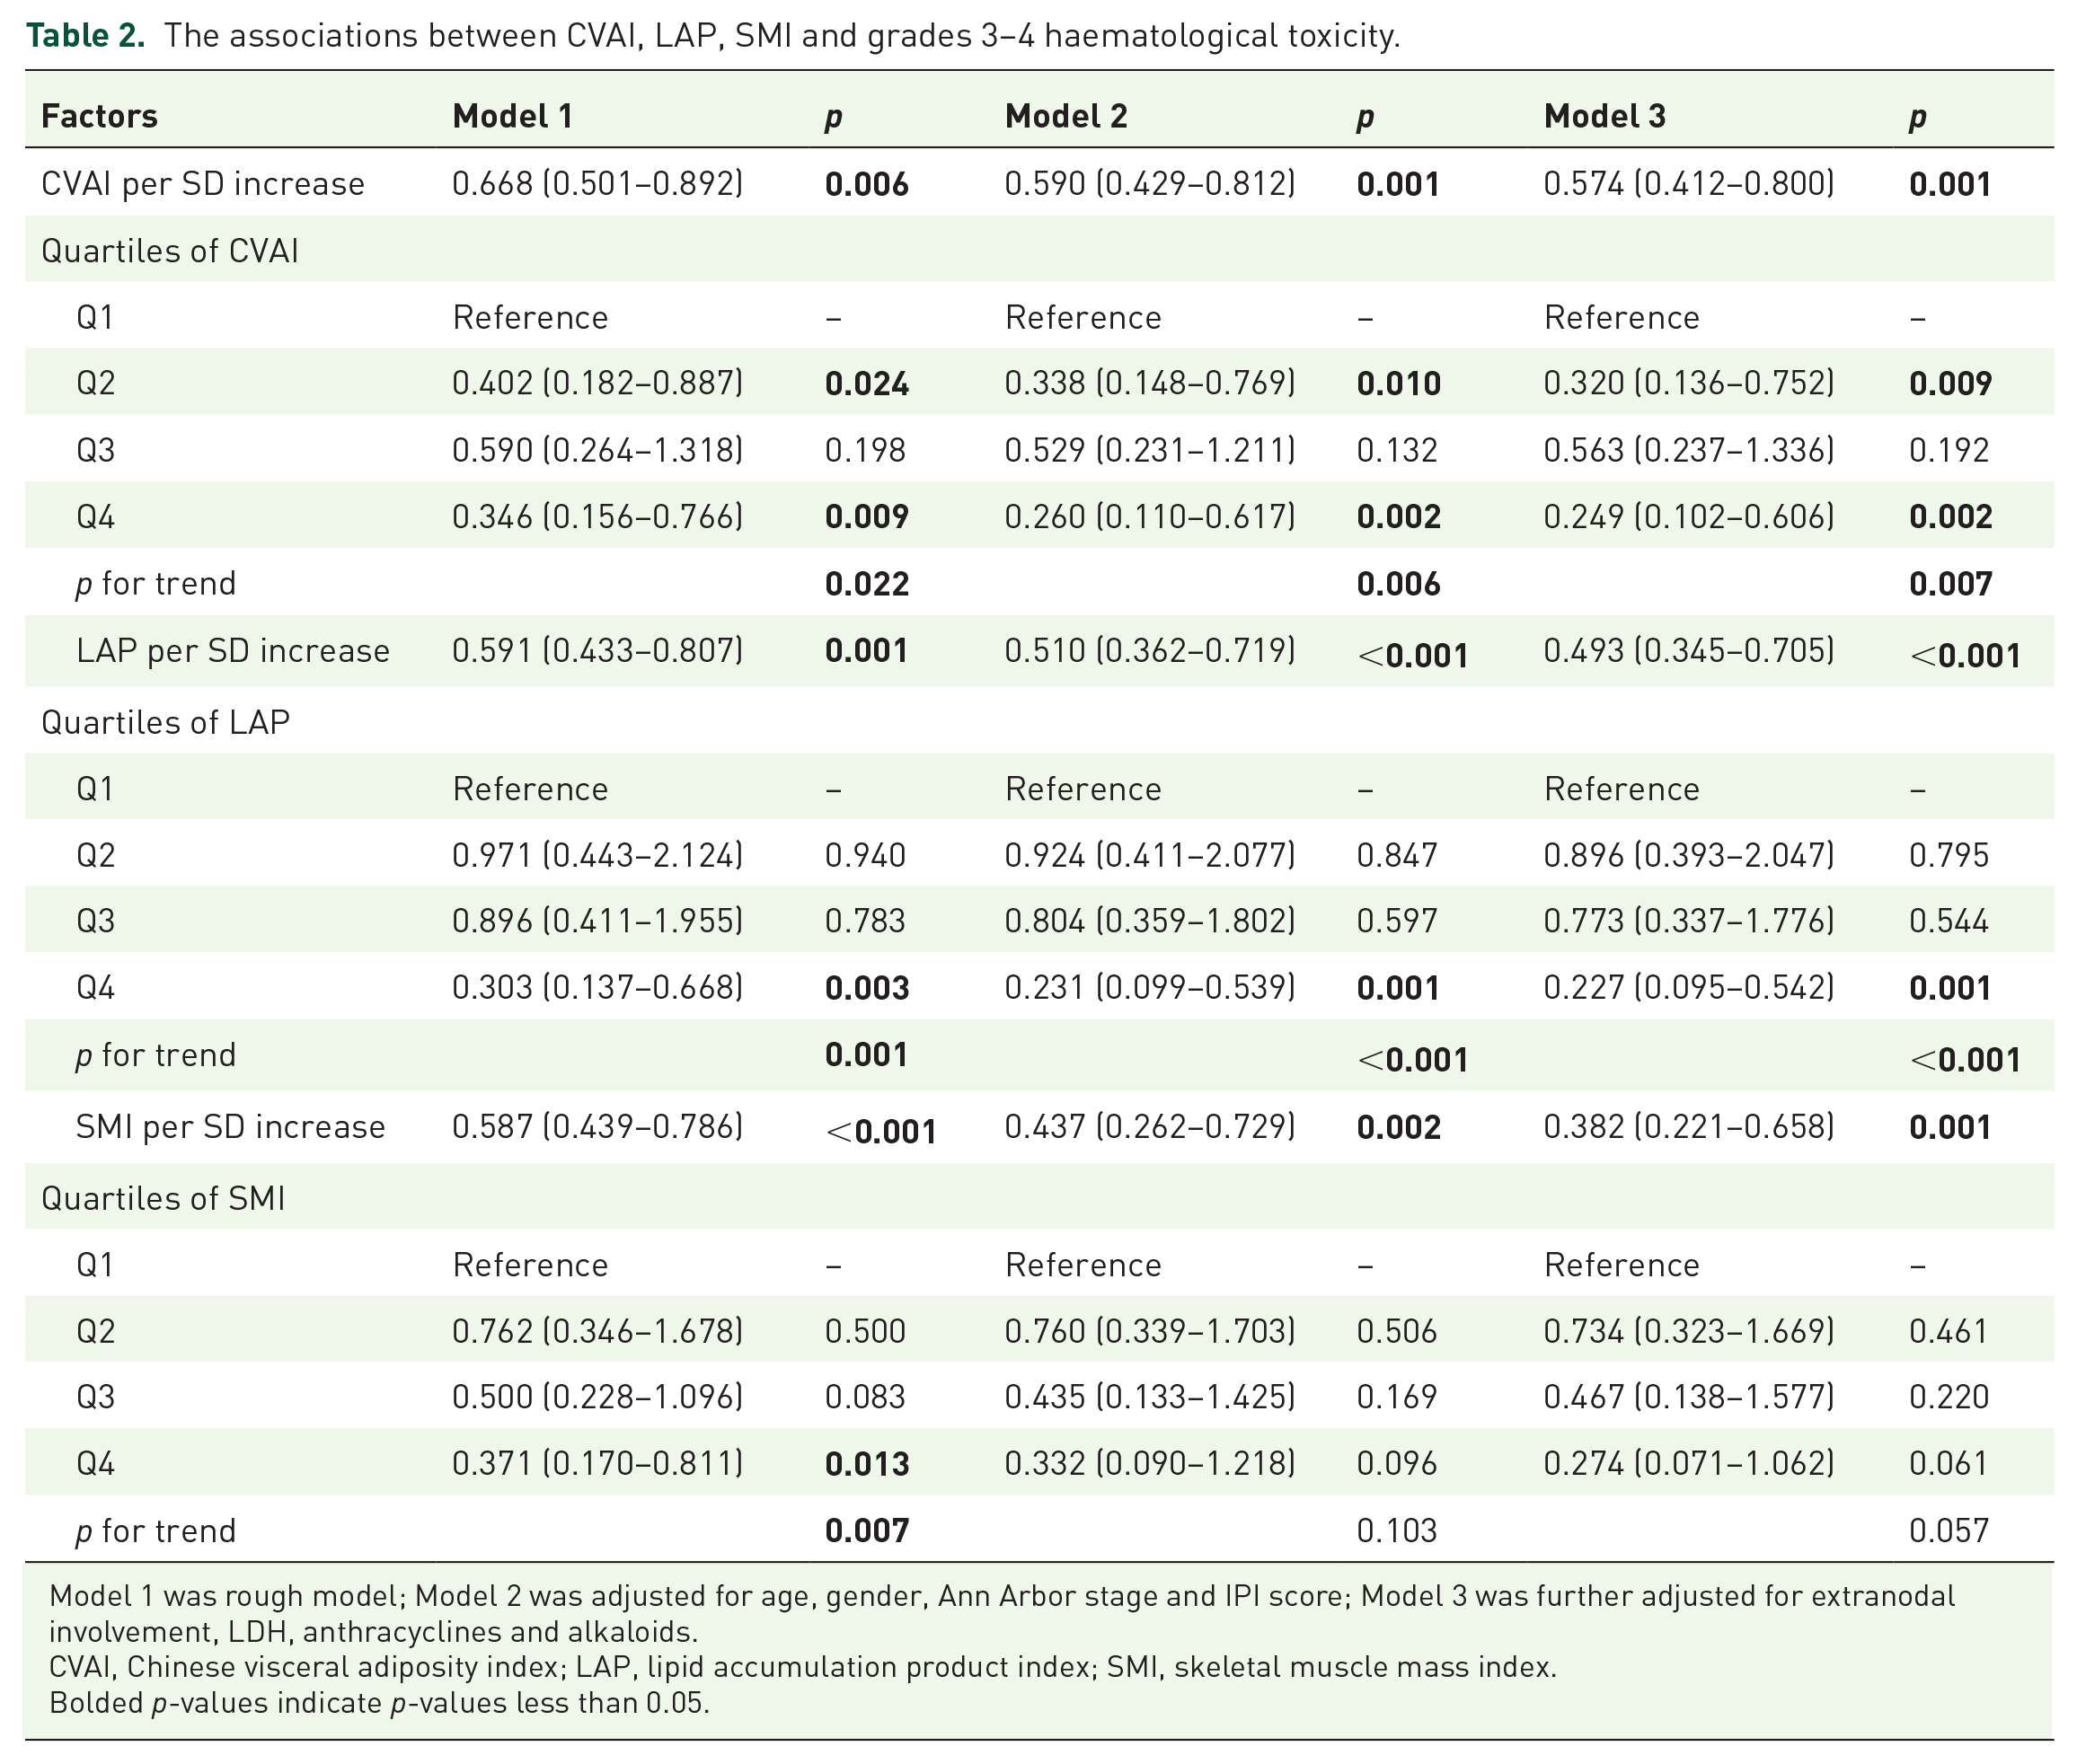
Model 1 was rough model; Model 2 was adjusted for age, gender, Ann Arbor stage and IPI score; Model 3 was further adjusted for extranodal involvement, LDH, anthracyclines and alkaloids.
CVAI, Chinese visceral adiposity index; LAP, lipid accumulation product index; SMI, skeletal muscle mass index.
Bolded p-values indicate p-values less than 0.05.

Restricted cubic spline curves for grade 3–4 haematological toxicity (a–c) and grade 3–4 anaemia(d–f) by CVAI, LAP and SMI after covariate adjustment. Heavy central line represents the estimated adjusted hazard ratio, with shaded ribbons denoting 95% confidence interval. The model is adjusted for age, gender, Ann Arbor stage, IPI score, extranodal involvement, LDH, anthracyclines and alkaloids.
Association between CVAI, LAP, SMI and grades 3–4 anaemia
In the fully adjusted Model 3, higher quartiles of CVAI, LAP and SMI were associated with significantly reduced risks of grades 3–4 anaemia in Q4, by 71.2%, 78.7% and 91.8%, respectively (CVAI: p for trend = 0.012, OR: 0.288, 95% CI: 0.110–0.758; LAP: p for trend = 0.002, OR: 0.213, 95% CI: 0.080–0.569; SMI: p for trend = 0.001, OR: 0.082, 95% CI: 0.018–0.381), as depicted in Table 3. Furthermore, when analysed as a continuous variable, each 1.0-SD increase in CVAI, LAP and SMI reduced the risk of grades 3–4 anaemia by 37.6% (OR: 0.624, 95% CI: 0.441–0.882), 45.5% (OR: 0.546, 95% CI: 0.366–0.815) and 65.7% (OR: 0.343, 95% CI: 0.192–0.612), respectively.The dose–response relationships, illustrated in panels Figure 3(d) to (f), show that these associations are linear, with CVAI, LAP and SMI each showing significant overall p values of 0.017, 0.008 and 0.001, respectively, and nonlinearity p values of 0.150, 0.583 and 0.380.
The associations between CVAI, LAP, SMI and grades 3–4 anaemia.
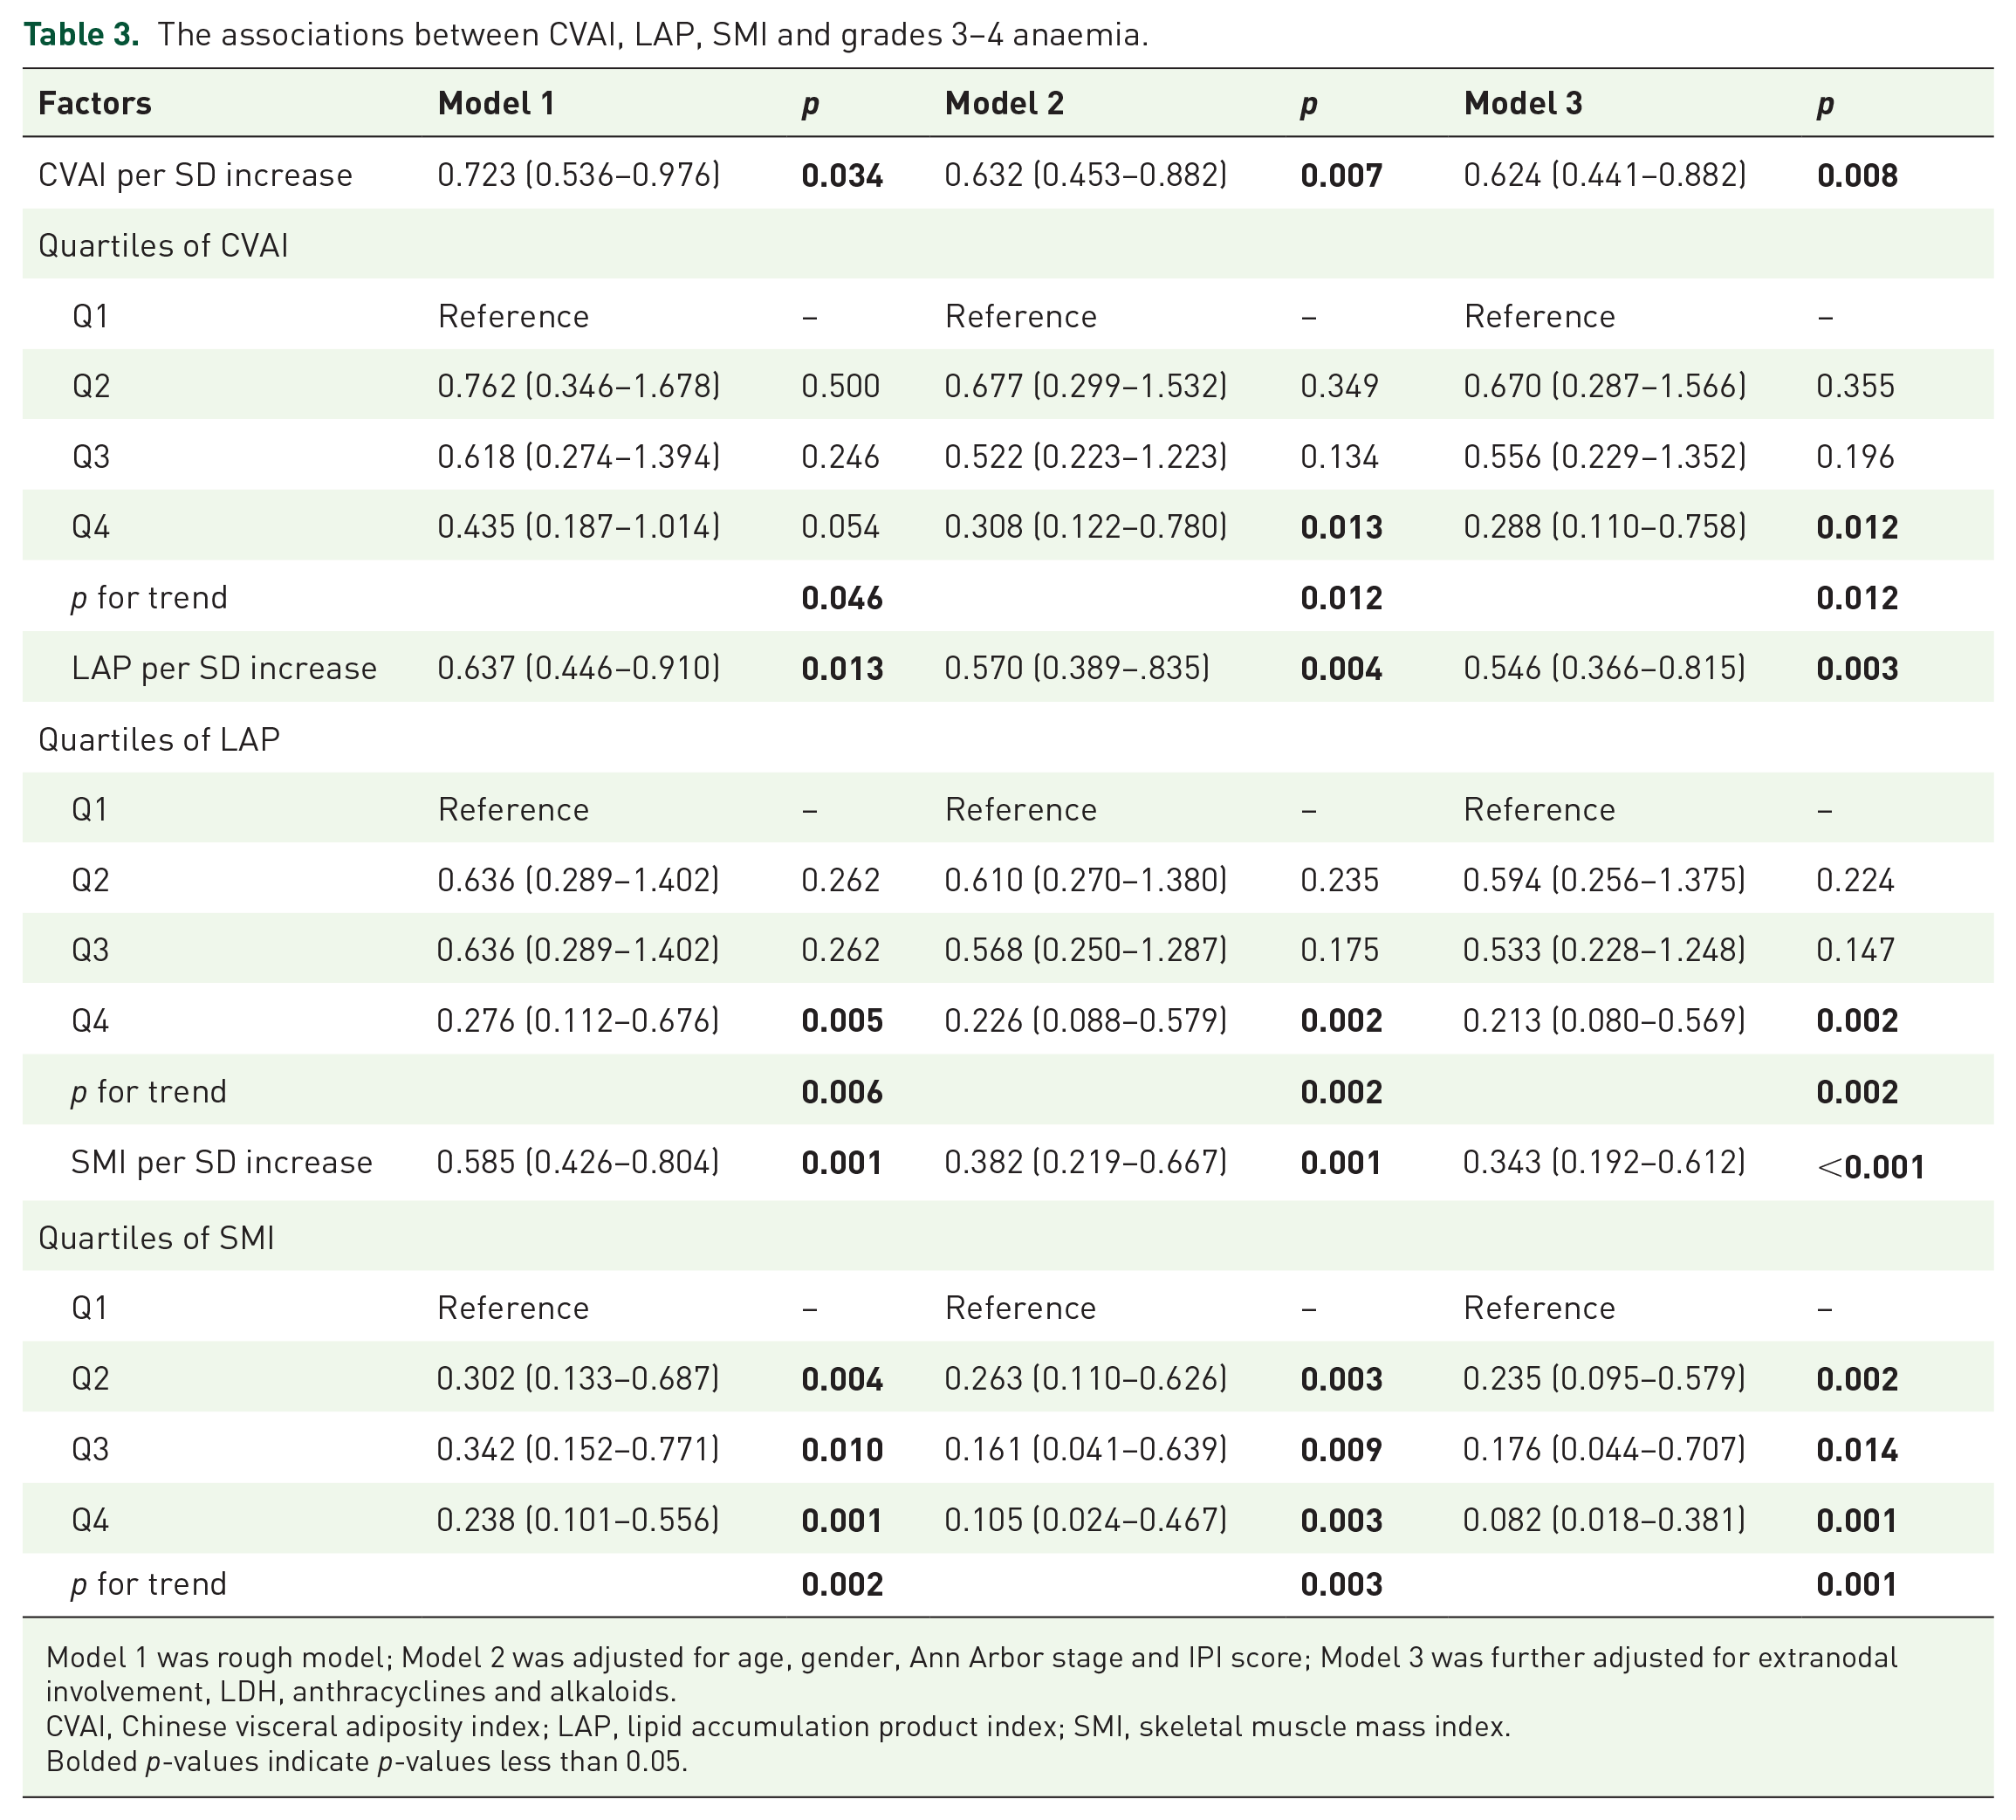
Model 1 was rough model; Model 2 was adjusted for age, gender, Ann Arbor stage and IPI score; Model 3 was further adjusted for extranodal involvement, LDH, anthracyclines and alkaloids.
CVAI, Chinese visceral adiposity index; LAP, lipid accumulation product index; SMI, skeletal muscle mass index.
Bolded p-values indicate p-values less than 0.05.
Association between CVAI, LAP, SMI and grades 3–4 leucopenia
In Model 3 (the fully adjusted model), higher quartiles of LAP were associated with a significantly reduced risk of grades 3–4 leucopenia (Table 4). Compared to Q1, Q4 exhibited the most pronounced protective effect against grades 3–4 leucopenia (p for trend = 0.012, OR: 0.383, 95% CI: 0.153–0.960). Although not statistically significant, a similar trend was observed for CVAI and SMI in relation to grades 3–4 leucopenia. Furthermore, when assessed as continuous variables, a 1.0-SD increase in LAP was associated with a 40.2% decreased risk of grades 3–4 leucopenia (OR: 0.598, 95% CI: 0.415–0.860), while a 1.0-SD increase in SMI was associated with a 42.8% decreased risk (OR: 0.572, 95% CI: 0.340–0.962). However, the association between CVAI and grade 3–4 leucopenia was not statistically significant. Multivariable-adjusted RCS revealed a significant dose–response relationship between LAP and grades 3–4 haematological toxicity (p overall = 0.024, p for nonlinear = 0.284; Supplemental Figure S1).
The associations between CVAI, LAP, SMI and grade 3–4 leucopenia.

Model 1 was the rough model; Model 2 was adjusted for age, gender, Ann Arbor stage and IPI score; Model 3 was further adjusted for extranodal involvement, LDH, anthracyclines and alkaloids.
CVAI, Chinese visceral adiposity index; LAP, lipid accumulation product index; SMI, skeletal muscle mass index.
Bolded p-values indicate p-values less than 0.05.
Association between CVAI, LAP, SMI and grade 3–4 neutropenia
Table 5 presents the correlation between grade 3–4 neutropenia occurrence and quartiles of CVAI, LAP and SMI. After adjusting for confounders like age, gender, Ann Arbor stage, IPI score, extranodal involvement, LDH, anthracyclines and alkaloids, elevated LAP and SMI quartiles were associated with a significantly reduced risk of grade 3–4 neutropenia (LAP: p for trend = 0.035, OR: 0.417, 95% CI: 0.167–1.043; SMI: p for trend = 0.005, OR: 0.116, 95% CI: 0.025–0.534). As shown in Table 5, when assessed continuously, a 1.0-SD increase in LAP was associated with a 36.4% decreased risk of grade 3–4 neutropenia in Model 3 (OR: 0.636, 95% CI: 0.440–0.920), while a 1.0-SD increase in SMI was associated with a 54.4% decreased risk (OR: 0.456, 95% CI: 0.263–0.792). Multivariable-adjusted RCS revealed a significant dose-response relationship between SMI and grade 3–4 neutropenia (p overall = 0.020, p for nonlinear = 0.806; Supplemental Figure S2). Although not statistically significant, a trend between higher LAP, SMI and lower grade 3–4 neutropenia risk was also observed for CVAI.
The associations between CVAI, LAP, SMI and grade 3–4 neutropenia.

Model 1 was the rough model; Model 2 was adjusted for age, gender, Ann Arbor stage and IPI score; Model 3 was further adjusted for extranodal involvement, LDH, anthracyclines and alkaloids.
CVAI, Chinese visceral adiposity index; LAP, lipid accumulation product index; SMI, skeletal muscle mass index.
Bolded p-values indicate p-values less than 0.05.
Subgroup analyses
The association between CVAI, LAP, SMI and risk of grade 3–4 haematological toxicity was further assessed in several subgroups. As shown in Figure 4, for LAP, although a slight interaction was observed between sex and grade 3–4 haematological toxicity (p for interaction = 0.032), the both subgroups showed significant associations with grade 3–4 haematological toxicity. The other variables did not significantly modify the association (all p for interaction >0.05).
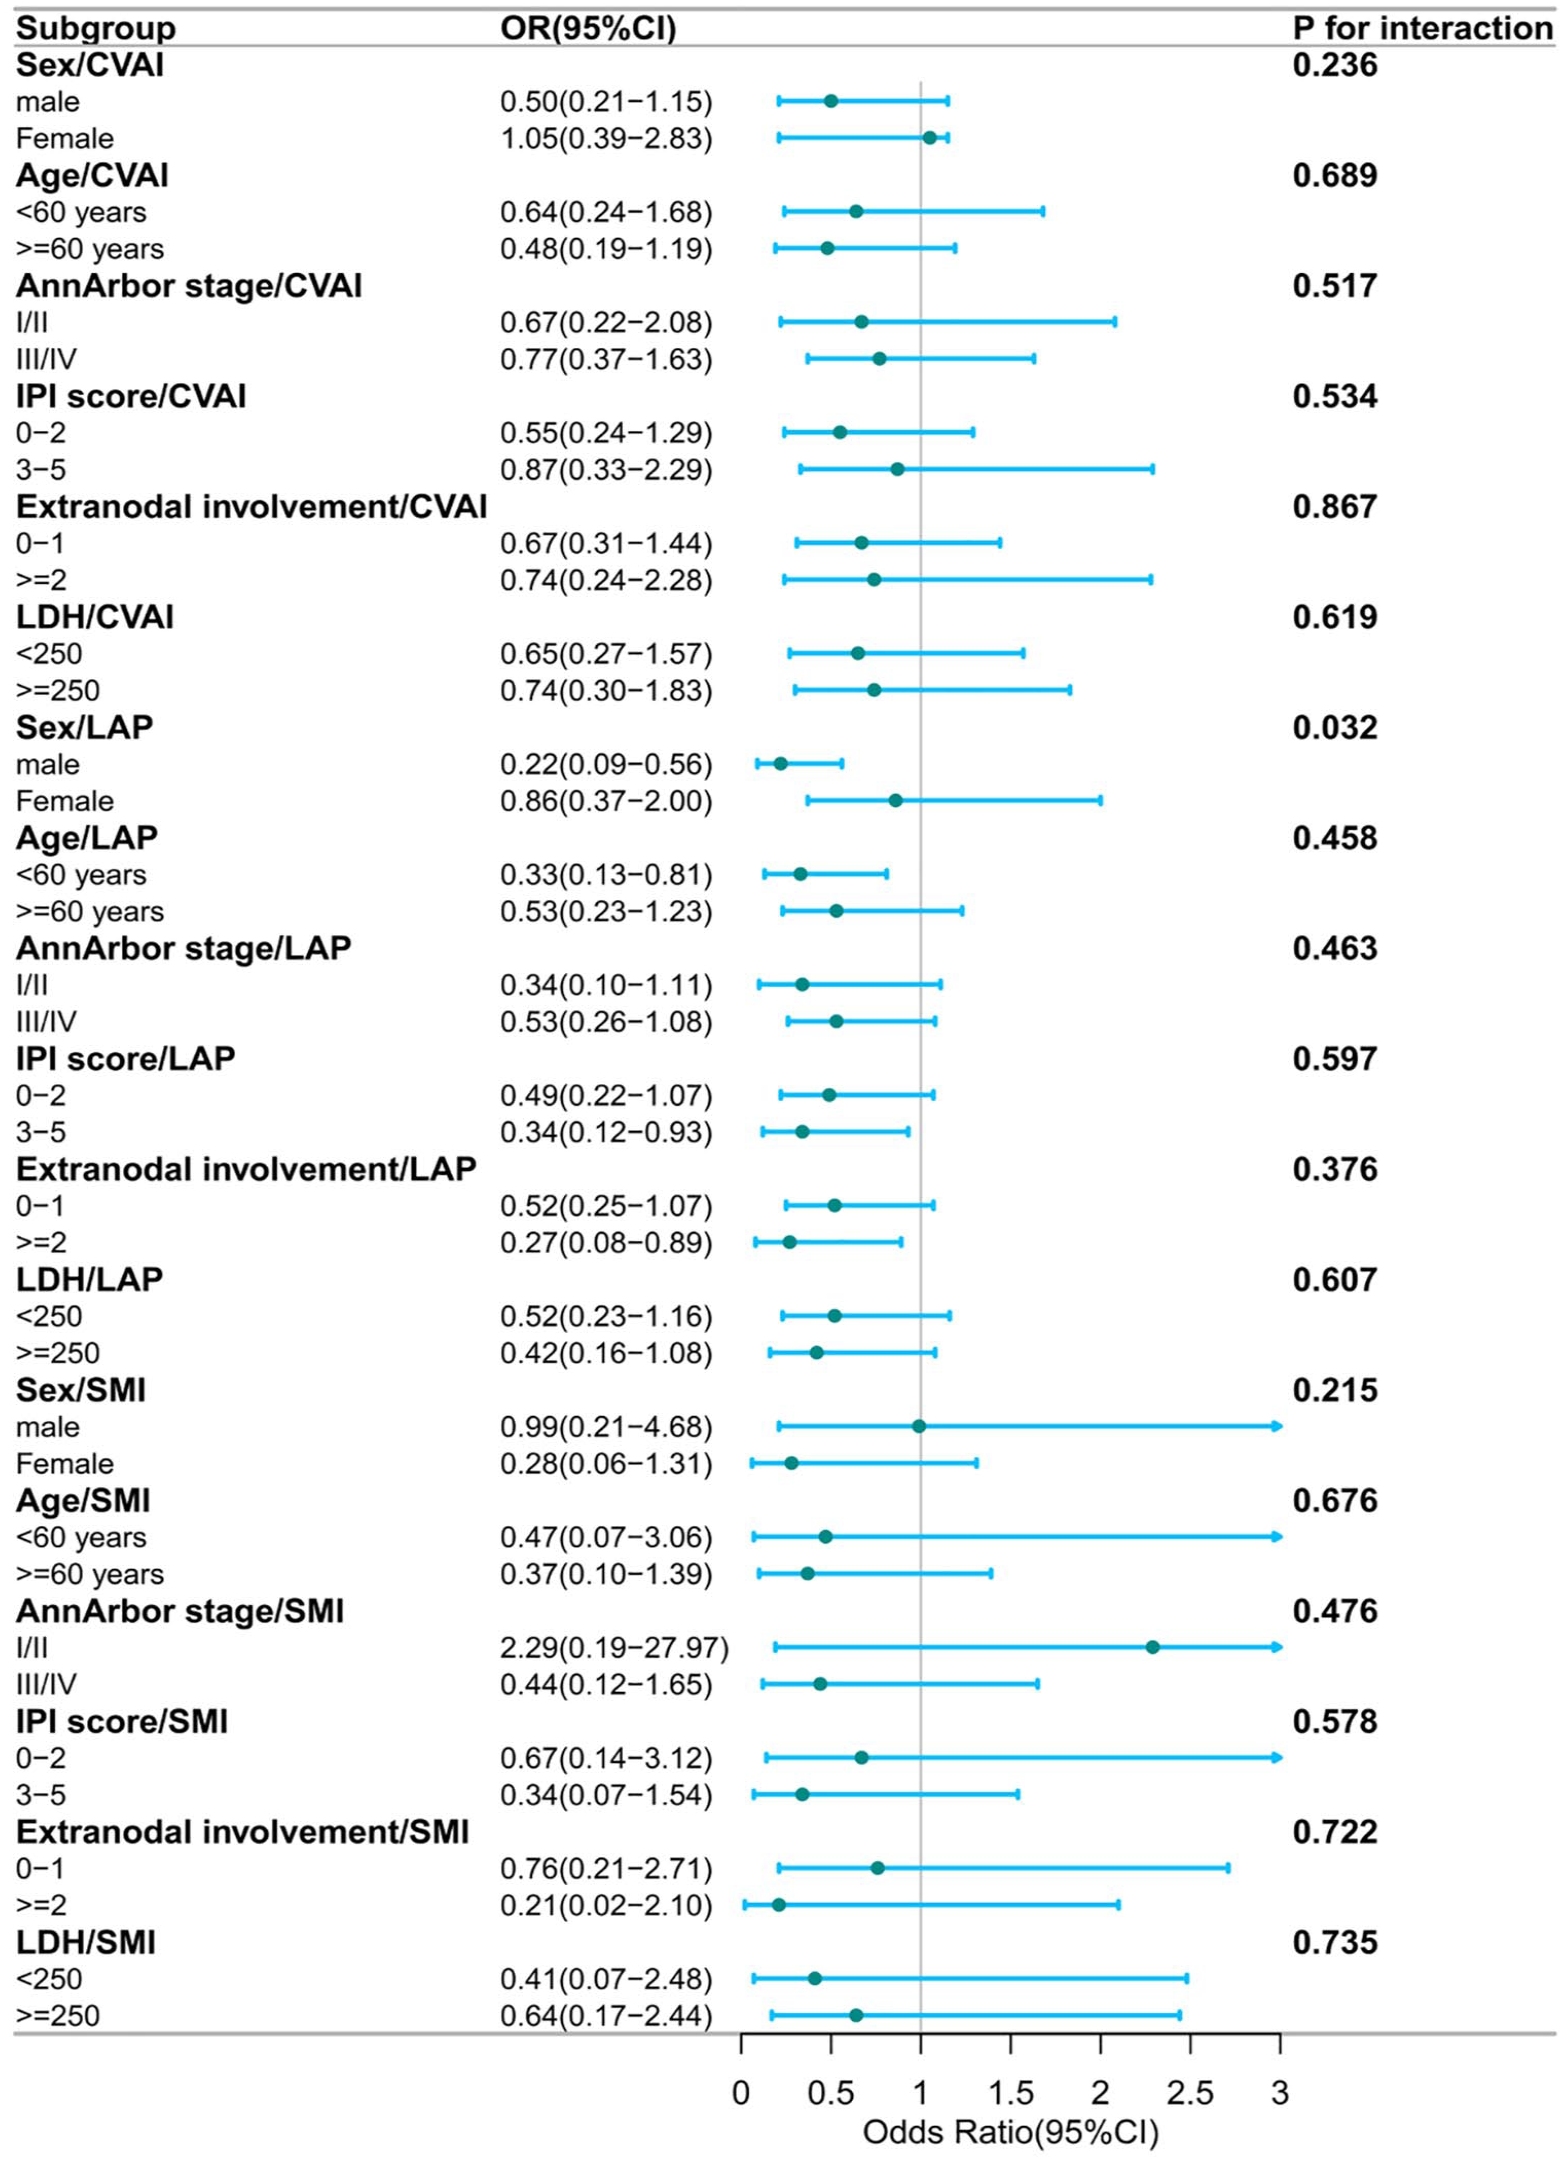
Subgroup and interaction analyses of the association between CVAI, LAP and SMI (classified by the median) and the risk of grade 3–4 haematological toxicity.
Association between CVAI, LAP, SMI and thrombocytopenia, any grade 3–4 toxicity
As shown in Supplemental Table S1, CVAI, LAP and SMI were not significantly associated with grade 3–4 thrombocytopenia in any of the three logistic regression models. Any grade 3–4 toxicity included both haematological and non-haematological toxicities (hepatotoxicity, nephrotoxicity and pulmonary infections). Supplemental Table S2 delineates the correlation between the occurrence of any grade 3–4 toxicity and quartiles of CVAI, LAP and SMI. After adjusting for confounders like age, gender, Ann Arbor stage, IPI score, extranodal involvement, LDH, anthracyclines and alkaloids, elevated CVAI and LAP quartiles were associated with a significantly reduced risk of any grade 3–4 toxicity (CVAI: p for trend = 0.008, OR: 0.256, 95% CI: 0.102–0.644; LAP: p for trend <0.001, OR: 0.192, 95% CI: 0.078–0.471). For SMI, the risk of any grade 3–4 toxicity in Q4 was 60.4% lower than Q1 before adjusting for confounders (p for trend = 0.016, OR: 0.396, 95% CI: 0.181–0.868), but this association was attenuated after adjustment. When assessed as continuous variables, CVAI, LAP and SMI were statistically significantly associated with any grade 3–4 toxicity, with or without covariate adjustment.
Discussion
As chemotherapy drugs continue to evolve, researchers are increasingly focusing on strategies to control the disease while minimizing chemotherapy-related toxicity. Previous studies have attempted to achieve a balance between disease control and minimizing chemotherapy toxicity by comparing different chemotherapy regimens, adjusting drug doses, reducing chemotherapy cycles and so forth.29,30 While reducing the dosage of chemotherapy can mitigate the severity of haematological toxicity after chemotherapy. However, haematological toxicity always accompanies chemotherapy and its occurrence frequency hardly decreases even with a reduction in chemotherapy dosage.
Our study aims to identify body component indexes related to adverse events following chemotherapy, providing new insights for mitigating the severity of post-chemotherapy toxicity. The results indicated that lower CVAI, LAP and SMI were significantly associated with an increased risk of severe haematological toxicity after adjusting for potential confounders. Furthermore, CVAI, LAP and SMI demonstrated consistent trends in relation to anaemia, leucopenia and neutropenia. For LAP, a slight interaction was observed between sex and grade 3–4 haematological toxicity likely due to differences in the occurrence of this toxicity between sexes.
This is the first study to investigate the correlation between CVAI, LAP and SMI – calculated by sex, age, WC, height, weight and blood lipid levels – in patients with DLBCL undergoing immunochemotherapy. The findings are generally consistent with those of previous studies. For instance, BMI is a simple indicator of obesity. Weiss et al. 31 found that patients with high BMI had longer overall survival among 183 DLBCL patients with subsequent multifactorial Cox analyses indicating that BMI was an independent prognostic factor for overall survival. However, indicators that assess adipose and skeletal muscle provide a more accurate reflection of the distribution of body composition distribution than BMI alone. Studies by Camus et al. 22 and Xiao et al. 23 demonstrated that reductions in adipose and skeletal muscle not only serve as poor prognostic factor in DLBCL patients but also increase the risk of treatment-related deaths. Guo et al. 24 evaluated the impact of diverse body composition metrics on the toxicity and prognosis of chemotherapy in DLBCL patients undergoing immunochemotherapy. Their findings indicated that SMI and skeletal muscle density (SMD), skeletal muscle gauge (SMG = SMI × SMD), and lean body mass could predict adverse outcomes and prognosis related to chemotherapy in DLBCL. In children with lymphoma and rhabdomyosarcoma, Wadhwa et al. 29 observed that children with low skeletal muscle density at initial diagnosis experienced more severe haematological toxicity. This association may be attributed to biodistribution of chemotherapeutic agents based on body composition. 32 Moreover, studies in solid tumours such as breast cancer,33,34 non-small cell lung cancer, 35 gastric cancer 18 and colorectal cancer 36 have showed that lower adipose and skeletal muscle tissue are significantly associated with severe immunochemotherapy toxicity and poor prognosis. These studies agree with our conclusion.
However, a small number of studies suggest that high visceral adipose tissue may indicate a worse chemotherapy outcomes. For example, previous research found that a high proportion of visceral adipose tissue relative to total adipose tissue is an independent adverse prognostic factor in DLBCL patients treated with frontline R-CHOP. 37 Cespedes et al. proposed that breast cancer patients with larger visceral or intramuscular adipose tissue might experience more severe toxicity and leading to dose reduction or delays in chemotherapy. 17 Conversely, Cefalì et al. 36 concluded in a cohort of advanced pancreatic cancer patients that changes in body composition are unlikely to be used to predict gemcitabine-nab-paclitaxel toxicity. 38 The discrepancies in the results can be attributed to the several factors: First, the relatively small number of obese individuals in cancer patients may introduce selection bias. Second, differences in sample size and statistical methods can also lead to variations in study results; Sensitivity to changes in body composition indices may also differ across various cancer and chemotherapy regimens. In this study, we employed RCS analysis as well as subgroup and interaction analyses to enhance the robustness of our results. The results still indicated that higher CVAI, LAP and SMI were protective factors for severe immunochemotherapy toxicity.
Cancers often lead to cachexia – a syndrome characterized by functional, metabolic and immunological challenges – as well as treatment-related toxic effects primarily manifesting as loss of skeletal muscle tissue with or without concurrent loss of adipose tissue.39,40 Cachexia is one of the leading causes of cancer-related death and significantly reduces patient survival rates. Its development is marked by the activation of multiple cytokines with in the immune system, resulting in increased systemic inflammation and catabolism that inhibit protein synthesis while enhanced muscle catabolism.39,41 The mechanism underlying why patients with lower adipose and skeletal muscle tissue experience more severe immunochemotherapy toxicity primarily involves differences in the distribution and metabolism of chemotherapy drugs in patients with different adipose and skeletal muscle distribution.22,42,43 Other contributing factors include the relationship between nutritional status and immunity, 39 as well as individual differences and chemotherapeutics sensitivity. Based on our findings, we recommend a comprehensive evaluation of patients prior to chemotherapy initiation – this includes developing personalized chemotherapy regimens and closely monitoring treatment for those with low adipose and skeletal muscle tissue at initial diagnosis – to reduce the risk of serious immunochemotherapy toxicity and prevent cachexia development. Such measures have the potential to improve the treatment efficacy and prolong the patient survival period.
One limitation of this study is the limited research on CVAI, LAP and SMI in cancer contexts. Additionally, retrospective analysis introduces inherent bias which represents another potential limitation. Thus, further studies are needed to validate the utility of CVAI, LAP and SMI. Moreover, many patients may use drugs such as granulocyte colony-stimulating silver factor to prevent immunochemotherapy toxicity may lead to a milder manifestation of this toxicity. Another limitation is the small sample size of patients with DLBCL, which hindered our ability to establish a cut-off value for CVAI, LAP and SMI. Given the numerous factors influencing toxic events during chemotherapy for DLBCL patients, our current data do not allow us to create a nomogram for predicting toxicity outcomes. Additionally, since the most severe haematological toxicity can occur at any point during cycles 1–4 of chemotherapy, we were unable to standardize the chemotherapy cycle between the two groups. Finally, during data collection, we observed that only a small number of patients with an ECOG score greater than 2 were able to tolerate standard chemotherapy beyond four cycles, so we excluded this group of patients from our analysis, which narrowed the applicable population of our study.
Conclusion
In conclusion, our findings indicate that baseline CVAI, LAP and SMI may serve as reliable and effective biomarkers for predicting severe haematological toxicity post-chemotherapy in patients with DLBCL. We recommend conducting a thorough pre-chemotherapy evaluation of patients, alongside vigilant monitoring and maintenance of relatively high levels of CVAI, LAP and SMI to help prevent severe immunochemotherapy toxicity. Future studies should focus on further elucidating the relationship between body composition indices and chemotherapy outcomes, including their underlying mechanisms involved. Moreover, these indices may have the potential to replace BSA as the standard for chemotherapy dosing, thereby advancing personalized approach to the administration of anti-cancer drugs.
Supplemental Material
sj-docx-1-tah-10.1177_20406207251314631 – Supplemental material for Association of CVAI, LAP and SMI with risk of haematological toxicity after immunochemotherapy in patients with DLBCL: a retrospective study
Supplemental material, sj-docx-1-tah-10.1177_20406207251314631 for Association of CVAI, LAP and SMI with risk of haematological toxicity after immunochemotherapy in patients with DLBCL: a retrospective study by Caifeng Liao, Hurong Lai, Yansong Tu, Ling He, Chuyang Lin, Huaijun Tu and Jian Li in Therapeutic Advances in Hematology
Footnotes
References
Supplementary Material
Please find the following supplemental material available below.
For Open Access articles published under a Creative Commons License, all supplemental material carries the same license as the article it is associated with.
For non-Open Access articles published, all supplemental material carries a non-exclusive license, and permission requests for re-use of supplemental material or any part of supplemental material shall be sent directly to the copyright owner as specified in the copyright notice associated with the article.