
Abstract
Background
Speech audiometry is utilised for diagnostic and rehabilitative purposes. Speech audiometry involves materials linguistic in nature. The ideal protocol is to have a tester who is a native or at least a fluent speaker of that language to conduct the test on a native listener. Except for a set of psychometrically equivalent word recordings that have yet to be validated, no other existing speech audiometry materials have been developed in Singapore English.
Objective
This study aims to develop and validate a local set of phonemically balanced English word lists for use on Singaporeans.
Methods
The first phase encompassed the development of spondaic and phonemically-balanced monosyllabic word lists for Speech Reception Threshold (SRT) and Word Recognition Score (WRS) testing. The second phase established perceptual equivalence across the monosyllabic word lists. The third phase encompassed the validation of these materials on 72 normal-hearing and hearing-impaired Singaporeans between 21 to 80 years old. Participants were tested with two spondaic and six monosyllabic word lists. Participants’ SRT and WRS values were analysed.
Results
The mean SRT and pure tone audiometry (PTA) average difference was 5.79 dB. All 43 normal-hearing participants achieved a maximum WRS of 100%, at an average presentation level of 28.1 dB above their PTA average. Test-retest analysis revealed clinically insignificant differences across all word lists.
Conclusion
The test materials are validated to be suitable for testing on Singaporean English speakers. Normative SRT and WRS data for Singaporeans have also been established.
Keywords
Introduction
Speech audiometry is an audiological test that can be used for validating one’s hearing status, diagnostic purposes, and aiding hearing rehabilitation decisions. Speech audiometry aims to assess one’s reception and recognition of speech. 1 One result obtainable from speech testing is the speech reception threshold (SRT). SRT is the lowest intensity at which one can correctly repeat the presented spondaic words half of the time. 2 SRTs and pure tone audiometry (PTA) averages at 500 Hz, 1000 Hz, and 2000 Hz nearly always lie within 10 dB of each other, making SRTs suitable as a cross-validation measure for assessing the validity of one’s PTA results.1,3 SRTs also supplement PTA results in assessing and validating one’s degree of hearing impairment and provide an estimation of one’s communication disability. 4 For example, the higher the SRT, the poorer the individual’s speech reception ability. 3
The word recognition score (WRS) is another result obtainable from speech audiometry. The WRS is a percentage score obtained by assessing the number of monosyllabic words correctly identified in a word list at a particular presentation level. 2 WRS testing can be used for differential diagnoses. Individuals with conductive losses, sensory/neural hearing loss (SNHL), and retrocochlear pathologies will exhibit scores that differ accordingly from normal-hearing individuals. 5 Besides differential diagnosis, the WRS performance can also be used for facilitating audiological rehabilitation management. The highest WRS one attains is called the PB-max. 6 High PB-max scores suggest that the individual is likely to receive greater benefits from the hearing aid or device.4,6
In Singapore, current materials used for English speech audiometry include the Central Institute of the Deaf (CID) Word Lists W-1 and W-2 for SRT testing. For WRS testing, the CID W-22, the Northwestern University Auditory Test No. 6 (NU-6), and Arthur Boothroyd (AB) word lists are used.5,7–11 These materials were developed and validated on the American and British populations respectively. 8 There is currently no evidence to suggest that these materials are suitable to be used on Singaporean English speakers.
Various factors such as accents, word familiarity, and one’s proficiency in the language may influence one’s performance in speech audiometry. Speech audiometry materials are inherently linguistic in nature. A listener who is not fluent in or familiar with the accent of speech materials presented may not be aware of or comprehend all the subtleties and allophonic variations presented in the speech. 12 This leads to misinterpretations of the words presented due to accent unfamiliarity. 13 Accents are a natural part of spoken language, and Singaporeans have an accent distinct from other native English speakers. A study by Gu and Chen reported that Singaporeans do not lower their third formant nearly as much as Americans do. 14 Gu and Chen also reported that Singaporeans’ vowel height characteristics are distinct from the American and British populations. Moreover, compared to Americans, Singaporeans lack rhoticity in speech, further emphasising the differences between accents. 14 These studies suggest that accent familiarity comes into play when the test materials involve words. 15 Unfamiliarity with the American and British accents in the CID, NU-6, and AB test materials may result in inaccurate assessments of one’s listening abilities when assessed on Singaporeans. 12 Hence, locally used speech audiometry test materials should be recorded in the native Singaporean English accent by local speakers.
Word familiarity is another factor that could influence performance in speech audiometry. Familiar words are easier to identify, use, and spell as compared to unfamiliar words, due to the higher lexical frequency exposure of familiar words. 16 Tillman and Jerger concluded that it is more challenging for unfamiliar words to be correctly repeated, as compared to familiar words, especially at low intensities. 17 The CID W-22 and NU-6 word lists were developed in the early 1900s, with words selected based on the assessment of the relative occurrence in local newsprints and familiarity studies.5,7–11 As the CID and NU word lists were developed for the American and British population many years ago, the test materials may not be familiar to the current Western population, and more so to Singaporean listeners.5,7–11 This may potentially result in poorer speech scores when these word lists are administered to Singaporeans despite the word being fully audible to the individual. 18 Hence, it is important that local speech materials include words that are familiar to Singaporeans.
A third factor that could influence speech performance is bilingualism. In Singapore, all students in government primary and secondary schools are mandated to learn a second language. 19 Due to Singapore’s education policy, approximately 74.3% of Singaporeans are bilinguals.20,21 Multiple studies have found that bilinguals fare poorer than monolinguals in speech tests involving linguistic stimuli, particularly in the presence of background noise.22–24 Hence, speech results obtained with the American CID and NU materials that were developed for monolingual English speakers should not be interpreted the same way for the predominantly bilingual Singaporean population.
As existing English speech audiometry test materials developed overseas have not been validated to be appropriate for local use, the National University of Singapore (NUS) conducted studies to develop speech audiometry test materials for the local population. In 2015, Soo re-recorded all the words in the CID W-1 and W-22 lists as well as the Bamford-Kowal-Bench (BKB) sentences using a native Singaporean English speaker. 25 Participants in Soo’s study were tested using both the original American and re-recorded Singaporean accented speech materials. 25 Soo reported that the American materials yielded approximately 20% more errors than the Singaporean material. 25 In addition, participants generally scored higher with the Singaporean recording compared to the American version of the CID W-22 monosyllabic word materials. 25 As for the BKB sentences, participants scored equally well for both the American and Singaporean recordings, which Soo attributed to the presence of contextual cues in sentences as compared to monosyllabic words. 25 Soo’s study demonstrated that Singaporeans yielded better speech performance when tested with the Singaporean-spoken spondaic and monosyllabic speech materials as compared to the American recordings due to accent familiarity. 25
Soo’s Singaporean recordings of the CID W-1 and W-22 words were then validated by New on 30 normal-hearing Singaporeans. 26 The study found a correlation coefficient of r = 0.721 between the SRT and PTA averages. 26 This was lower than most research reporting correlation coefficients above 0.9, possibly due to the participants’ unfamiliarity with words such as ‘duckpond’, ‘inkwell’, and ‘hothouse’.27–30 New’s study also found certain monosyllabic words that prevented participants from scoring 100% despite the presentation level (PL) approaching 40 dB SL. 26 Additionally, New found the Singapore version of the CID W-22 lists to be not equivalent in difficulty across lists. This led to the conclusion that recording the CID W-22 word lists with a native Singaporean English speaker might not be an appropriate manner of adapting the materials for local use, as the words might still be inherently unfamiliar to Singaporean English speakers. 26
The problems discussed by New prompted Tan to develop a new set of psychometrically equivalent Singapore English speech audiometry test materials.26,31 Tan first obtained 43,000 spondaic and monosyllabic words from the National Speech Corpus (NSC). 31 502 monosyllabic words and 123 spondees were shortlisted based on the frequency of occurrence in typical Singaporean speech. 31 Native Singapore English speakers then rated their familiarity with these words on a five-point Likert scale. 31 The words rated as “extremely familiar” were selected for recording 31 with a certified audio engineer in a professional recording studio, adhering to reverberation and noise level standards specified by International Organization for Standardization (ISO) guidelines. 32 A 26-year-old Singaporean male with a native accent was engaged as the speaker. 31 Recordings were scaled to the average RMS across the shortlisted spondaic words (−26.34 dBV) and monosyllabic words (−26.86 dBV). 31 Tan then tested 110 spondaic words and 270 monosyllabic words on 10 normal-hearing Singaporeans. 31
Tan obtained the psychometric functions of each word according to the intensity and analysed the regression slopes and intercepts. 31 Words with psychometric functions that differed considerably in their slopes at 50% were deemed not psychometrically equivalent. These words were subsequently removed, leaving 65 spondaic and 216 monosyllabic words. 31 Tan focused on analysing the slope at the 50% performance point of each word because it was a means for comparing the relationship between the slopes of every word at the point of threshold, where the word was correctly identified 50% of the time. 31 This analysis has also been performed in multiple preceding speech audiometry studies.33–35 The mean slope at 50% for Tan’s study was 6.85% per dB for spondaic words and 5.80% per dB for monosyllabic words, similar to previous studies.31,34,36
Tan created psychometrically equivalent words that are familiar to the local English-speaking population. 31 However, for these recordings to be used clinically, they must first be put into phonemically balanced word lists and validated on Singaporean English speakers. Thus, this study aims to (1) develop phonemically balanced (PB) word lists based on the psychometrically equivalent word recordings from Tan’s 31 study, (2) evaluate list equivalence of the PB lists, and (3) validate the test materials on normal-hearing and hearing-impaired Singaporean English speakers.
Methodology
This study was conducted over three phases. The first phase involved the allocation of spondaic words into lists for SRT testing, as well as the development of PB lists for WRS testing. The second phase involved establishing list equivalence of the PB lists. The last phase involved the validation of the perceptually equivalent PB lists on Singaporeans.
Creating SRT and PB word lists
The 65 spondaic words from Tan’s 31 study were randomly allocated into two non-overlapping spondaic word lists. One list consisted of 33 words, whereas the other consisted of 32 words.
The 216 monosyllabic words from Tan’s 31 study were broken down into individual phonemes. Each phoneme’s frequency of occurrence was determined by analysing the transcriptions of 1000 hours of spontaneous spoken speech from the NSC.31,37 This analysis was necessary so that the words could be allocated into separate lists of 25 words, with the phonemes in each list being as close as possible (±2%) to the distribution of phonemes in spoken Singapore English. Eight PB lists of 25 monosyllabic words each were created. Based on a study by Kim et al. 38 which suggested no significant differences in WRS reliability between 50- or 25-word lists, the number of words within each list was kept at 25 to maximise clinical efficiency.
Establishing perceptual equivalence in phonemically balanced lists
List equivalence of the created PB lists was determined based on data obtained from Tan’s 31 study. Repeated measures ANOVA (RM ANOVA) was performed by analysing the derived WRS of participants at intensity levels from 5 to 55 dB HL, in 5-dB increments. Through this analysis, participants’ derived WRS of the intensity levels were compared across all lists. The purpose of running the eight PB lists developed in this study through RM ANOVA is to identify list pairs that produce statistically significantly different results from one another. With each comparison, list pairs that reveal a Bonferroni-corrected p-value of <0.05 would suggest that the list pair produces statistically significant results from one another. The removal of lists that produced significantly different WRS from the other lists was to ensure that all lists used in phase 3 would be perceptually equivalent.
Validation of equivalent phonemically balanced word lists on Singaporeans
The last part of this study involved validating the spondaic word lists and equivalent PB word lists on Singaporeans.
Test materials
The individual word recordings by Tan 31 were merged into audio tracks and scaled using the Audacity 3.1.3 software.
Spondaic word lists
The two spondaic word lists to be used for SRT testing comprised 32 and 33 words. The spondaic words were scaled such that the 50% point of their respective psychometric functions equated to the mean PTA average of 9.80 dB HL of all participants in Tan’s 31 study. The interval between successive spondaic words was four seconds to allow adequate time for the listener to verbally repeat the presented word. Each word list was duplicated, with the duplicated list having a different word order for retest purposes. Hence, there was a total of four spondaic word list audio tracks.
All spondaic and monosyllabic word tracks were calibrated using a 1 kHz calibration tone. The calibration tone for SRT testing was scaled to the average RMS value of the 65 spondees (−24.20 dBV) after each of the spondees was scaled to the mean PTA of participants. All audio tracks were saved in a lossless WAV format to prevent compromise in audio quality.
Monosyllabic word lists
To prepare PB lists in audio tracks, each monosyllabic word was preceded by a carrier phrase “You Will Say…”. Each PB word list also had a duplicated list with different word order for retest purposes.
All monosyllabic words were scaled to an RMS value of −26.86 dBV, consistent with the average RMS across the shortlisted monosyllabic words from Tan’s study. 31 The 1 kHz calibration tone for WRS testing was also scaled to the same RMS value. All audio tracks were similarly saved in a lossless WAV format.
Ethics approval
Ethics approval was granted by the National University of Singapore Institutional Review Board (NUS-IRB-2022-365). This was a prospective case-controlled study.
Participants
This study recruited participants between the ages of 21 to 80 years old who were born and resided in Singapore. Participants were proficient in English and reported using English daily. They also must not have lived abroad for more than five years.
Procedures and equipment
Participants had to first undergo screening to determine eligibility prior to the speech audiometry test. The screening involves (1) a language background questionnaire (2) otoscopy, and (3) screening for cognitive impairment using the Mini-Cog assessment tool for participants aged 65 and above. 39
Participants who passed the screening then proceeded with tympanometry, which was carried out with the Interacoustics Titan IMP440 tympanometer. Following tympanometry, participants proceeded with PTA. PTA was performed using the Interacoustics Callisto AC440 portable audiometer (Type 1, Version 1.10.1). Insert Earphones with disposable foam ear tips (ER-3A) and a RadioEar B71 bone conductor were used to obtain air conduction (AC) and bone conduction thresholds respectively at octave frequencies between 250 Hz and 8 kHz. This step provided the tester with the PTA average result at 500 Hz, 1 kHz, and 2 kHz. Tympanometry and PTA results were interpreted together to determine the hearing classification. Participants with AC thresholds above 25 dBHL at any frequency were classified as having hearing loss.
The last procedure involved speech audiometry testing using the prepared Singapore English speech audiometry test materials. Participants underwent speech testing with all SRT and WRS word list tracks in one ear. Participants were informed that they would hear words from either ear and instructed to verbally repeat the words heard even if they were soft. Participants were encouraged to guess the words they were unsure of.
SRT testing was performed before WRS testing. The order of the four SRT tracks was randomized using a Latin Square Design to reduce sequencing effects (Appendix A). The SRT testing procedure was performed in accordance with the ASHA 40 protocol. However, for the first SRT list, participants did not undergo the familiarisation procedure, while familiarisation was performed for the second list. Performing the test without familiarisation was done to evaluate if familiarisation would affect SRT results.
WRS testing was performed for all 12 tracks at 12 intensity levels in 5 dB increments, from −5 dB SL up to +50 dB SL, with respect to the participant’s PTA average (Appendix B). The word list order and PL of the tracks were randomized using the Latin Square Design to reduce sequencing effects as well. This method ensured that (1) a participant is not tested with the same list at multiple intensities or with multiple lists at the same intensity, and (2) the same list-intensity pairs are only tested once every 12 participants.
Retest was conducted for all SRT and WRS lists using the corresponding duplicated lists with different word order. The PL of all retest attempts was kept consistent with the initial test attempts. Speech masking was presented to the contralateral ear whenever required.
Statistical analysis
Data was analysed using a statistical analysis software package (Jamovi 2.2.5). The SRT and PTA results were compared via a paired t test. To evaluate test-retest consistency, the two SRT tracks that comprised the same words but arranged in different orders were also compared via paired samples t-tests to check for any significant differences in the repeated measures.
For WRS results analysis, the reference speech recognition curve for normal-hearing and hearing-impaired participants was analysed according to the ISO guidelines. 32 The PB-max scores for all participants were analysed and compared between normal-hearing and hearing-impaired participants. A paired-samples t test was performed to check for any significant differences between the test and retest WRS to evaluate test-retest reliability. Critical difference ranges were also established using the 95% confidence intervals that retest WRS fell within.
Results
Perceptual equivalence in the phonemically balanced lists
Post-hoc analysis of list pairs with significantly different mean WRS at 30 dB HL.

List 2 and List 6 were subsequently removed, and the RM ANOVA analysis was repeated on the six remaining lists. Thereafter, the RM ANOVA analyses at each tested intensity level showed no more lists with significantly different mean WRS, suggesting that Lists 1, 3, 4, 5, 7, and 8 were perceptually equivalent.
Validation of perceptually equivalent PB word lists
Participants
Breakdown of hearing impaired particpants’ PTA average.

Speech reception threshold
Mean test SRT – PTA difference for List 1 and List 2.

SRT – PTA paired samples t test analysis.

Word recognition in quiet of normal-hearing participants
The reference speech curve of normal-hearing participants can be seen in Figure 1. The reference speech curve in Figure 1 was fitted to the mean WRS of normal-hearing participants at various intensity levels according to the equation below, where Reference speech curve of normal-hearing participants. The data points in blue are actual mean WRS of participants. The reference curve below 0 dB HL was extrapolated based on the derived values of k and x0.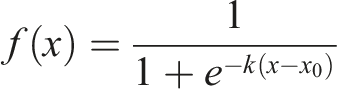

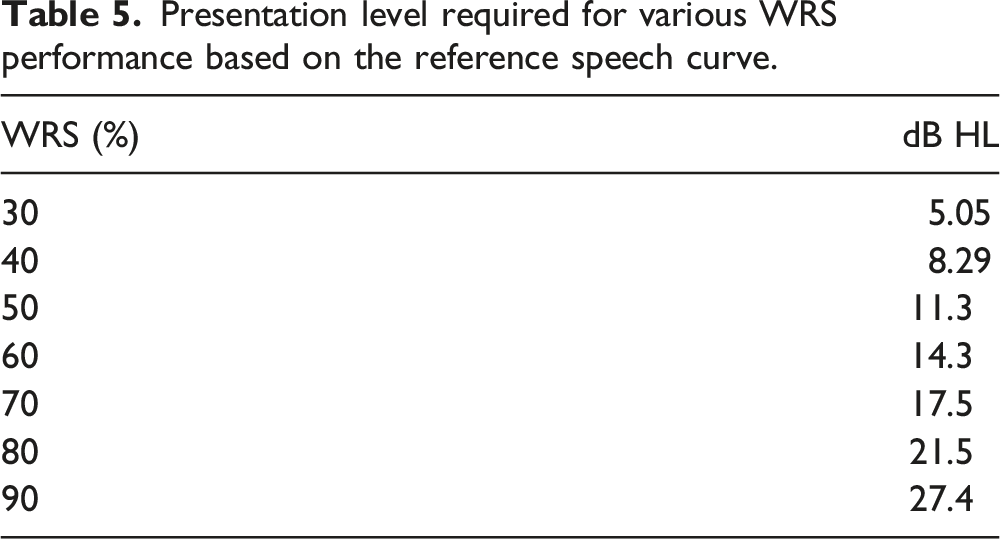
Presentation level required for various WRS performance based on the reference speech curve.
PB-max of normal-hearing participants
All 43 normal-hearing participants achieved a PB-max of 100% between 20 dB SL to 50 dB SL. The mean PL required for the normal-hearing participants to achieve PB-max is 28.1 dB SL.
Word recognition in quiet of participants with hearing loss
The word recognition ability in quiet of participants with SNHL was examined. Figure 2 shows the mean word recognition curve of participants with SNHL. The PL is with reference to participants’ PTA average. 10 SNHL participants exhibited a small but clinically insignificant speech rollover. The 50% slope of the word recognition curve is 2.01%/dB. Mean word recognition curve of participants with hearing loss.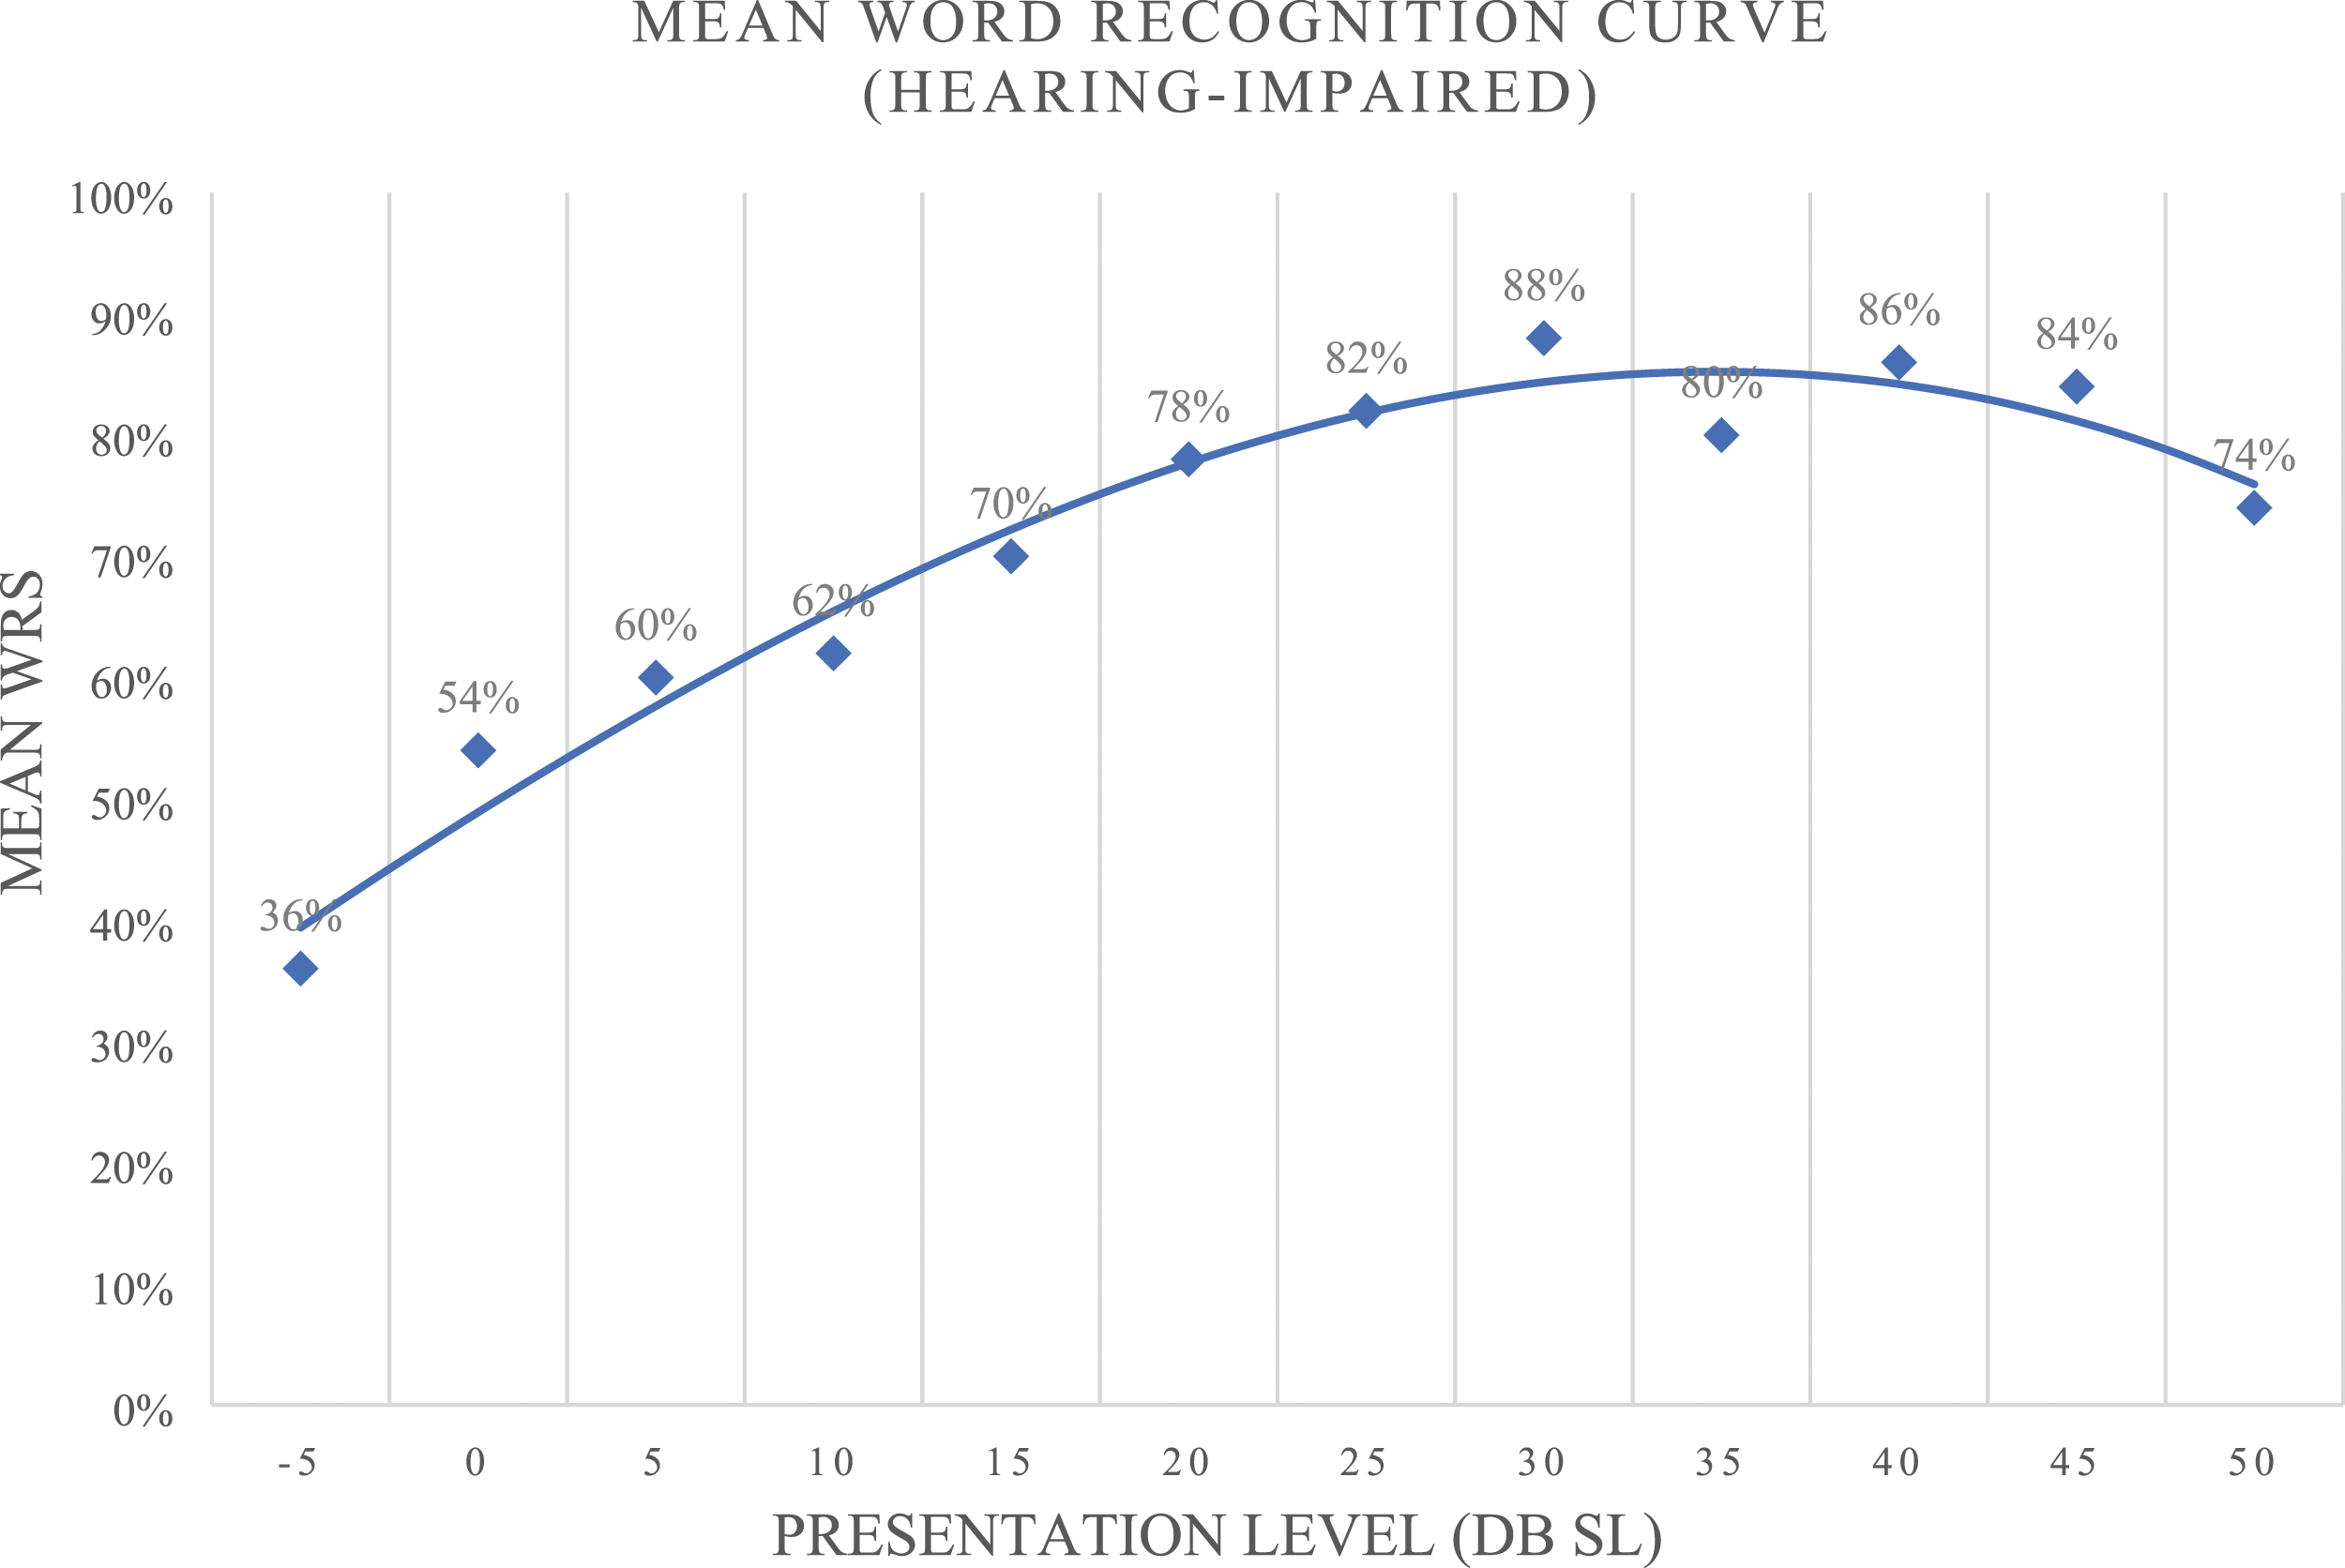
PB-max of hearing-impaired participants
Mean PB-max of hearing-impaired participants. It was not possible to establish the PB-max of two participants with severe – profound SNHL. At the highest presentation level of 90 dB HL, the participants’ highest WRS were 32% and 60%.

34.5% (10 out of 29) of the participants with hearing loss were unable to achieve PB-max performance over 90%. 58.6% (17 out of 29) were unable to achieve a PB-max of 100%. The majority of the participants with normal hearing at 2 kHz or mild hearing losses at 1-2 frequencies managed to attain PB-max scores of above 90%. Analysis of the WRS data shows that PB-max scores decreased as the 2 kHz threshold increased.
Test-retest reliability
Paired samples t test analysis of test and retest WRS.

Critical difference ranges
Critical intervals for each band of WRS in all participants.


Critical difference ranges for the PB word lists. If a retested or second WRS on the vertical axis falls within the critical difference range (green bar) of the first WRS along the horizontal axis, the two WRS are not considered as significantly different.
Discussion
The current study aimed to validate the developed English speech audiometry materials and establish testing procedures suitable for the Singaporean population. Familiarising participants with the test words is a step in SRT testing according to ASHA protocol. There were no unfamiliar words reported by all participants in this study, suggesting that the words in the spondaic word lists are familiar to most Singaporeans. SRT analysis in this study revealed smaller SRT – PTA differences without familiarisation as compared to with familiarisation. This phenomenon is likely because, with familiarisation, participants have the words in their lexical memory. Hence, when test words are presented at low intensities, participants are more likely to guess the correct word which results in a lower SRT, varying further from their PTA average. A smaller SRT – PTA difference without familiarisation also suggests that the familiarisation procedure before SRT testing with this set of materials might not be necessary.
Using both SRT List 1 and 2 without familiarisation, participants obtained SRTs within 10 dB of their PTA averages, with List 2 showing slightly better SRT-PTA agreement than List 1.10 dB was taken into consideration because according to Ventry and Chaiklin, 43 SRT – PTA discrepancy of 12 dB or more is considered to indicate a non-organic hearing loss. Hence, differences of more than 10 dB constitute clinical significance and must be explored. Thus, the analysis demonstrating that both lists produce SRT – PTA differences within 10 dB, suggests that the local materials are suitable for cross-validation of participants’ PTA average in the audiological test battery.
The test-retest analysis of List 1 and 2 without familiarisation revealed statistically significant differences in SRT between test and retest attempts. Although the p-values for List 1 and 2 without familiarisation were less than 0.05, which suggests a statistically significant difference, the mean differences across both lists were less than 5 dB. PTA is a subjective assessment and variability due to one’s decision process, physiologic or bodily noise, and differences in transducer placement may affect the threshold obtained. According to ASHA, a significant threshold shift is defined by thresholds differing by 10 dB or more on retest attempts. 40 This criterion has been applied widely in audiometric studies. 40 Thus, the low mean differences of less than 5 dB suggest clinically insignificant differences in retest attempts. This phenomenon where the majority of participants attained lower SRT scores on retest attempts is likely due to the practice effect. Therefore, retests conducted in a clinical setting should be performed with a separate list.
The steepness of a slope is indicative of the rate that which performance increases as stimulus intensity increases. 44 The slope at the 50% performance point of the speech curves is often the steepest and provides a means for comparison with similar test materials. Comparing slopes at the 50% performance point between word lists has also been performed in similar speech audiometry research.33–35 In this study, the mean slope at 50% of the reference speech curve for normal-hearing participants was 3.40%/dB. This finding is in agreement with the CID W-22 and NU-6 recordings that reported an average slope of 4.4%/dB. 36 Psychometric functions have also been obtained in previous studies using masked speech materials showing slope values with a large variation from 1%/dB to 44%/dB, with a median of 6.6%/dB. 44 The steepness of slopes obtained in this study is comparable to findings from existing research which suggests that the local test materials are suitable for use in speech audiometry.
All 43 normal-hearing participants were able to achieve a PB-max of 100% at suprathreshold levels. This finding is consistent with Jerger & Jerger that normal-hearing individuals should be able to obtain a PB-max between 90% to 100%. 6 Normal-hearing participants were able to achieve and sustain a WRS performance of 90% - 100% at an average SL of 28.1 dB. The analysis suggests that on average, a minimum of 30 dB SL from the PTA average is required to obtain the PB-max of normal hearing individuals.
A total of 29 participants were classified as having hearing loss based on any one threshold exceeding 25 dB HL. It is important to note that many of the participants with hearing loss still had good low-frequency hearing and PTA averages under 25 dB HL. This configuration of hearing loss would allow participants to perceive most speech sounds, as the phonemes typically fall between 250 Hz and 6000 Hz, with high frequency consonants providing speech clarity. After considering various combinations, the study team found the 2 kHz threshold to be the best indicator of the degree of hearing loss that would predict particpants’ PB-max. It was observed that most participants with the 2 kHz threshold in the normal or mild hearing loss range (≤40 dBHL) managed to achieve high PB-max scores above 90%. As the 2 kHz threshold worsened to moderate hearing loss and greater severity, the mean PB-max was also lowered. In addition, 31.0% (9 out of 29) of participants with hearing loss exhibited small speech curve rollovers. Small rollovers are normal occurrences observed in the people with sensorineural hearing loss due to speech distortion as the presentation level increases beyond the PB-max. The above findings suggest that the materials are sensitive enough to identify most participants with hearing loss, and the developed PB lists can reflect the loss of clarity in the more severe hearing losses of cochlear origin.
Test-retest analysis of WRS across the six PB word lists showed that all the p-values in the paired t test analysis were less than 0.05, indicating a statistically significant difference between test and retest attempts. However, the mean test-retest difference across all six lists was less than 5%, suggesting a clinically insignificant difference given that each word accounted for 4% of the total WRS in a 25-item word list. In general, WRS scores were higher on retest attempts, likely attributed to the practice effect. This observation is similar to the familiarisation effect observed in SRT testing where most participants attained better SRTs on retest attempts. A number of participants reported hearing the same word several times during testing, with some mentioning they realized the incorrect word they might have been responding once the word was presented at higher intensities. These findings show that retesting with the same word list yields better WRS performance, hence suggesting that within a clinical setting, retest attempts should be performed with a different but perceptually equivalent word list.
The critical difference ranges for the PB word lists have been established based on the test and retest scores of all participants. Retest scores that fall out of the critical difference range suggest a statistically significant different WRS from the initial WRS. The critical difference ranges can be used for clinical assessments of asymmetrical hearing losses, assessing pre- and post-intervention changes in speech perception, or comparison of benefits between hearing aids of different brands and technology levels.
Conclusion
The current study aimed to develop spondaic and PB words derived from Tan's psychometrically equivalent words. 31 Additionally, the study sought to validate the newly developed materials among individuals with normal hearing and cochlear hearing losses within the local population. The two spondaic word lists produced SRT that have good agreement with participants’ PTA averages and require no familiarisation procedure prior to administration. The resultant six perceptually equivalent PB word lists are sensitive to cochlear losses and display good test-retest reliability. The word lists include words familiar and pronounced in an accent familiar to Singaporeans. This allows for more accurate testing of one’s auditory abilities and functional assessment of hearing devices on patients. The limitation of this study was the lack of participants with other types of hearing loss such as conductive and retrocochlear hearing loss. The study team is therefore unable to establish normative data with the Singapore English speech audiometry test materials on these populations. Prospective studies are warranted to validate the findings above on larger cohorts including participants presenting with other kinds of auditory pathologies. In addition, future studies should also work to establish the PL required to best estimate hearing-impaired individuals’ PB-max. This would enable clinicians to estimate one’s PB-max by administering word recognition tests at only one PL instead of having to establish a full speech curve, further maximising clinical efficiency.
Footnotes
Acknowledgments
The authors would like to thank all participants, professors, and the NUS faculty of MSc Audiology for contributing their valuable time and feedback, without which this would not have been possible.
Author contributions
Author Christel Li Hui Chue wrote the first draft of the manuscript. All authors reviewed and edited the manuscript and approved the final version of the manuscript.
Declaration of conflicting interests
The author(s) declare no potential conflicts of interest with respect to the research, authorship, and/or publication of this article.
Funding
The author(s) disclosed receipt of the following financial support for the research, authorship, and/or publication of this article: This work was supported by a gift donation from the Sivantos Pte Ltd.
Correction (February 2024):
Article updated to correct the first sentence of the “Conclusion” section.
Ethical statement
Data Availability Statement
The datasets generated and/or analysed during the current study are available from the main author, Christel Li Hui Chue.
Appendix A
The SRT test lists were labelled as such: List 1A, 2A.
The SRT retest lists were labelled as such: List 1B, 2B. Order of word lists presented for SRT testing per four participants.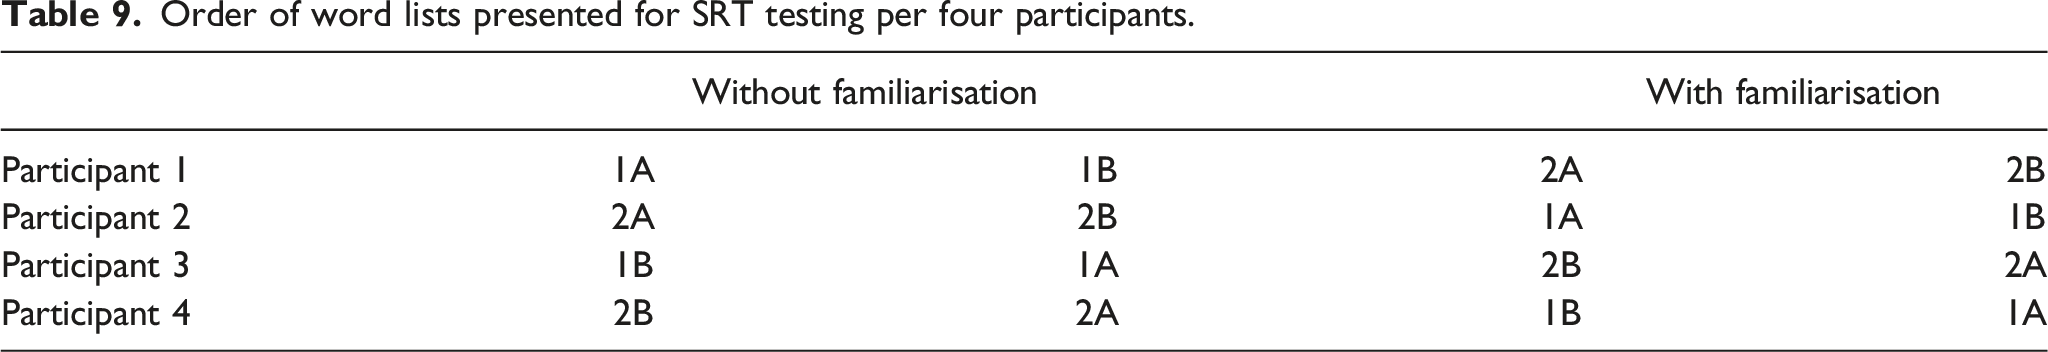
Without familiarisation
With familiarisation
Participant 1
1A
1B
2A
2B
Participant 2
2A
2B
1A
1B
Participant 3
1B
1A
2B
2A
Participant 4
2B
2A
1B
1A
Appendix B
The WRS test lists were labelled as such: List 1.1, 2.1, 3.1, 4.1, 5.1, 6.1.
The WRS retest lists were labelled as such: List 1.2, 2.2, 3.2, 4.2, 5.2, 6.2. Order of test WRS measures per 12 participants. Order of retest WRS measures per 12 participants.
Participant
PL (dB SL)
−5
+0
+5
+10
+15
+20
+25
+30
+35
+40
+45
+50
1
1.1
2.1
6.2
3.1
5.2
4.1
4.2
5.1
3.2
6.1
2.2
1.2
2
2.1
3.1
1.1
4.1
6.2
5.1
5.2
6.1
4.2
1.2
3.2
2.2
3
3.1
4.1
2.1
5.1
1.1
6.1
6.2
1.2
5.2
2.2
4.2
3.2
4
4.1
5.1
3.1
6.1
2.1
1.2
1.1
2.2
6.2
3.2
5.2
4.2
5
5.1
6.1
4.1
1.2
3.1
2.2
2.1
3.2
1.1
4.2
6.2
5.2
6
6.1
1.2
5.1
2.2
4.1
3.2
3.1
4.2
2.1
5.2
1.1
6.2
7
1.2
2.2
6.1
3.2
5.1
4.2
4.1
5.2
3.1
6.2
2.1
1.1
8
2.2
3.2
1.2
4.2
6.1
5.2
5.1
6.2
4.1
1.1
3.1
2.1
9
3.2
4.2
2.2
5.2
1.2
6.2
6.1
1.1
5.1
2.1
4.1
3.1
10
4.2
5.2
3.2
6.2
2.2
1.1
1.2
2.1
6.1
3.1
5.1
4.1
11
5.2
6.2
4.2
1.1
3.2
2.1
2.2
3.1
1.2
4.1
6.1
5.1
12
6.2
1.1
5.2
2.1
4.2
3.1
3.2
4.1
2.2
5.1
1.2
6.1

Participant
PL (dB SL)
−5
+0
+5
+10
+15
+20
+25
+30
+35
+40
+45
+50
1
1.2
2.2
6.1
3.2
5.1
4.2
4.1
5.2
3.1
6.2
2.1
1.1
2
2.2
3.2
1.2
4.2
6.1
5.2
5.1
6.2
4.1
1.1
3.1
2.1
3
3.2
4.2
2.2
5.2
1.2
6.2
6.1
1.1
5.1
2.1
4.1
3.1
4
4.2
5.2
3.2
6.2
2.2
1.1
1.2
2.1
6.1
3.1
5.1
4.1
5
5.2
6.2
4.2
1.1
3.2
2.1
2.2
3.1
1.2
4.1
6.1
5.1
6
6.2
1.1
5.2
2.1
4.2
3.1
3.2
4.1
2.2
5.1
1.2
6.1
7
1.1
2.1
6.2
3.1
5.2
4.1
4.2
5.1
3.2
6.1
2.2
1.2
8
2.1
3.1
1.1
4.1
6.2
5.1
5.2
6.1
4.2
1.2
3.2
2.2
9
3.1
4.1
2.1
5.1
1.1
6.1
6.2
1.2
5.2
2.2
4.2
3.2
10
4.1
5.1
3.1
6.1
2.1
1.2
1.1
2.2
6.2
3.2
5.2
4.2
11
5.1
6.1
4.1
1.2
3.1
2.2
2.1
3.2
1.1
4.2
6.2
5.2
12
6.1
1.2
5.1
2.2
4.1
3.2
3.1
4.2
2.1
5.2
1.1
6.2